Immunometabolism MS Profiling Service
Quantitative LC-MS/MS Analysis of Immune Cell Metabolic Reprogramming for Drug Discovery
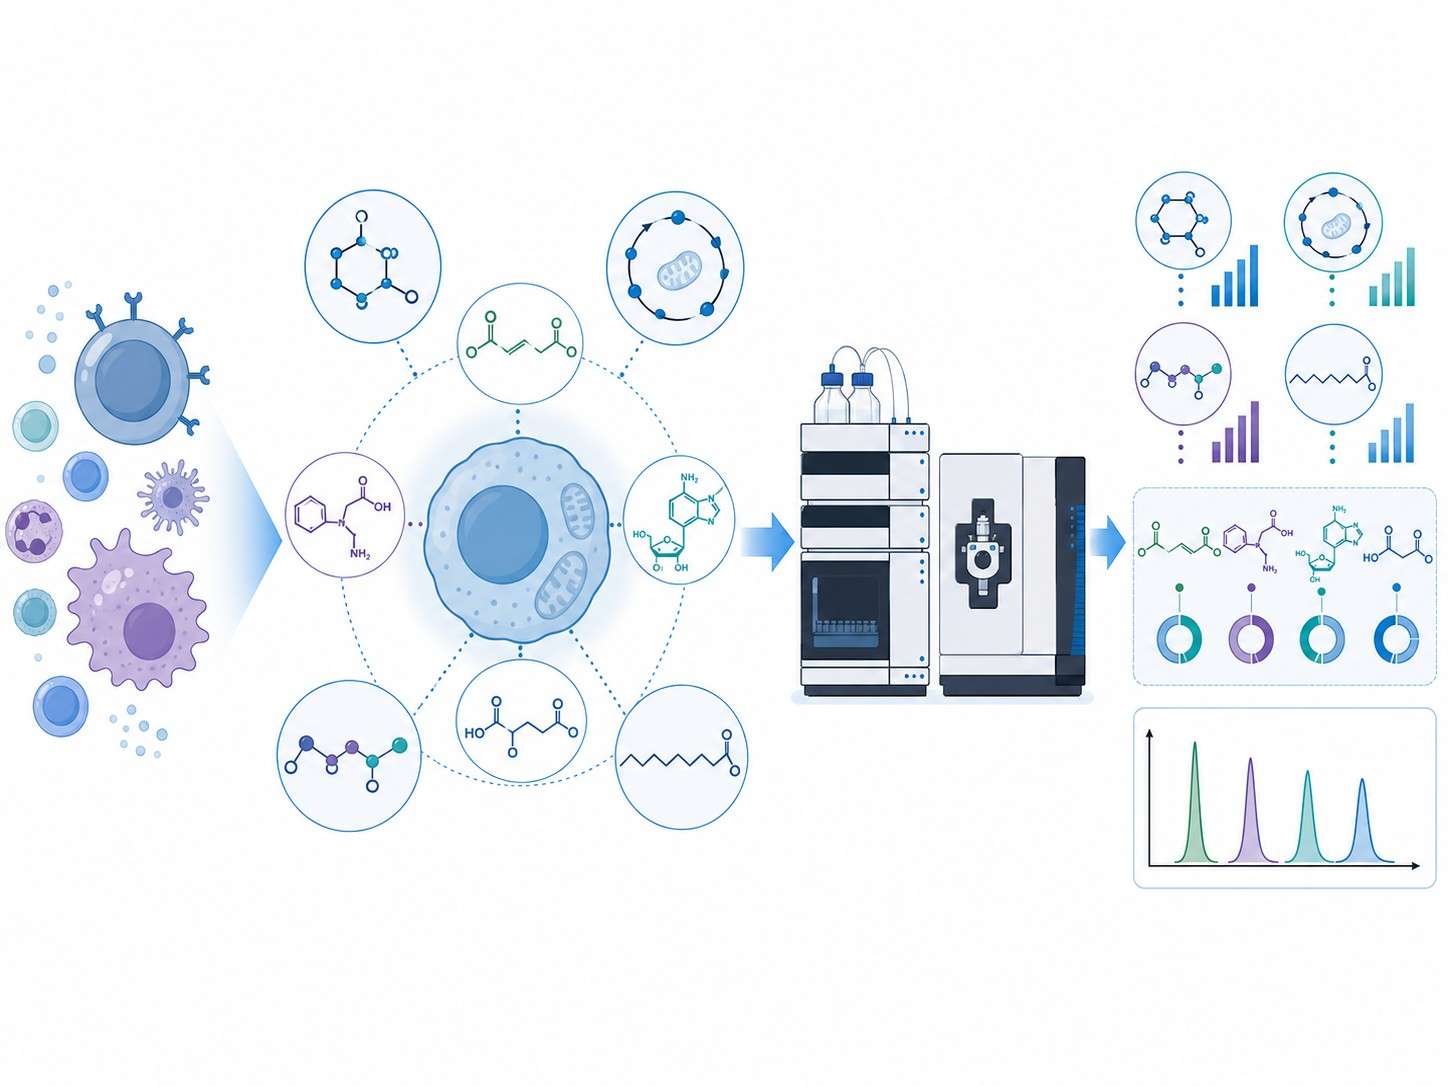
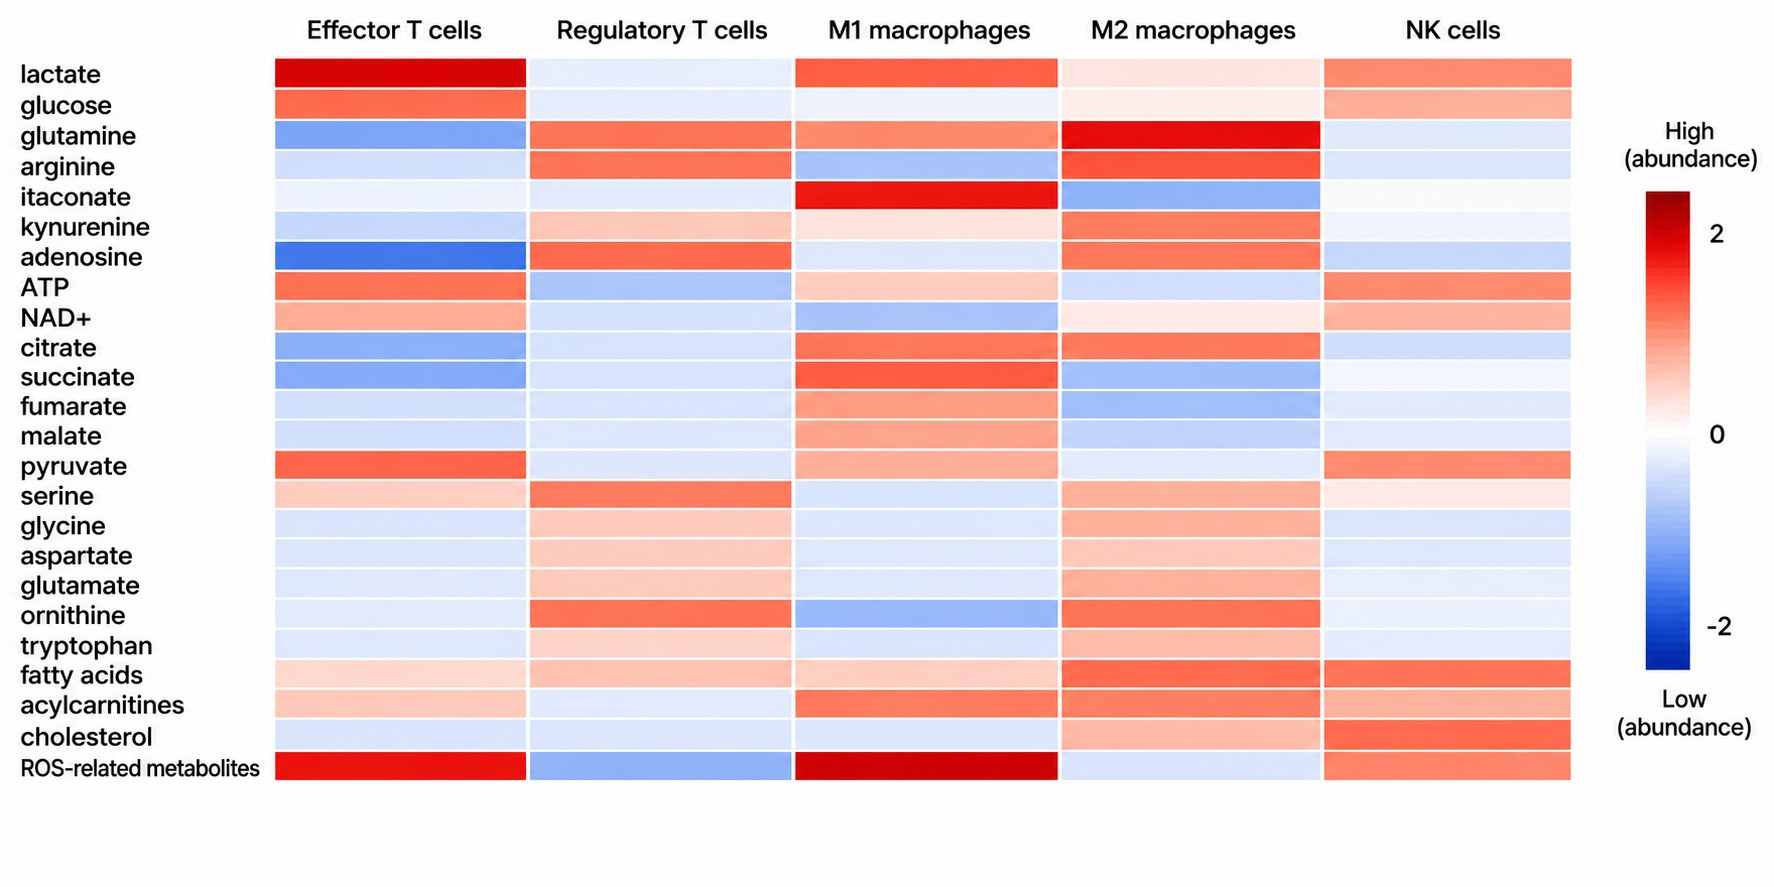
MassTarget™ Immunometabolism MS Profiling provides absolute quantification of 50+ immune-relevant metabolites from low-input immune cell samples, enabling functional characterization of T cell, macrophage, and NK cell metabolic phenotypes in immuno-oncology, autoimmune disease, and cell therapy development.
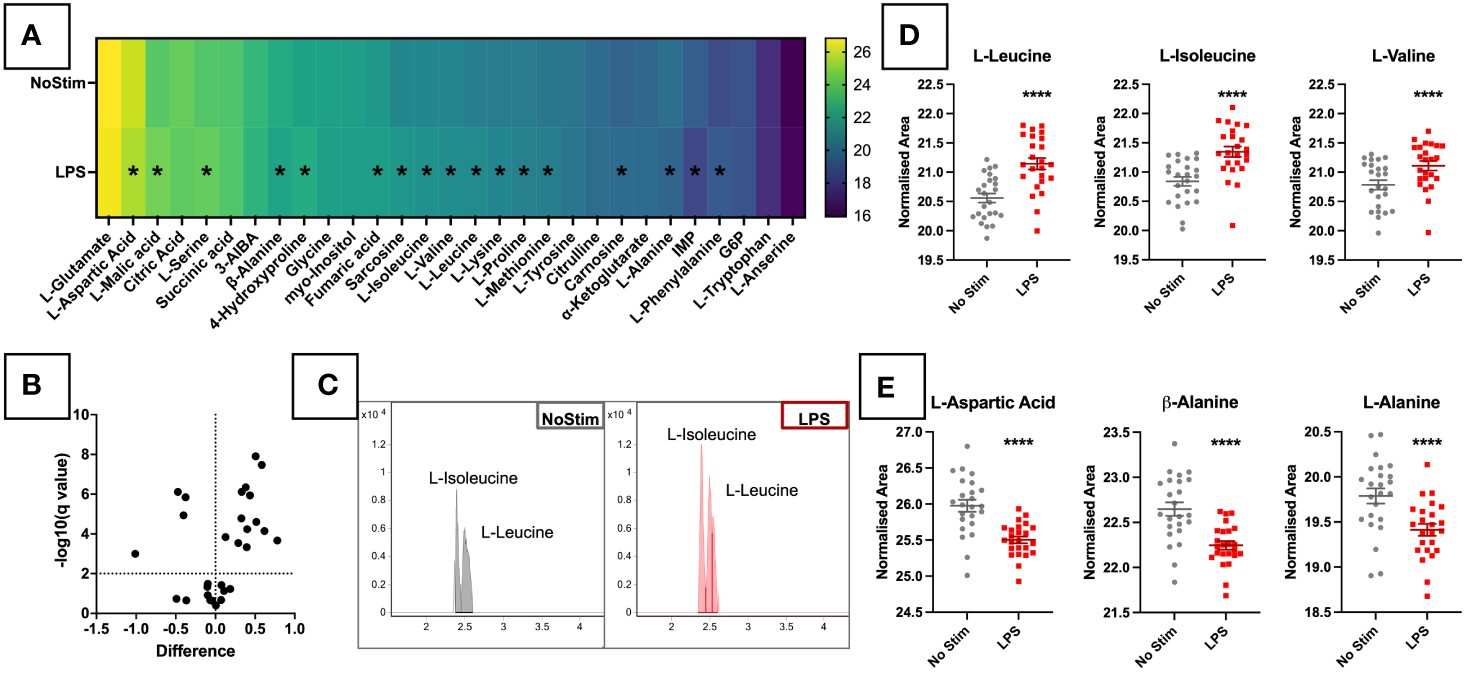
Immune cells undergo profound metabolic reprogramming upon activation, differentiation, or exhaustion. These metabolic signatures directly influence therapeutic outcomes — yet most metabolomics platforms are not designed for the unique challenges of immune cell analysis: limited cell numbers, labile signaling metabolites, and the need for immune-specific target panels.
Key Advantages:
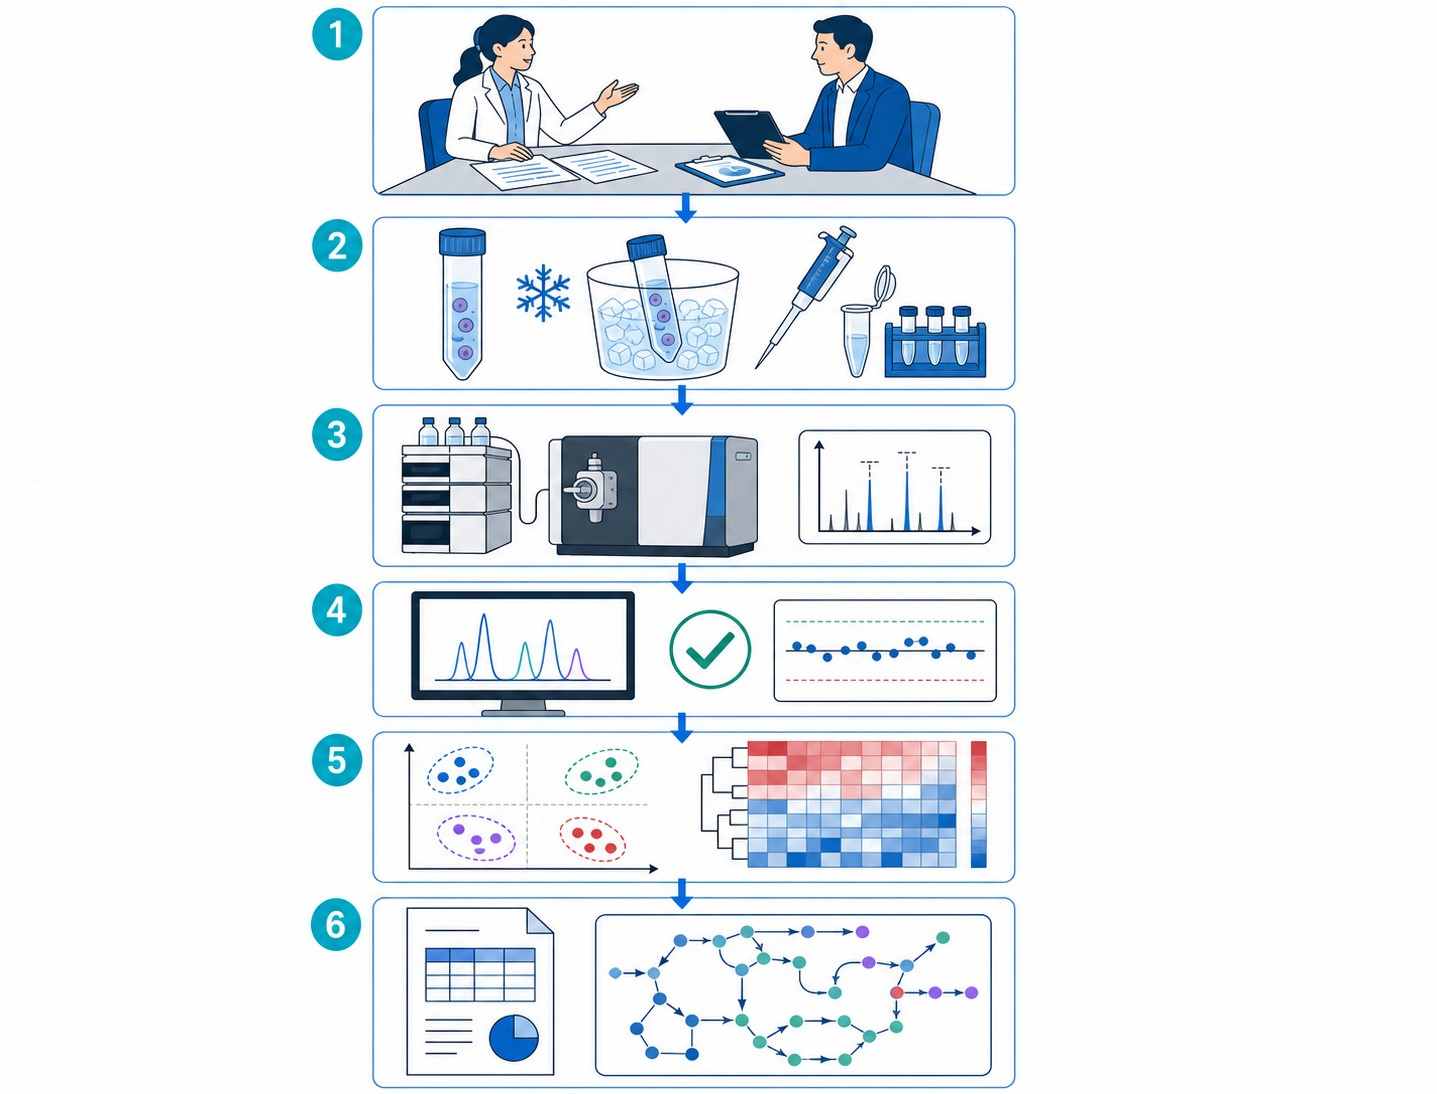
- Validated for <500,000 FACS-sorted cells — unlock precious immune subsets (TILs, Tregs, tissue-resident macrophages).
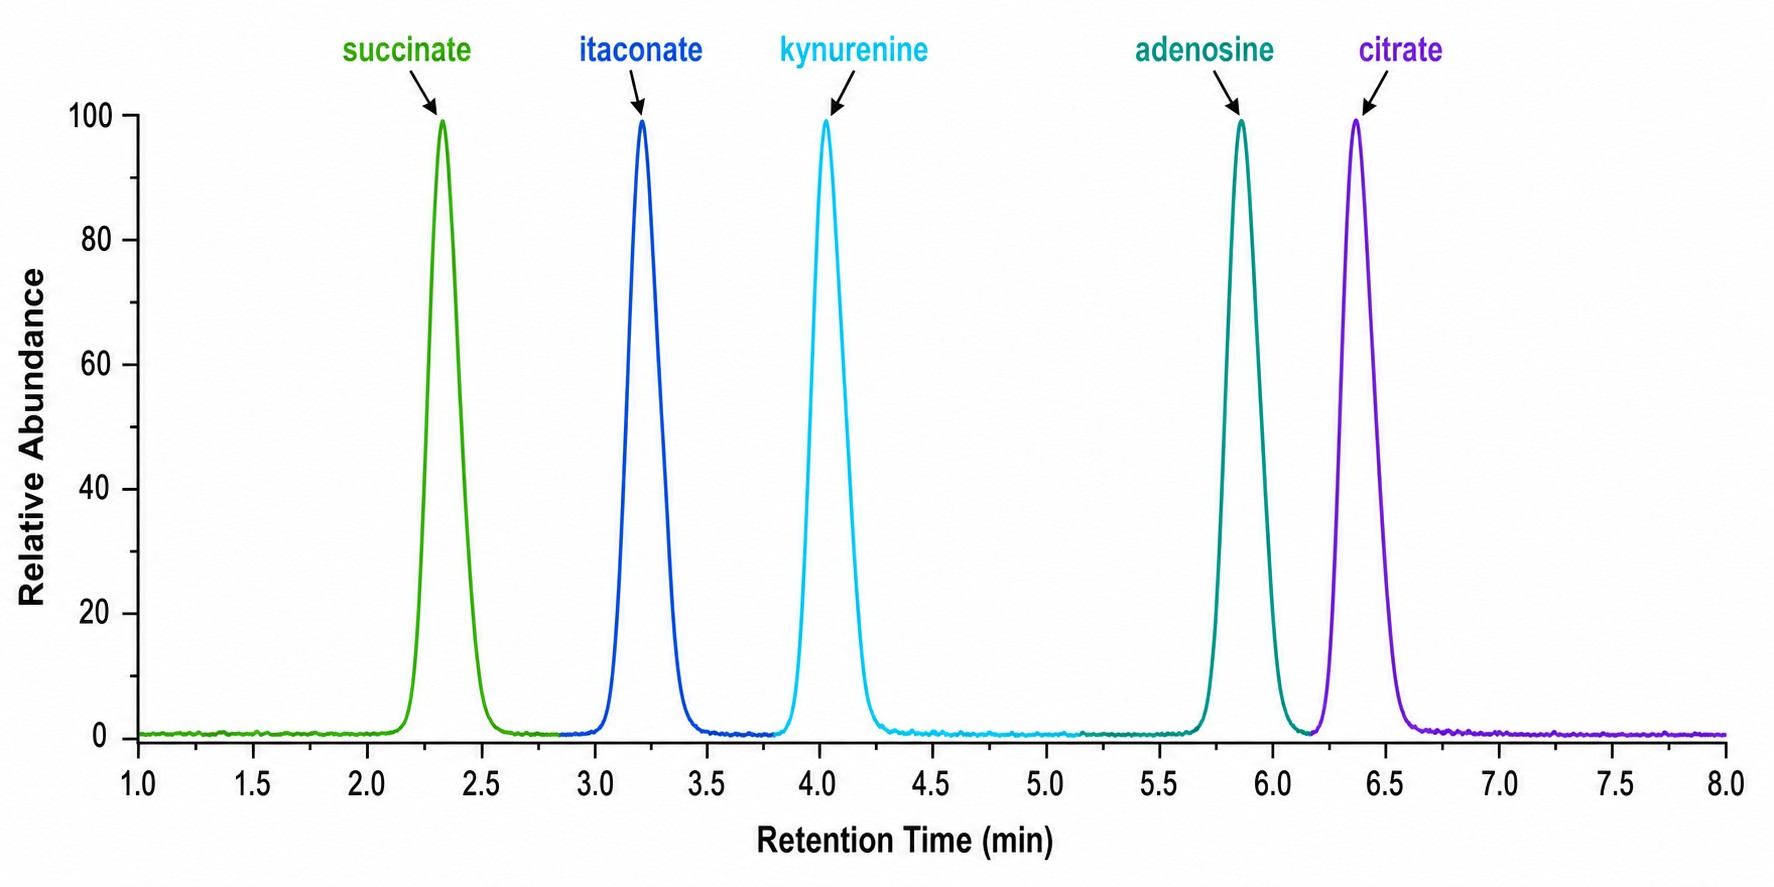
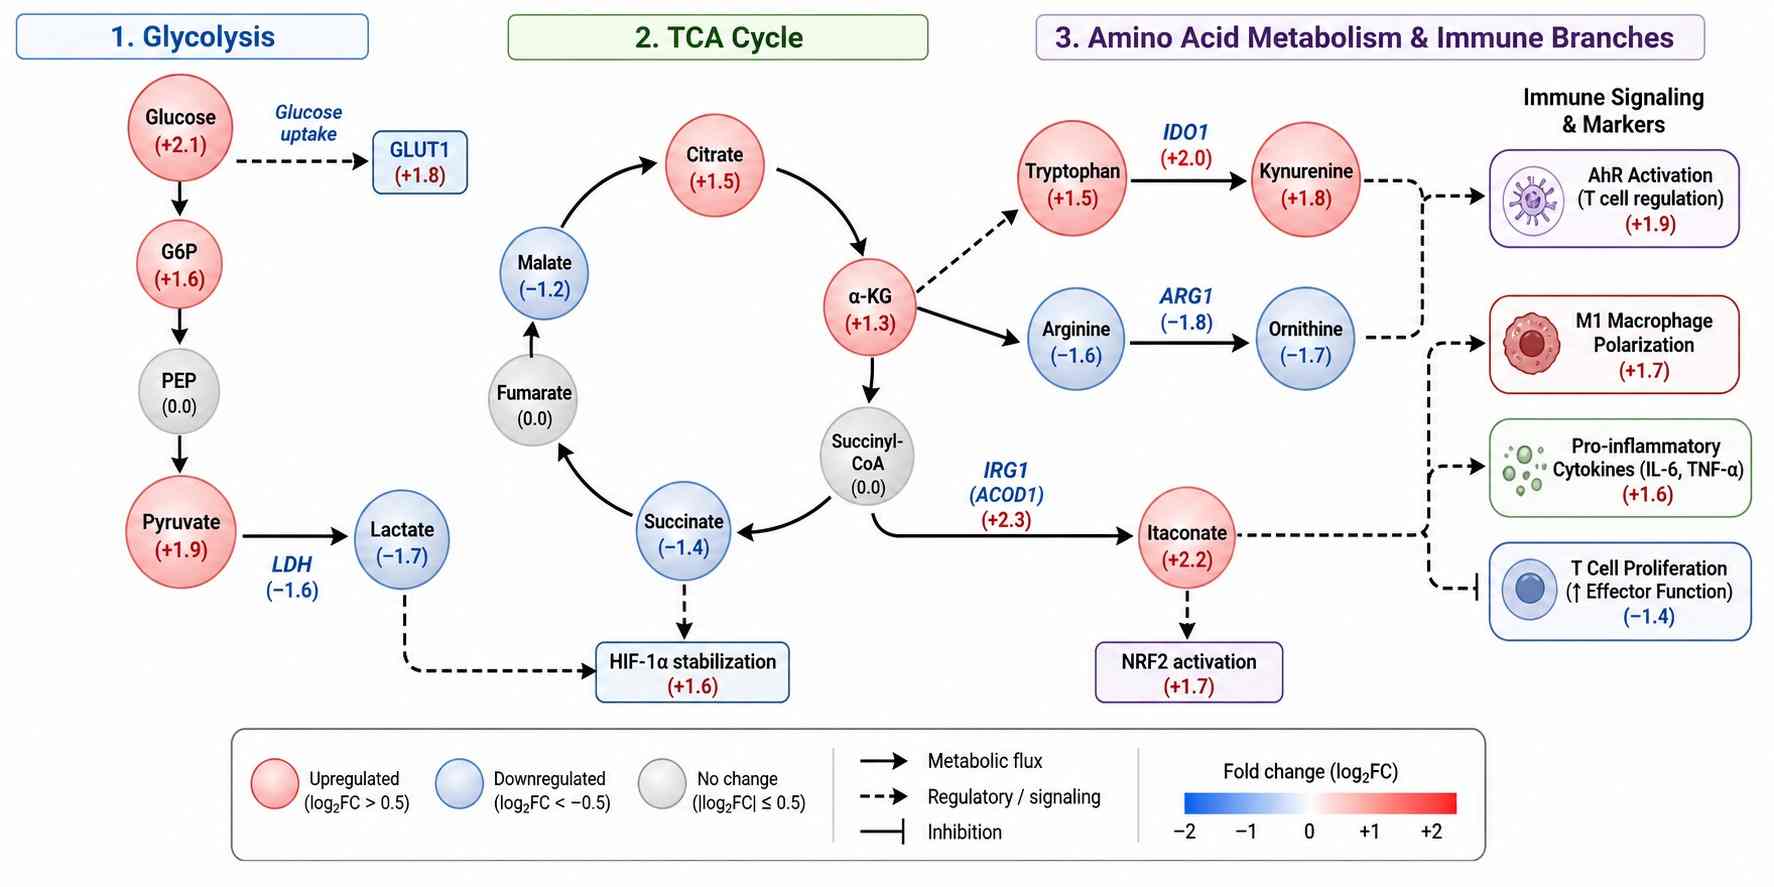
- Immune-centric panel covering 50+ targets across glycolysis, TCA cycle, amino acid metabolism, lipid mediators, and immune signaling metabolites (itaconate, kynurenine, adenosine, 2-HG).
- Absolute quantification using isotope-labeled internal standards for every target (R² ≥ 0.99, RSD < 15%).
- Integrated with the MassTarget™ platform for seamless multi-omics, ADME, and cell-based screening workflows.