Feature-Based Molecular Networking (FBMN) Service

Quantitative, multi-tool compatible molecular networking for untargeted metabolomics.

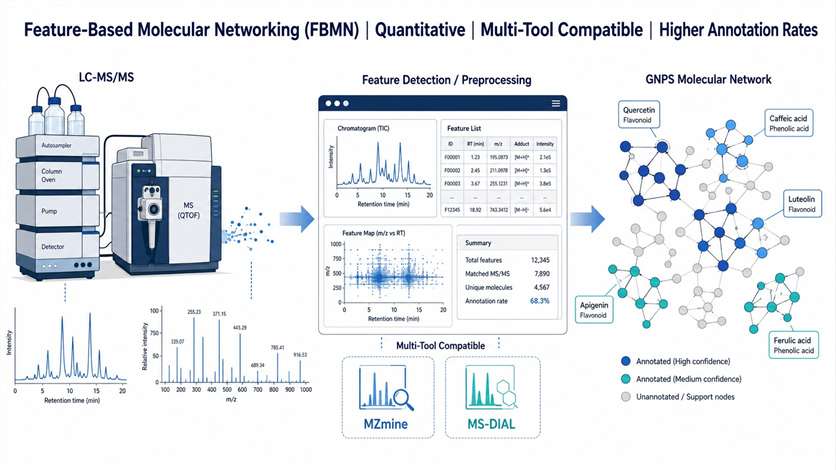
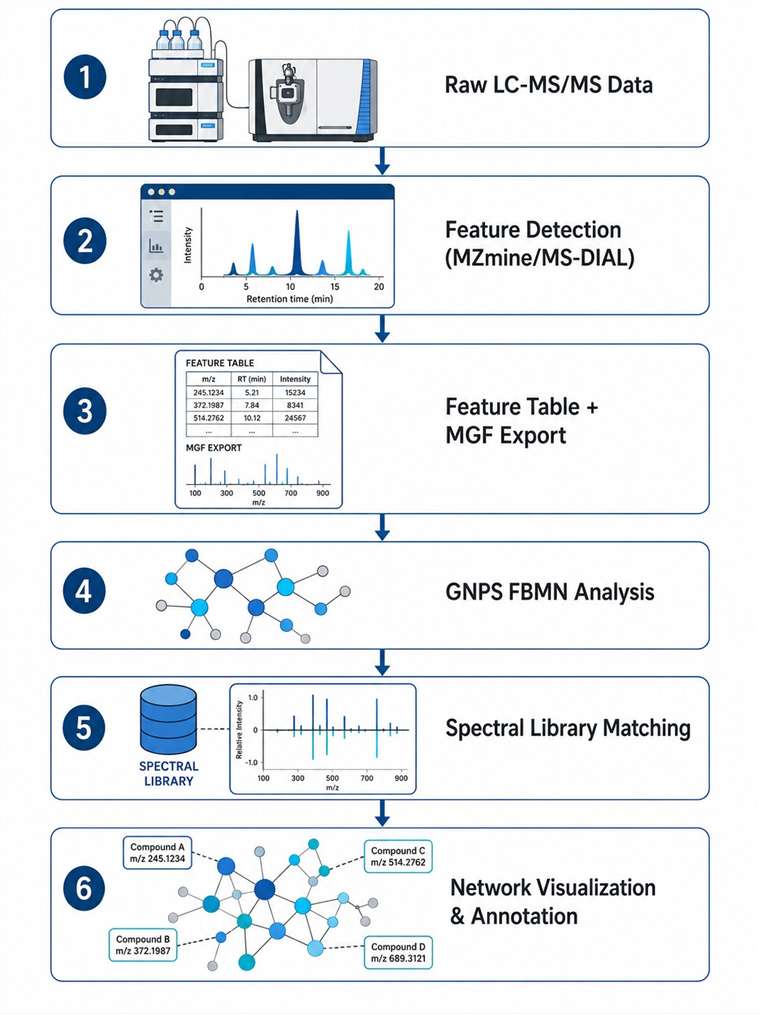
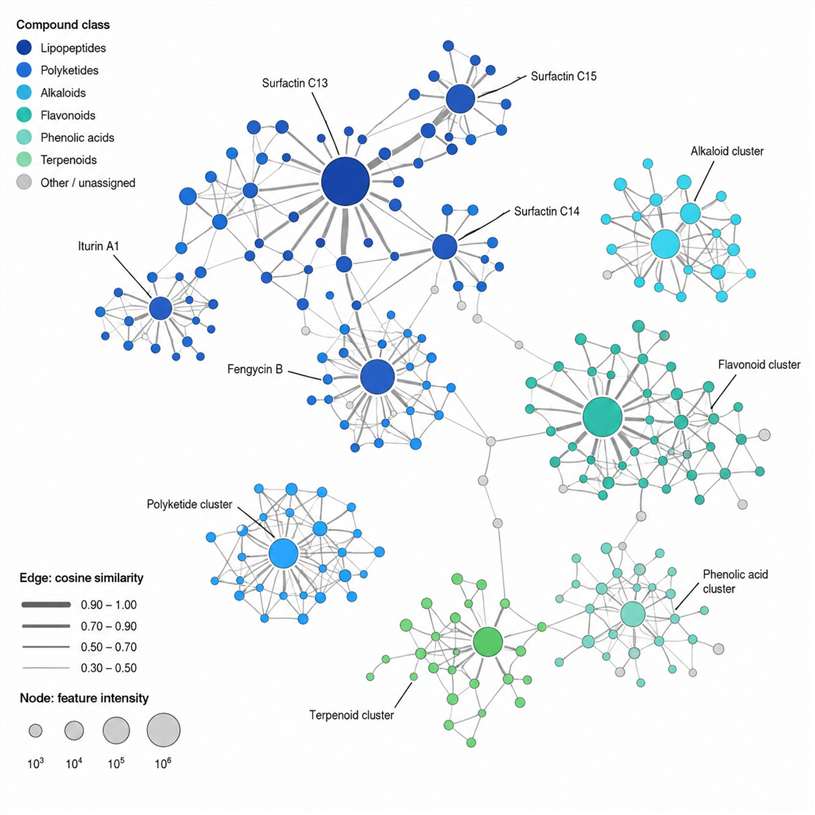
Feature-Based Molecular Networking (FBMN) is an advanced computational workflow that bridges popular LC-MS/MS data processing tools with the GNPS molecular networking environment. Unlike classical molecular networking, FBMN retains quantitative feature information — retention time, accurate mass, and intensity — from the preprocessing stage, enabling more accurate network construction, isomer resolution, and direct integration with statistical analysis.

At Creative Proteomics, we provide end-to-end FBMN analysis services for researchers working with untargeted metabolomics, natural product discovery, and MS-based chemical profiling. Our team handles the entire pipeline — from raw data preprocessing through feature detection, GNPS networking, spectral library matching, and biological interpretation — so you can focus on the science.

Key Advantages:

  • Quantitative feature retention for accurate network-based comparisons across sample groups.
  • Compatibility with MZmine 2/3, MS-DIAL, XCMS, Progenesis QI, MetaboScape, and OpenMS.
  • Support for isomer resolution, ion mobility spectrometry (IMS) data, and MSE acquisition.
  • Integrated statistical analysis with group-level comparisons and visualization.
Feature-based molecular networking concept with LC-MS/MS data processing and GNPS network visualization
What Is FBMN Advantages Workflow Tools Sample Case Study FAQ

What Is Feature-Based Molecular Networking (FBMN)?

Feature-Based Molecular Networking (FBMN) is a computational method developed within the Global Natural Products Social Molecular Networking (GNPS) infrastructure. It integrates feature detection from popular LC-MS/MS data processing tools with molecular networking analysis. The approach was first described by Nothias et al. in Nature Methods (2020) and has since become a standard workflow in untargeted metabolomics.

In classical molecular networking, MS/MS consensus spectra are clustered directly from raw data, without incorporating the quantitative feature information — retention time, accurate mass, and chromatographic peak intensity — that is routinely generated during preprocessing. FBMN overcomes this limitation by accepting the output of well-established preprocessing tools as direct input to the GNPS molecular networking workflow.

This integration provides several critical advantages: features with identical MS/MS spectra but different retention times (isomers) are resolved as distinct nodes; quantitative intensity values enable group-level statistical comparisons directly on the network; and the workflow handles data types that classical networking cannot, including ion mobility spectrometry (IMS) data and MSE acquisition from Waters instruments.

For researchers generating untargeted LC-MS/MS data in natural product chemistry, microbial metabolomics, clinical biomarker discovery, or environmental analysis, FBMN offers a powerful way to visualize chemical space, accelerate compound annotation, and prioritize novel molecules for downstream characterization. Learn more about our GNPS molecular networking capabilities.

Key Advantages of FBMN Over Classical Molecular Networking

Quantitative Feature Retention

FBMN retains chromatographic peak intensities from preprocessing, enabling direct quantitative comparisons across sample groups within the network visualization. Classical MN discards this information entirely.

Isomer Resolution

Features with identical MS/MS spectra but different retention times are resolved as distinct nodes in FBMN, whereas classical MN merges them into a single consensus spectrum node.

Multi-Tool Compatibility

FBMN accepts input from MZmine 2/3, MS-DIAL, XCMS, Progenesis QI, MetaboScape, and OpenMS — letting researchers use their preferred preprocessing workflow.

Ion Mobility & MSE Support

FBMN can process ion mobility spectrometry (IMS) data and MSE (Waters all-ions acquisition) data, which are not compatible with classical molecular networking.

Integrated Statistical Analysis

FBMN supports group-level statistical comparisons (t-tests, ANOVA) directly on the network, with results visualized as box plots or heatmaps overlaid on the molecular network.

Higher Annotation Rates

By incorporating retention time and accurate mass information, FBMN improves spectral library matching accuracy and enables more confident compound annotations compared with classical MN.

These advantages make FBMN particularly valuable for comparative metabolomics, where quantitative changes between experimental conditions must be mapped onto chemical structural relationships. For dereplication workflows, our LC-HRMS/MS dereplication service complements FBMN by providing targeted identification of known compounds.

FBMN Workflow

Our FBMN service follows a standardized six-stage pipeline designed for reproducibility, quality control, and comprehensive annotation. We can start from raw instrument data or accept preprocessed feature tables, depending on your project needs.

1

Data Preprocessing & QC

Raw LC-MS/MS data are inspected for quality: base peak intensity, retention time stability, mass accuracy, and blank signal evaluation. We confirm all files are suitable for downstream analysis.

2

Feature Detection & Alignment

Using your chosen preprocessing tool (MZmine, MS-DIAL, XCMS, or others), we perform feature detection, deisotoping, adduct annotation, and cross-sample alignment. Parameters are optimized for your specific data type and instrument platform.

3

Feature Table & MGF Export

The processed feature table (CSV/TXT) and associated MS/MS spectra (MGF) are exported with consistent feature IDs linking quantitative data to fragmentation spectra. Metadata tables are prepared for group comparisons.

4

GNPS FBMN Analysis

The feature table and MGF file are submitted to the GNPS FBMN workflow. Key parameters — precursor/fragment mass tolerance, minimum cosine score, minimum matched peaks — are optimized for your dataset.

5

Spectral Library Matching

Network nodes are matched against GNPS spectral libraries (NIST, MassBank, MoNA, and community libraries). Dereplication and analog searching are performed for known compound identification.

6

Network Visualization & Report

The annotated molecular network is visualized in Cytoscape with color-coded compound classes, intensity heatmaps, and statistical overlays. A comprehensive report is prepared with key findings and annotated compound lists.

FBMN workflow diagram showing six steps from raw data to network visualization

Supported Data Processing Tools

FBMN is designed to be tool-agnostic at the preprocessing stage. We support all major LC-MS/MS data processing platforms, allowing you to use your existing workflow or leverage our expertise with the tool best suited to your data type.

ToolSupported VersionsKey StrengthsBest For
MZmine 2 / 32.53, 3.xComprehensive feature detection, ADAP chromatography builder, ion identity networkingHigh-resolution LC-MS/MS data from any vendor; most widely used FBMN preprocessing tool
MS-DIAL4.x, 5.xBuilt-in MS/MS deconvolution, CCS prediction for IMS data, comprehensive lipidomics supportIon mobility (IMS-MS) data, MSE data, lipidomics, and large cohort studies
XCMS3.x (R)Robust retention time correction, centWave feature detection, CAMERA annotationR users, legacy workflows, large clinical metabolomics datasets
Progenesis QILatestAutomated alignment, intuitive interface, integrated identificationWaters data (.raw), label-free proteomics and metabolomics
MetaboScape2023+Bruker-specific T-ReX processing, CCS-aware feature detection, TimsTOF supportBruker TIMS-TOF data, trapped ion mobility spectrometry
OpenMS2.8+Flexible workflow engine, TOPP tools, KNIME integrationCustom processing pipelines, automated high-throughput workflows

If you use a tool not listed here, contact us — we can often accommodate custom preprocessing workflows. For comprehensive natural product profiling, our natural product MS discovery service integrates FBMN with targeted isolation and structural characterization.

Sample Requirements

To ensure optimal FBMN results, we recommend the following sample preparation guidelines. We accept both raw instrument data and preprocessed feature tables.

Sample TypeRecommended AmountConcentrationFormatNotes
LC-MS/MS Raw Data≥3 biological replicates per groupN/AThermo .raw, SCIEX .wiff, Agilent .d, Bruker .dProvide acquisition method details (column, gradient, MS settings)
Preprocessed Feature TableOne table per datasetN/ACSV or TXT (MZmine/MS-DIAL export)Feature IDs must match MGF scan numbers
MS/MS Spectra (MGF)One file per datasetN/AMGF formatExport from same preprocessing run as feature table
Metadata TableOne file per projectN/ACSV or TXTSample names, group assignments, and experimental factors
Blank / QC Samples≥1 per batchN/ASame format as samplesUsed for background subtraction and quality control

For projects involving complex sample matrices, we recommend including pooled QC samples injected at regular intervals throughout the analytical run to monitor system stability and enable signal correction.

Deliverables

Upon completion of your FBMN analysis, you will receive a comprehensive data package that includes all raw and processed outputs for downstream use and publication.

  • Feature quantification table — Complete feature list with retention time, m/z, intensity across all samples, and group-level statistics.
  • Molecular network file — Cytoscape-compatible network file (.graphml or .xgmml) with full annotation metadata.
  • GNPS job link — Direct link to the interactive FBMN result page on the GNPS platform for online exploration.
  • Spectral library match results — Annotated compound list with match scores, library identifiers, and MS/MS mirror plots.
  • Annotation report — Summary of all identified compounds, including dereplication results and putative novel annotations.
  • Statistical analysis — Group-level comparison results (fold change, p-values, VIP scores) mapped onto the molecular network.
  • Custom visualizations — Publication-ready figures including network maps, intensity heatmaps, and box plots.

For deeper structural investigation of specific network subclusters, our MS2LDA substructure discovery service can be integrated to identify conserved fragmentation motifs within your dataset.

FBMN vs. Classical Molecular Networking: A Technical Comparison

Understanding the technical differences between FBMN and classical molecular networking is essential for selecting the right approach for your metabolomics project. The table below compares both methods across key dimensions.

DimensionClassical Molecular NetworkingFeature-Based Molecular Networking (FBMN)
Feature detection approachMS/MS consensus spectra clustered directly from raw data; no chromatographic feature detectionFeatures detected and quantified by dedicated preprocessing tools (MZmine, MS-DIAL, XCMS) before networking
Quantitative data retentionNot retained — only MS/MS spectral similarity is used for network constructionRetention time, accurate mass, and intensity values carried through the entire workflow
Isomer resolutionIsomers with identical MS/MS spectra merged into a single consensus nodeIsomers resolved as distinct nodes based on retention time differences
Tool compatibilityGNPS-only; no external preprocessing tool integrationCompatible with MZmine 2/3, MS-DIAL, XCMS, Progenesis QI, MetaboScape, OpenMS
Ion mobility / MSE supportNot supportedFully supported — IMS data (drift time, CCS) and MSE data can be processed
Statistical integrationNot available — no quantitative data to analyzeGroup-level statistics (t-tests, ANOVA, fold change) computed and visualized on the network
Annotation workflowLibrary matching only; no retention time or CCS filteringLibrary matching with retention time filtering, CCS filtering (for IMS data), and feature-level metadata
Output formatGNPS web visualization; basic Cytoscape exportGNPS interactive network + Cytoscape file with full quantitative and annotation metadata

For projects requiring both molecular networking and bioassay-driven prioritization, our bioassay-guided fractionation service can be combined with FBMN to accelerate the discovery of bioactive natural products.

Representative FBMN Data

FBMN molecular network visualization with color-coded compound class clusters

FBMN molecular network showing compound class clustering

Case Study: FBMN for Depsipeptide Fragmentation Analysis

Selegato, D.M., Zanatta, A.C., Pilon, A.C., Veloso, J.H., Castro-Gamboa, I. "Application of feature-based molecular networking and MassQL for the MS/MS fragmentation study of depsipeptides." Frontiers in Molecular Biosciences 10:1238475 (2023). https://doi.org/10.3389/fmolb.2023.1238475

Background

Depsipeptides are a class of non-ribosomal peptides with significant pharmacological potential, but their structural complexity — cyclic backbones, non-standard amino acids, and multiple ion adduct forms — makes MS/MS fragmentation analysis challenging. The authors aimed to develop a combined FBMN and MassQL strategy to systematically characterize depsipeptide fragmentation pathways in extracts of the fungus Fusarium oxysporum.

Methods

The study employed LC-MS/MS analysis of F. oxysporum extracts at multiple collision energies (25, 50, and 70 eV). Key analytical steps included:

  • PCA of MS/MS data at different collision energies to identify energy-dependent fragmentation patterns.
  • FBMN analysis using MZmine preprocessing followed by GNPS molecular networking, separately for protonated [M+H]+ and sodiated [M+Na]+ ion adducts.
  • MassQL query design targeting diagnostic fragment ions to search for beauvericin-related compounds across the entire dataset.
  • Cross-validation of FBMN clusters with MassQL results to identify both known and novel beauvericin analogs.

Results

The FBMN analysis revealed distinct clustering patterns for protonated versus sodiated beauvericin ions at different collision energies (Figure 3). Key findings included:

  • Identification of two diagnostic ion series: m/z 134, 244, 262, 362 for protonated species and m/z 266, 284, 384 for sodiated species.
  • Discovery of two previously unreported beauvericin analogs (compounds 1 and 2) containing an unusual methionine sulfoxide residue, characterized by a diagnostic 64 Da neutral loss corresponding to methanesulfenic acid.
  • MassQL queries identified additional beauvericin-related ions that were not captured by FBMN alone, demonstrating the complementary value of both approaches.
  • Structural isomers at m/z 806 and m/z 792 were resolved as distinct nodes in the FBMN network, with different retention times and fragmentation patterns confirming their identity as distinct compounds.

Conclusions

The study demonstrated that combining FBMN with MassQL provides a powerful strategy for deconvoluting complex MS/MS fragmentation data in natural product research. FBMN enabled the visualization of chemical relationships and the discovery of novel analogs, while MassQL provided targeted, sensitive detection of specific compound classes. This integrated approach significantly accelerated the annotation process and improved coverage of the chemical space present in the fungal extract.

FBMN of beauvericin analogs at 25, 50, and 70 eV collision energies

Figure 3 from Selegato et al. (2023): FBMN of beauvericin analogs at 25, 50, and 70 eV collision energies. Nodes are colored by precursor ion mass (yellow = low m/z, purple = high m/z). (Source: https://doi.org/10.3389/fmolb.2023.1238475, Fig. 3)

FAQ

Frequently Asked Questions

Q: What is the difference between FBMN and classical molecular networking?

FBMN integrates quantitative feature information — retention time, accurate mass, and intensity — from LC-MS/MS preprocessing tools into the molecular networking workflow. Classical molecular networking uses only MS/MS consensus spectra and discards this quantitative data. FBMN enables isomer resolution, quantitative comparisons across sample groups, and compatibility with ion mobility and MSE data — capabilities that classical MN does not provide.

Q: Which LC-MS/MS data processing tools are compatible with your FBMN service?

We support MZmine 2/3, MS-DIAL, XCMS, Progenesis QI, MetaboScape, and OpenMS. You can upload your preprocessed feature table and MGF file, or we can process raw data from any major instrument vendor (Thermo, SCIEX, Agilent, Bruker, Waters). Our team will select and optimize the most appropriate preprocessing tool for your specific data type.

Q: What types of samples are suitable for FBMN analysis?

FBMN is applicable to any untargeted LC-MS/MS dataset. Common applications include natural product extracts (microbial, plant, marine), clinical biofluids (plasma, serum, urine), microbial metabolomics, plant and food metabolomics, environmental samples, and lipidomics. The method is particularly powerful for comparative metabolomics across multiple experimental conditions.

Q: What deliverables will I receive from your FBMN service?

You will receive a comprehensive data package including: a feature quantification table with group-level statistics, a Cytoscape-compatible molecular network file with full annotation metadata, a direct link to the interactive GNPS FBMN result page, spectral library match results with MS/MS mirror plots, an annotation report summarizing all identified compounds, statistical analysis results mapped onto the network, and publication-ready figures.

Q: How long does a typical FBMN analysis take?

Standard FBMN analysis is completed within 5–10 business days from data receipt. The timeline depends on dataset size, the number of sample groups, and the complexity of the annotation requirements. Rush services are available for time-sensitive projects. We will provide a detailed timeline during project scoping.

Q: Can I run FBMN myself on GNPS for free? Why should I use your service?

GNPS is a powerful open platform, and the FBMN workflow is freely available. However, optimal parameter selection, data preprocessing quality control, spectral interpretation, and biological contextualization require significant expertise. Our service provides end-to-end support from experienced bioinformaticians who have processed hundreds of metabolomics datasets. We handle parameter optimization, quality control, comprehensive annotation, and deliver publication-ready results — saving you weeks of trial-and-error and ensuring the highest quality output.

References

  1. Nothias, L.-F., Petras, D., Schmid, R. et al. Feature-based molecular networking in the GNPS analysis environment. Nat. Methods 17, 905–908 (2020).
  2. Wang, M. et al. Sharing and community curation of mass spectrometry data with Global Natural Products Social Molecular Networking. Nat. Biotechnol. 34, 828–837 (2016).
  3. Schmid, R. et al. Statistical analysis of feature-based molecular networking results from non-targeted metabolomics data. Nat. Protoc. 19, 2157–2198 (2024).

For research use only. Not for use in diagnostic or clinical procedures.

Plan Your FBMN Analysis with the MassTarget™ Team

Submit your LC-MS/MS data for expert FBMN analysis. Our bioinformaticians will design an optimized workflow for your specific research question.

Online Inquiry

Please submit a detailed description of your project. We will provide you with a customized project plan to meet your research requests. You can also send emails directly to for inquiries.

* Email
Phone
* Service & Products of Interest
Services Required and Project Description