MS-Based Apoptosis Markers Analysis

Targeted mass spectrometry for simultaneous, absolute quantification of key apoptosis-related proteins — from caspase activation to PARP cleavage — in a single LC-MS/MS run.

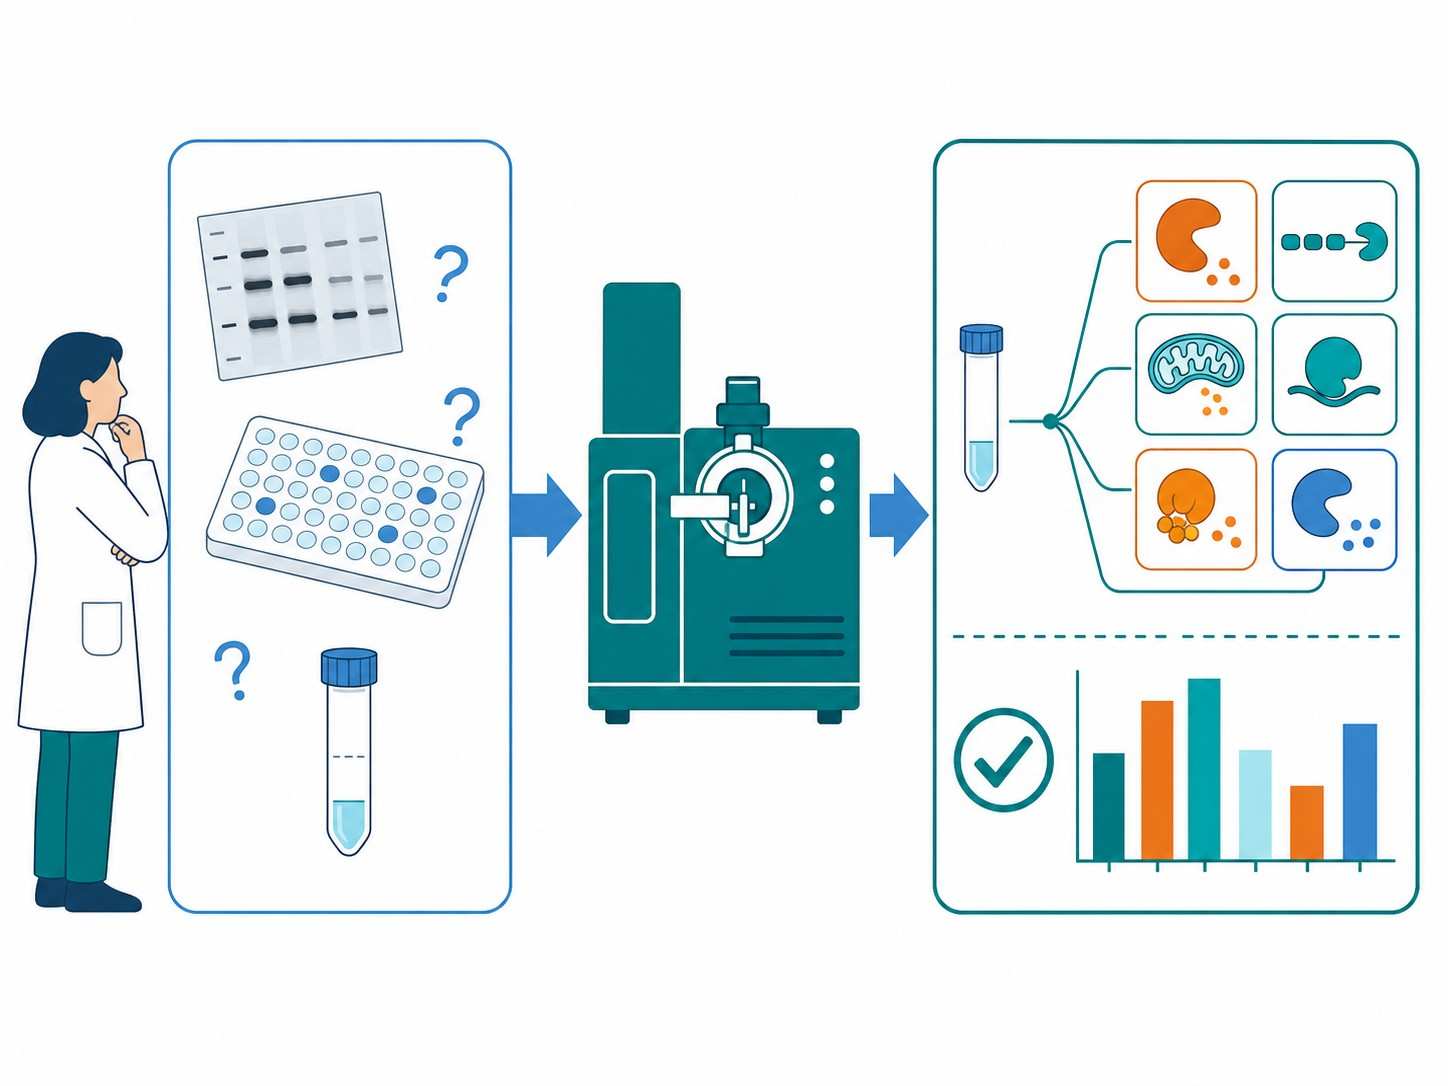
MS-based apoptosis markers analysis is a targeted mass spectrometry approach that enables simultaneous, absolute quantification of key apoptosis-related proteins — including caspases, cleaved PARP, cytochrome c, and Bcl-2 family members — from a single sample injection, providing comprehensive apoptosis pathway profiling with superior specificity and dynamic range compared to conventional antibody-based methods.

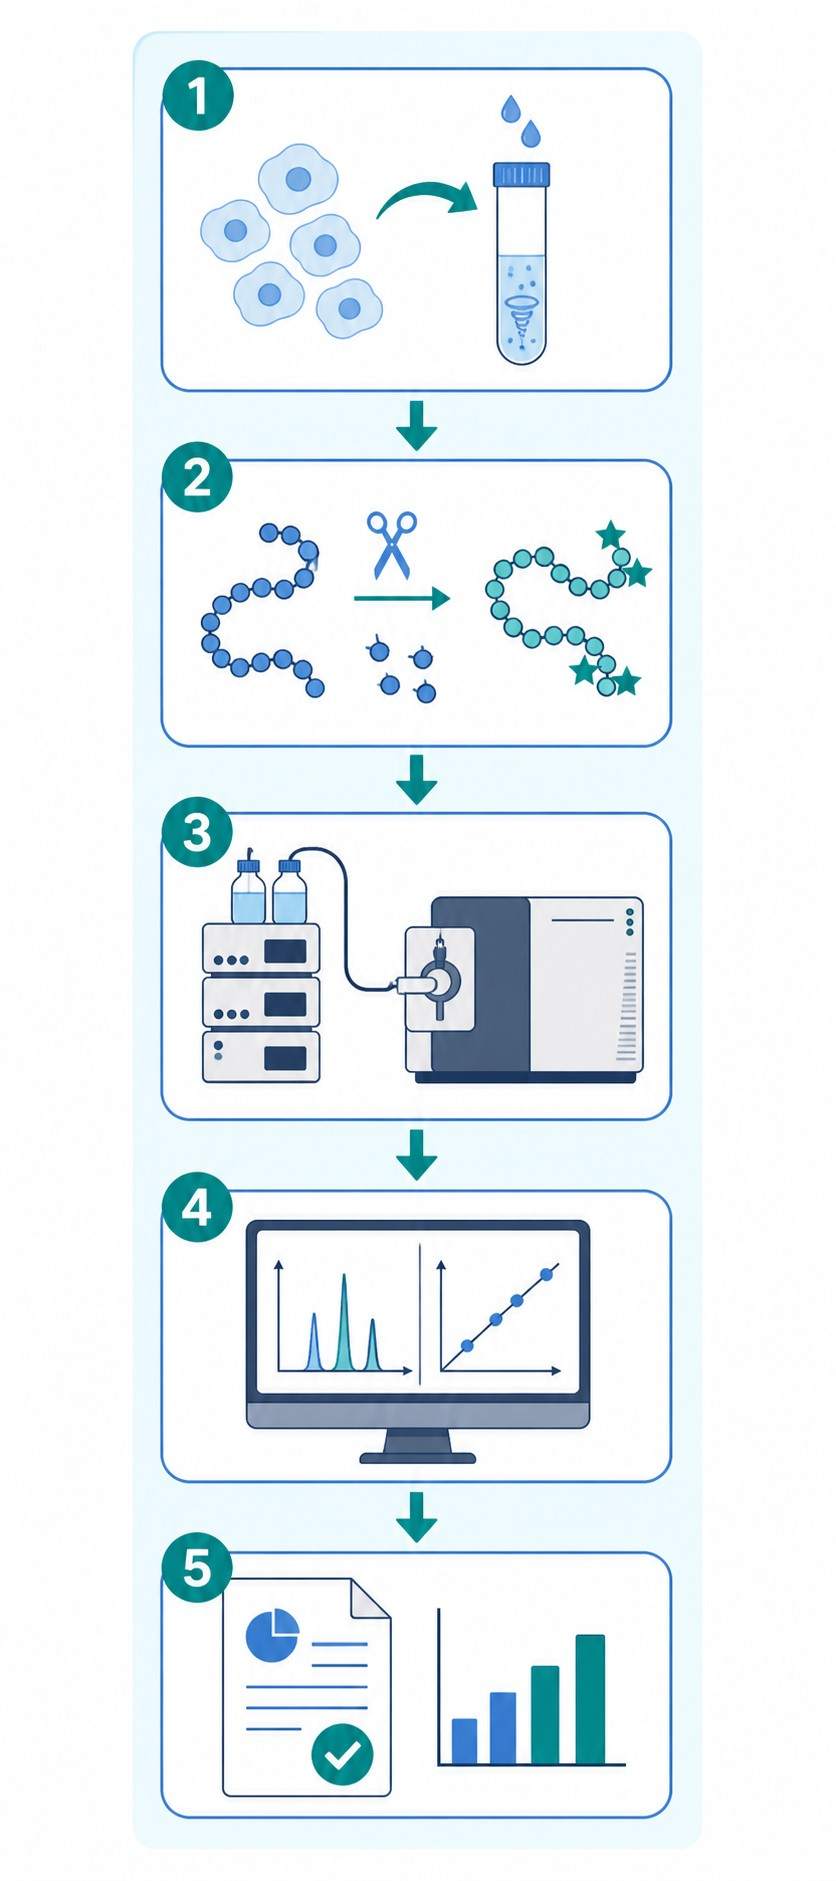
At Creative Proteomics, our MassTarget™ platform provides a fully integrated MS-based apoptosis marker analysis service, from method development through sample processing, data acquisition, and bioinformatics reporting, supporting preclinical drug discovery programs across oncology, neurology, and immuno-oncology.

Key Advantages:

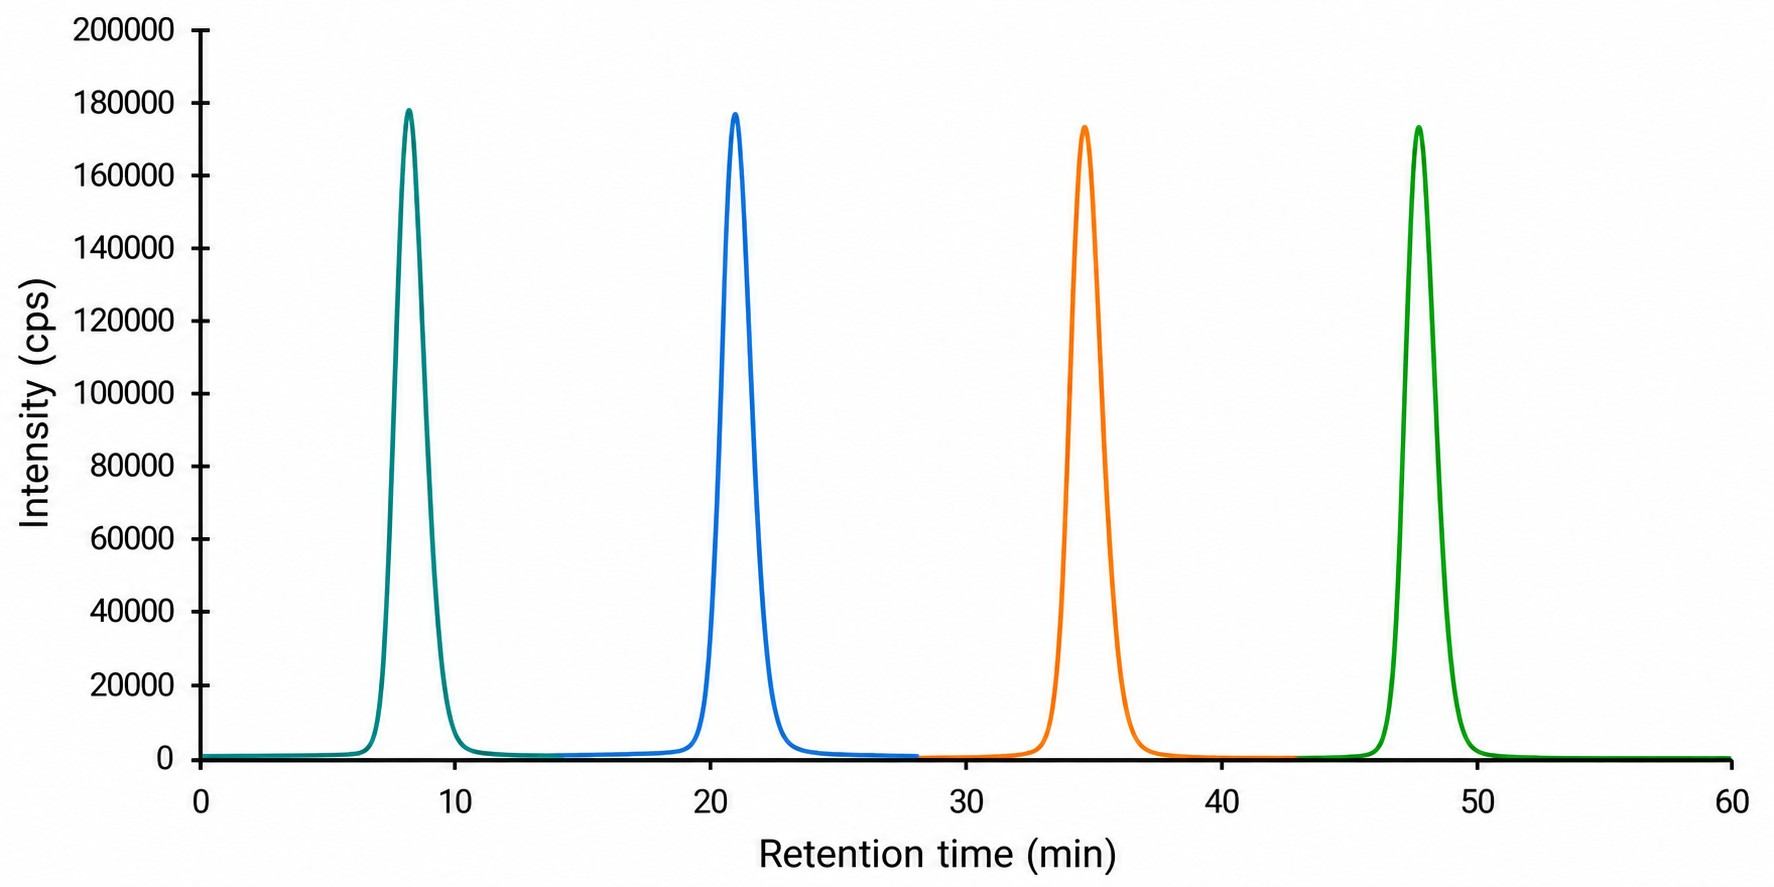
  • Multiplex quantification of 10+ apoptosis markers in a single LC-MS/MS run.
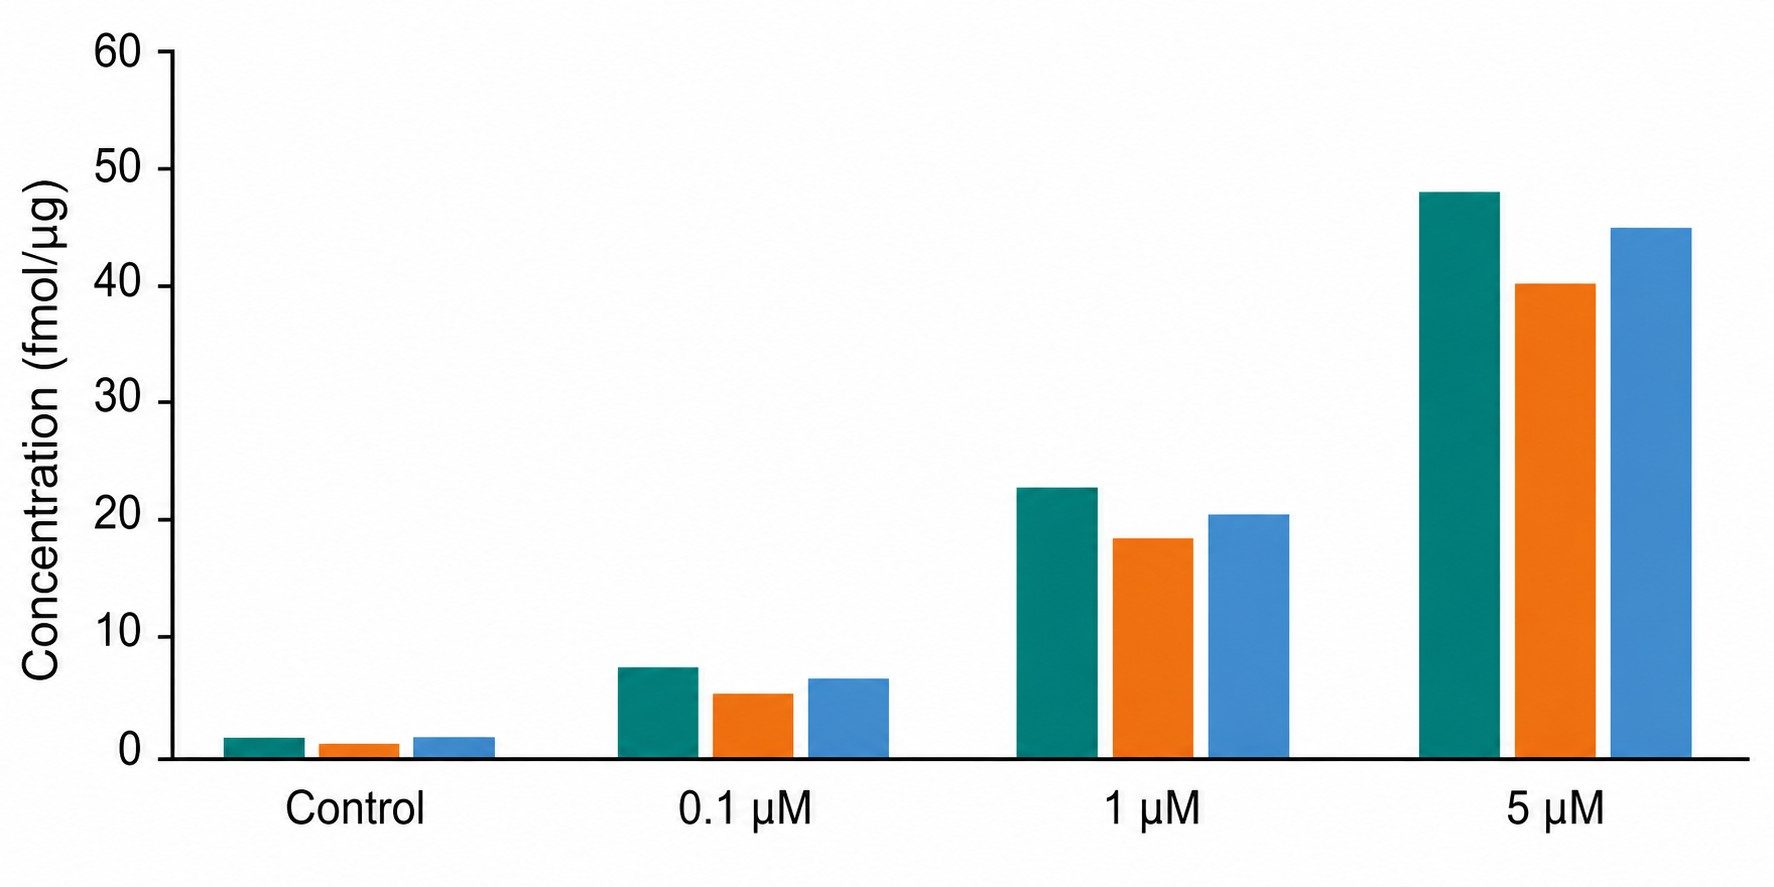
  • Absolute quantification with stable isotope-labeled internal standards.
  • Isoform-specific detection of cleaved vs. full-length caspases and PARP.
  • 50-100× wider dynamic range than Western blot.
  • Requires 5-10× less sample than equivalent ELISA panel.
  • Custom panel design for your specific apoptosis markers of interest.
MS-based apoptosis markers analysis workflow diagram showing sample preparation, LC-MS/MS acquisition, and multiplex marker quantification for drug discovery applications.
What Is Apoptosis MS Key Markers Workflow Demo Sample Comparison Applications Case Study FAQ

What Is MS-Based Apoptosis Markers Analysis?

Apoptosis, or programmed cell death, is a fundamental biological process central to development, tissue homeostasis, and the pathogenesis of numerous diseases including cancer, neurodegenerative disorders, and autoimmune conditions. The accurate quantification of apoptosis markers is critical for drug discovery programs targeting these pathways.

MS-based apoptosis markers analysis leverages liquid chromatography-tandem mass spectrometry (LC-MS/MS) in targeted acquisition modes — multiple reaction monitoring (MRM) or parallel reaction monitoring (PRM) — to achieve precise, multiplexed quantification of apoptosis-related proteins. The methodology relies on the selection of proteotypic signature peptides unique to each target protein, combined with stable isotope-labeled (SIS) peptide internal standards for absolute quantification.

Unlike conventional antibody-based methods such as Western blot, ELISA, or immunohistochemistry, MS-based analysis offers several fundamental advantages. It provides absolute quantification (not relative fold-change), enables simultaneous detection of 10-15 markers from a single sample, and can unambiguously distinguish between cleaved (active) and full-length (pro-form) protein isoforms by targeting cleavage-site-spanning signature peptides. This technical capability is particularly valuable for apoptosis research, where the activation state of caspases and the cleavage status of downstream substrates like PARP are the key determinants of apoptotic commitment.

For related cell-based screening approaches, explore our cell-based MS drug screening service.

Key Apoptosis Markers Quantified by Mass Spectrometry

The apoptosis signaling cascade involves a coordinated network of proteins that can be broadly categorized by their functional roles. MS-based targeted proteomics enables the simultaneous quantification of markers across all major nodes of the apoptosis pathway.

Initiator Caspases (Caspase-8, -9)

Caspase-8 and caspase-9 serve as the apical proteases for the extrinsic (death receptor) and intrinsic (mitochondrial) apoptosis pathways, respectively. Upon activation, these initiator caspases undergo proteolytic cleavage to generate active fragments. MS-based quantification can specifically detect the cleaved active forms by targeting signature peptides that span or flank the cleavage sites. For caspase-8, we quantify the p18 active subunit generated after cleavage at Asp384; for caspase-9, the p35 large subunit after cleavage at Asp315.

Effector Caspases (Caspase-3, -7)

Caspase-3 and caspase-7 are the executioner caspases that cleave multiple cellular substrates to orchestrate the apoptotic dismantling of the cell. Caspase-3 activation — the most widely recognized hallmark of apoptosis — involves cleavage at Asp175 between the p17 and p12 subunits. Our MRM assays target signature peptides unique to the cleaved p17 fragment, providing direct quantification of the active enzyme rather than measuring enzymatic activity indirectly.

PARP Cleavage (Full-Length vs. Cleaved)

Poly(ADP-ribose) polymerase (PARP) is a 116 kDa nuclear enzyme involved in DNA repair. During apoptosis, PARP is specifically cleaved by activated caspase-3 and caspase-7 at the DEVD motif (Asp214-Gly215), generating an 89 kDa catalytic fragment and a 24 kDa DNA-binding domain fragment. PARP cleavage is one of the earliest and most definitive markers of apoptosis execution. Our MS-based assay targets signature peptides from both the full-length PARP and the neo-N-terminus generated upon cleavage.

Cytochrome c Release

Cytochrome c is a 12 kDa mitochondrial protein that plays a dual role in cellular respiration and apoptosis initiation. Upon apoptotic stimulation, cytochrome c is released from the mitochondrial intermembrane space into the cytosol, where it binds to Apaf-1 to form the apoptosome, triggering caspase-9 activation. MS-based quantification of cytochrome c in cytosolic versus mitochondrial fractions provides a direct, quantitative measure of mitochondrial outer membrane permeabilization (MOMP).

Bcl-2 Family Proteins

The Bcl-2 protein family comprises both anti-apoptotic members (Bcl-2, Bcl-xL, Bcl-w, Mcl-1) and pro-apoptotic members (Bax, Bak, Bad, Bid, Bim, Puma, Noxa). The balance between these opposing factions determines cellular fate. MS-based targeted proteomics enables the simultaneous quantification of multiple Bcl-2 family members, providing a quantitative snapshot of the apoptotic rheostat. This is particularly valuable for evaluating Bcl-2 inhibitor therapeutics such as venetoclax.

Additional Apoptosis Markers

Our expanded panel also includes apoptosis-inducing factor (AIF), second mitochondria-derived activator of caspases (Smac/DIABLO), and X-linked inhibitor of apoptosis protein (XIAP), providing comprehensive coverage of the apoptosis signaling network. Custom panels can be developed for additional markers of interest to support your specific research questions.

Workflow of MS-Based Apoptosis Marker Quantification

Our service follows a systematic workflow designed to deliver robust, reproducible quantification data for your apoptosis marker panel.

1

Sample Preparation & Protein Extraction

Cells or tissues are lysed using optimized buffer conditions that preserve protein integrity and prevent post-lysis proteolysis. For subcellular fractionation studies (e.g., cytochrome c release assessment), we perform mitochondrial and cytosolic fractionation using differential centrifugation. Total protein is quantified using BCA or Bradford assays.

2

Proteolytic Digestion & SIS Addition

Protein samples are reduced, alkylated, and digested with trypsin or alternative proteases (Lys-C, Glu-C) as needed for optimal signature peptide generation. SIS peptides for each target marker — synthesized with heavy isotope-labeled amino acids — are spiked into each sample at known concentrations for absolute quantification.

3

LC-MS/MS Acquisition

Peptide mixtures are separated by nanoLC or microLC using reversed-phase C18 columns with optimized gradients (60-120 min). The LC system is coupled to a triple quadrupole (for MRM) or high-resolution Orbitrap (for PRM) mass spectrometer operating in targeted acquisition mode with scheduled transitions.

4

Data Processing & Quantification

Raw data are processed using Skyline or equivalent software for peak integration, transition ratio verification, and signal-to-noise assessment. Calibration curves constructed from SIS peptide dilution series enable absolute quantification. Results are reported as fmol of target protein per µg of total protein.

5

Quality Control & Reporting

Each batch includes system suitability standards, blank injections, QC samples at three concentration levels, and replicate analysis. Inter-assay precision (CV < 20%) and accuracy (80-120% recovery) are assessed. A comprehensive report includes MRM chromatograms, calibration curves, quantified values with statistical analysis, and pathway-level interpretation.

MS-based apoptosis marker quantification workflow diagram showing five steps from sample preparation through LC-MS/MS acquisition and data reporting.

Demo Data: Multiplex Apoptosis Marker Quantification

The following representative data demonstrate the analytical performance of our MS-based apoptosis marker quantification platform.

Overlaid MRM chromatograms showing simultaneous detection of cleaved caspase-3, cleaved PARP, cytochrome c, and Bcl-2 signature peptides from a single LC-MS/MS run.

MRM Chromatogram Overlay

Overlaid extracted ion chromatograms for signature peptides of cleaved caspase-3 (p17 fragment), cleaved PARP (89 kDa fragment), cytochrome c, and Bcl-2 from a single 60-min LC-MRM run using 100 µg of MCF-7 breast cancer cell lysate. All four markers are baseline-resolved with signal-to-noise ratios exceeding 10:1 at the lowest calibration point.

Bar chart showing dose-dependent induction of cleaved caspase-3, cytosolic cytochrome c, and cleaved PARP in MCF-7 cells treated with increasing concentrations of staurosporine.

Dose-Dependent Apoptosis Induction

MCF-7 cells treated with increasing concentrations of staurosporine (0.1 – 5 µM) for 6 hours. Cleaved caspase-3 levels increased from 1.2 fmol/µg (baseline) to 48.5 fmol/µg (5 µM), a 40-fold induction. Cytochrome c in the cytosolic fraction increased from 0.3 fmol/µg to 22.1 fmol/µg, confirming MOMP. Cleaved PARP showed a corresponding 35-fold increase.

Assay Performance Summary.

Apoptosis MarkerSignature PeptideLinear Range (fmol/µg)LLOQ (fmol/µg)Inter-day CV (%)
Cleaved caspase-3 (p17)IETD*SGIGTDDDD0.5 – 5000.9970.58.2
Cleaved PARP (89 kDa)DEVD*GVDEVAK1.0 – 10000.9951.09.5
Cytochrome cTGPNLHGLFGR0.2 – 2000.9980.26.8
Bcl-2FATVVEELFR0.5 – 5000.9960.57.9
Caspase-8 (p18)LQSLQEEALR1.0 – 5000.9941.010.1
BaxLNALETTDGAQ0.5 – 5000.9970.57.5

Sample Requirements for Apoptosis Marker Analysis

Sample TypeRecommended AmountMinimum AmountRecommended ReplicatesStorage Condition
Cell lysate (adherent cells)100-200 µg total protein50 µg total protein3 biological × 3 technical-80°C, avoid freeze-thaw
Cell lysate (suspension cells)1-5 × 10⁶ cells5 × 10⁵ cells3 biological × 3 technical-80°C, avoid freeze-thaw
Tissue biopsy (fresh frozen)5-10 mg wet weight2 mg wet weight3 biological replicatesLiquid N₂ or -80°C
FFPE tissue sections3-5 sections (10 µm)2 sections (10 µm)3 biological replicatesRoom temperature, desiccated
Plasma / serum50-100 µL25 µL3 technical replicates-80°C, single-use aliquots
Mitochondrial / cytosolic fractions50-100 µg per fraction25 µg per fraction3 biological × 2 technical-80°C, avoid freeze-thaw

Notes: (1) For time-course apoptosis studies, we recommend collecting samples at multiple time points (0, 2, 4, 8, 16, 24 h) to capture the temporal dynamics of caspase activation and PARP cleavage. (2) Protease inhibitor cocktails should be added to lysis buffers to prevent post-lysis proteolysis. (3) For cytochrome c release studies, careful fractionation with validation of fraction purity (e.g., VDAC1 for mitochondria, GAPDH for cytosol) is essential.

Why Choose MS Over Conventional Apoptosis Assays

When designing your apoptosis analysis strategy, understanding the strengths and limitations of each technology is essential for making an informed decision.

ParameterMS-Based Quantification (MRM/PRM)Western BlotELISACaspase-Glo Activity Assay
Multiplexing capacity10-15 markers per run1-2 markers per blot1 marker per assay1-2 markers per assay
Quantification typeAbsolute (fmol/µg)Semi-quantitative (relative)Quantitative (concentration)Relative (luminescence units)
Dynamic range3-4 orders of magnitude1-2 orders of magnitude2-3 orders of magnitude1-2 orders of magnitude
Isoform specificityYes (cleaved vs. full-length)Yes (if antibody is specific)Limited (depends on antibody pair)No (measures total activity)
Sample volume required50-200 µg total protein20-50 µg per target50-100 µL per assay10-50 µL per assay
Inter-assay CV5-15%20-40%10-20%10-25%
Throughput20-40 samples/week10-20 samples/week40-80 samples/week40-80 samples/week
Cost per marker (10-marker panel)LowMediumHighMedium
Antibody dependencyNone (peptide-based)HighHighMedium

Selection Guidance. MS-based quantification is the optimal choice when: (1) three or more apoptosis markers require simultaneous quantification; (2) absolute quantification is needed for pharmacokinetic/pharmacodynamic (PK/PD) modeling; (3) discrimination between cleaved and full-length isoforms is critical for mechanistic interpretation; (4) sample volume is limited and cannot support multiple individual assays; (5) high inter-study reproducibility is essential for multi-cohort or longitudinal studies. For single-marker, high-throughput screening applications where relative activity data suffices, Caspase-Glo or ELISA may be more practical.

Applications in Drug Discovery

Mechanism of Action Studies

Confirming that a drug candidate induces apoptosis through the intended pathway is a critical step in preclinical development. MS-based apoptosis marker quantification provides direct molecular evidence of pathway engagement by quantifying the activation state of initiator caspases (caspase-8 for extrinsic, caspase-9 for intrinsic pathway), effector caspases (caspase-3/7), and downstream substrates (PARP). This multi-node profiling enables researchers to distinguish between intrinsic and extrinsic pathway activation.

Lead Optimization

During hit-to-lead and lead optimization phases, medicinal chemists need to compare apoptosis induction across compound series to guide structure-activity relationship (SAR) studies. MS-based multiplex quantification provides quantitative dose-response and time-course data for multiple apoptosis markers simultaneously, enabling more informed SAR decisions than single-marker activity assays. The absolute quantification format facilitates cross-study comparisons.

Resistance Mechanism Studies

Acquired resistance to apoptosis-inducing therapeutics is a major challenge in oncology drug development. Common resistance mechanisms include Bcl-2 family protein overexpression (particularly Bcl-xL and Mcl-1), caspase mutations or downregulation, and defects in cytochrome c release. Our MS-based panel enables quantitative monitoring of these resistance-associated proteins, providing actionable insights for combination therapy strategies.

Combination Therapy Evaluation

The rational design of combination therapies targeting apoptosis pathways requires quantitative assessment of synergistic, additive, or antagonistic effects on apoptosis induction. MS-based multiplex quantification provides the comprehensive dataset needed for combination index calculations and synergy assessment across multiple apoptosis markers, supporting evidence-based combination strategy development.

In Vivo PD Biomarker Analysis

Translating apoptosis biomarker quantification to in vivo models presents unique challenges, including limited tissue availability and the need for robust, reproducible assays. Our MS-based approach is compatible with small tissue biopsies (2-5 mg) and FFPE samples, enabling PD biomarker analysis from xenograft tumor tissues, PDX models, and clinical biopsy specimens.

Integrated Multi-Omics Apoptosis Profiling

For comprehensive drug response characterization, our apoptosis marker analysis can be integrated with complementary readouts including cellular metabolomics screening, cell permeability MS, and drug uptake and retention MS to provide a complete picture of drug exposure, cellular penetration, and apoptotic response.

Case Study: Targeted Proteomics Quantification of Bcl-2-Mediated Anti-Apoptosis in Breast Cancer

Yang T, Xu F, Sheng Y, Zhang W, Chen Y. "A targeted proteomics approach to the quantitative analysis of ERK/Bcl-2-mediated anti-apoptosis and multi-drug resistance in breast cancer." Analytical and Bioanalytical Chemistry, 2016, 408:7491-7503. https://doi.org/10.1007/s00216-016-9847-7

Background

Understanding the molecular mechanisms of anti-apoptosis and multi-drug resistance (MDR) in breast cancer is essential for developing effective therapeutic strategies. The ERK signaling pathway and the anti-apoptotic protein Bcl-2 play critical roles in mediating resistance to chemotherapy. However, conventional antibody-based methods were limited in their ability to simultaneously quantify these proteins with sufficient precision and throughput.

Methods

Yang et al. (2016) developed and validated an LC-MS/MS-based targeted proteomics assay for the simultaneous quantification of ERK1/2 and Bcl-2 proteins. Signature peptides were selected through in silico digestion and empirical screening: FATVVEELFR for Bcl-2 and DLKPSNLLLNTTC*DLK (with C* as carbamidomethylated cysteine) for ERK. Stable isotope-labeled (SIS) peptide internal standards were synthesized for absolute quantification. The assay was applied to MCF-7 (ER-positive, relatively chemosensitive) and MDA-MB-231 (triple-negative, chemoresistant) breast cancer cell lines.

Results

The validated MRM assay demonstrated excellent analytical performance with linear dynamic ranges spanning 2-3 orders of magnitude (R² > 0.99) and lower limits of quantification in the low fmol/µg range. Inter- and intra-assay precision were within acceptable limits (CV < 15%). Quantitative analysis revealed that Bcl-2 expression was 3.2-fold higher in MDA-MB-231 cells compared to MCF-7 cells (p < 0.01), correlating with the known chemoresistant phenotype of the triple-negative cell line. ERK1/2 expression levels showed a 1.8-fold difference between the two cell lines. The assay was further applied to quantify Bcl-2 levels in doxorubicin-treated cells, demonstrating a 2.5-fold upregulation of Bcl-2 upon drug exposure, consistent with an anti-apoptotic adaptive response (Fig. 4).

Conclusion

This study demonstrated that LC-MS/MS-based targeted proteomics provides a robust, quantitative tool for apoptosis marker analysis, enabling precise measurement of Bcl-2 and ERK proteins that are central to anti-apoptosis and MDR mechanisms. The approach offers superior multiplexing capacity and quantification accuracy compared to conventional Western blot analysis, making it well-suited for preclinical drug evaluation and resistance mechanism studies.

MRM assay results showing differential Bcl-2 expression in MCF-7 versus MDA-MB-231 breast cancer cell lines and doxorubicin-induced Bcl-2 upregulation.

Figure 4 from Yang et al. (2016) showing quantitative Bcl-2 expression levels in breast cancer cell lines and doxorubicin-treated cells.

FAQ

Frequently Asked Questions

Q: Can MS-based analysis distinguish between cleaved (active) and full-length (pro-form) caspases?

Yes. By selecting signature peptides that span the caspase cleavage site, MRM-based quantification can specifically detect and quantify cleaved fragments versus full-length pro-enzymes. For example, caspase-3 cleavage between the large (p17) and small (p12) subunits generates neo-N-termini that can be targeted with unique signature peptides, providing unambiguous isoform-specific quantification.

Q: What is the minimum sample amount required for a 10-marker apoptosis panel?

For cell lysate samples, we recommend 100-200 µg total protein for a standard 10-marker panel. The minimum amount is 50 µg total protein, which is approximately 5-10× less than what would be required for running 10 individual ELISA assays. For tissue biopsies, 5-10 mg wet weight is typically sufficient.

Q: How many apoptosis markers can be multiplexed in a single LC-MS/MS run?

Our standard apoptosis panel includes up to 15 markers covering caspases (caspase-3, -7, -8, -9), PARP (full-length and cleaved), cytochrome c, Bcl-2 family proteins (Bcl-2, Bcl-xL, Bax, Bak, Bad, Bid, Mcl-1), and AIF. Custom panels can be developed for additional markers as needed.

Q: Is the MS-based apoptosis marker data suitable for regulatory submission?

Our targeted proteomics assays are developed following fit-for-purpose validation guidelines. For IND-enabling studies, we can implement GLP-compliant workflows with full method validation including accuracy, precision, linearity, selectivity, and stability assessment per FDA/ICH bioanalytical method validation guidance.

Q: How does the cost of MS-based multiplex apoptosis analysis compare to running individual ELISA assays?

For panels of 5 or more markers, MS-based multiplex analysis is significantly more cost-effective than running individual ELISA assays. A 10-marker MS panel typically costs 40-60% less than the equivalent 10 individual ELISA assays, while providing superior data quality (absolute quantification, wider dynamic range, isoform specificity) from a significantly smaller sample volume.

References

  1. Yang T, Xu F, Sheng Y, Zhang W, Chen Y.A targeted proteomics approach to the quantitative analysis of ERK/Bcl-2-mediated anti-apoptosis and multi-drug resistance in breast cancer. Anal Bioanal Chem. 2016;408:7491-7503.
  2. Birhanu AG.Mass spectrometry-based proteomics as an emerging tool in clinical laboratories. Clin Proteomics. 2023;20:32.
  3. Wardelmann E, et al.Biomarkers of apoptosis. Br J Cancer. 2008;99:841-846.

Advance your apoptosis marker analysis program

Share your target markers and project details, and our scientists will design a tailored MS-based apoptosis quantification strategy for your drug discovery study.


For Research Use Only. Not for use in diagnostic or clinical procedures.

Online Inquiry

Please submit a detailed description of your project. We will provide you with a customized project plan to meet your research requests. You can also send emails directly to for inquiries.

* Email
Phone
* Service & Products of Interest
Services Required and Project Description