High-Throughput IM-MS and CCS Profiling for Compound Screening

We deliver high-throughput ion mobility-mass spectrometry and collision cross-section profiling — adding an orthogonal dimension of structural information to your compound screening workflow for isomer resolution, metabolite identification, and CCS database building.

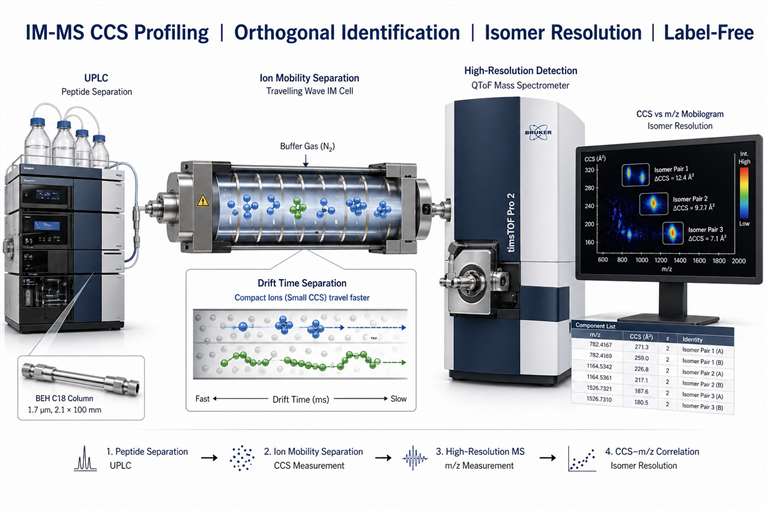
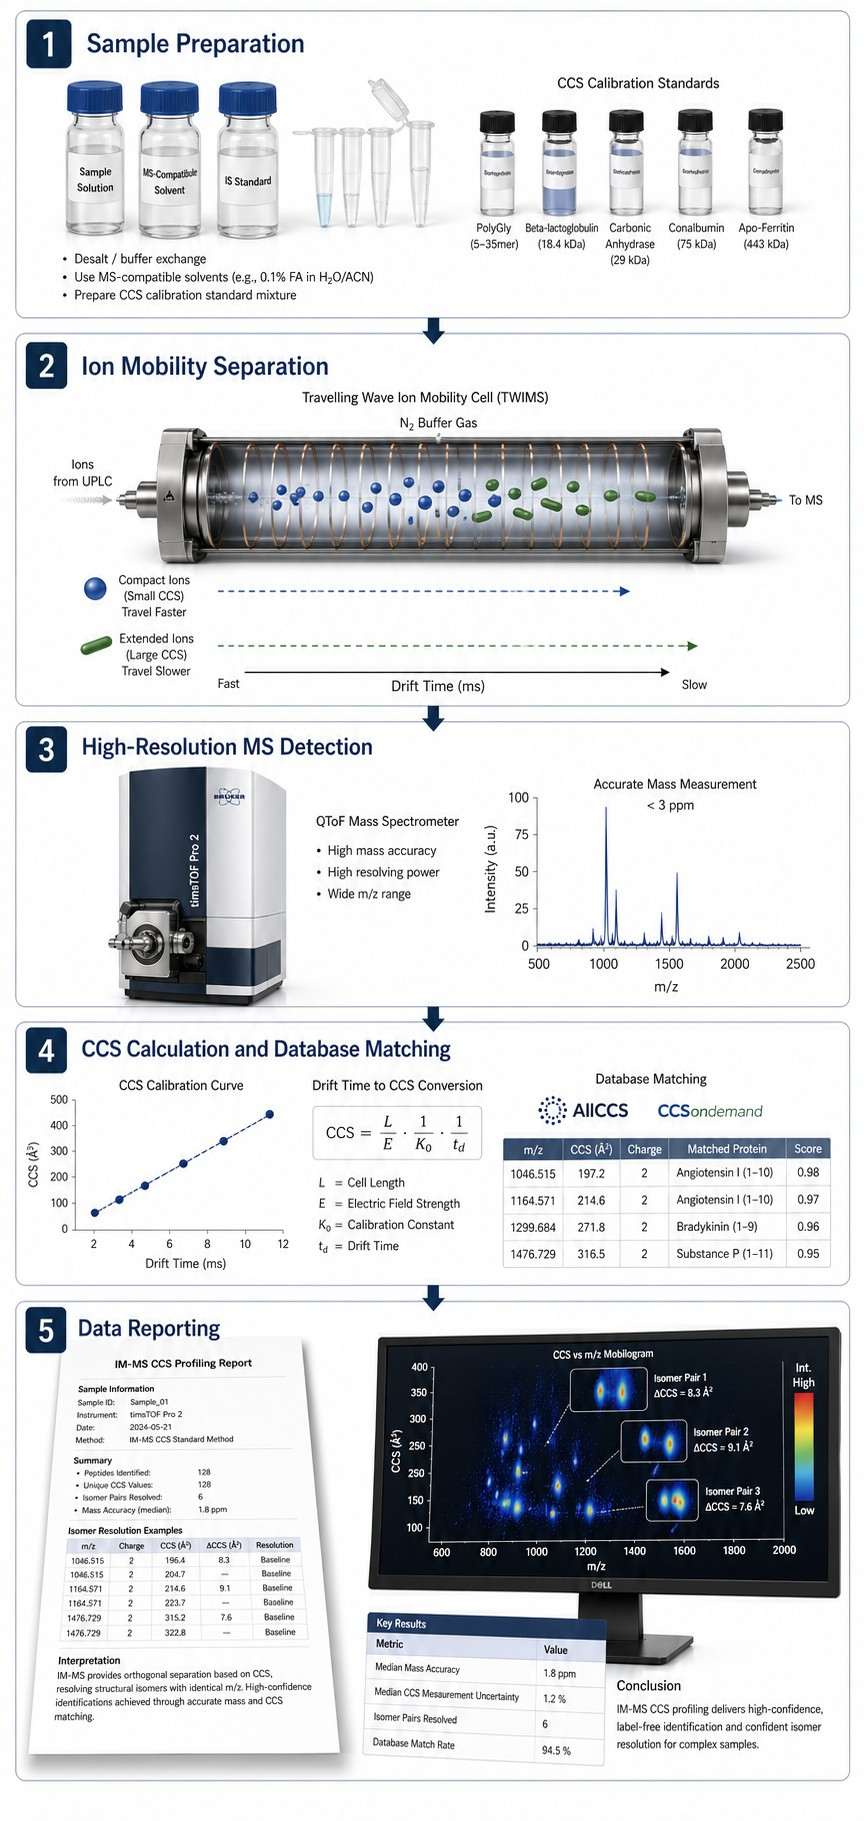
Ion mobility-mass spectrometry (IM-MS) adds a dimension that standard mass spectrometry cannot reach — ion shape and size. In an IM-MS experiment, ions are separated in the gas phase by how easily they move through a buffer gas. The resulting collision cross section (CCS) value tells you how large and what shape an ion is in the gas phase, giving you a physicochemical fingerprint that works alongside m/z and retention time for compound identification.

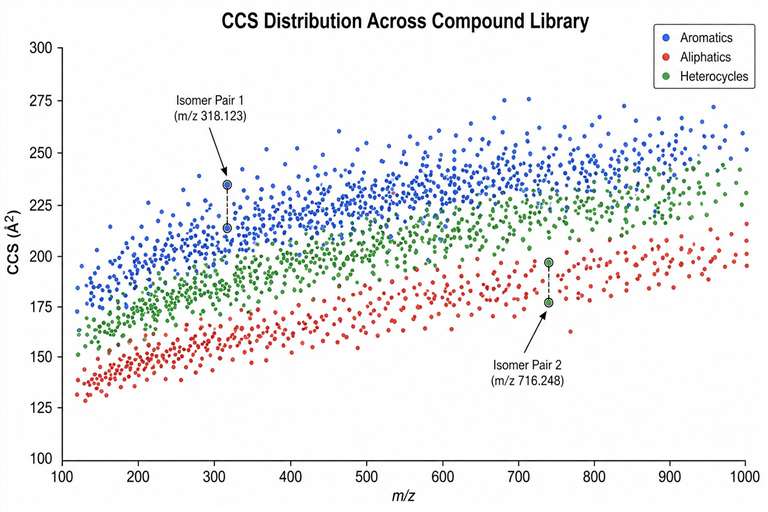
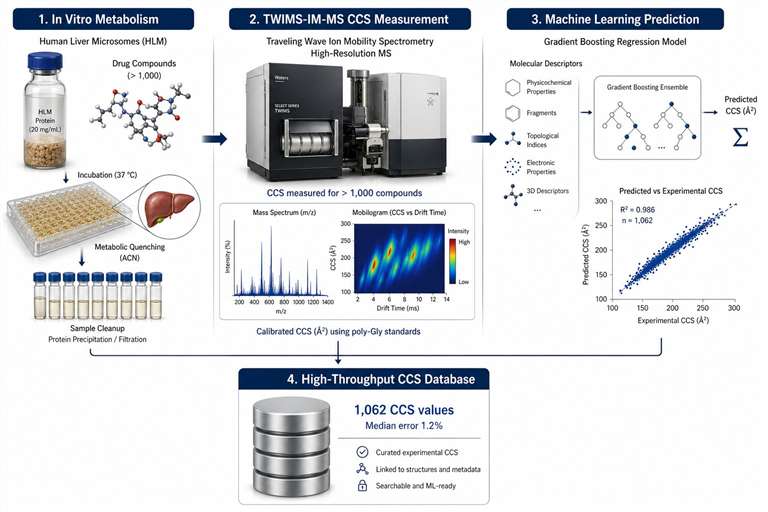
CCS profiling means measuring these values systematically and using them to screen compounds. Build a CCS library of known compounds, compare unknowns against it, and you can identify what you are looking at with far more confidence than mass alone provides — especially when dealing with isomers or compounds that look identical on a standard LC-MS run.

Key Advantages:

  • Orthogonal identification dimension — CCS values are independent of chromatography and matrix effects, providing a third dimension alongside m/z and retention time.
  • Isomer and isobar resolution — Structural isomers and isobaric compounds that co-elute or share identical mass spectra are routinely distinguished by CCS.
  • High-throughput capability — CCS data acquired in milliseconds per compound on your existing LC-MS run. No time penalty, no extra sample preparation.
  • Database-driven identification — Match against AllCCS, CCSondemand, or your own proprietary library. Machine learning prediction extends coverage to compounds without reference standards.
Ion mobility-mass spectrometry CCS profiling platform diagram featuring TWIMS separation, CCS calibration, high-resolution MS detection, and database matching.
What Is IM-MS CCS Key Advantages Service Overview Workflow Technology Comparison Sample Demo Case Study FAQ

What Is Ion Mobility-Mass Spectrometry and CCS Profiling?

Ion mobility-mass spectrometry (IM-MS) is a gas-phase separation technique that adds an orthogonal dimension — ion shape and size — to conventional mass spectrometry. In IM-MS, ions are separated by their collision cross section (CCS), a physical property that reflects an ion's gas-phase conformation, before entering the mass analyser. The resulting CCS value is a characteristic physicochemical descriptor that can be used alongside m/z and retention time for compound identification, isomer differentiation, and structural characterisation.

CCS profiling is the systematic measurement and application of CCS values for compound screening. By building a CCS database of known compounds and comparing measured CCS values against it, researchers can identify unknowns, distinguish isobaric and isomeric species, and prioritise hits with greater confidence than mass alone allows.

We built our high-throughput IM-MS and CCS profiling service to give discovery teams rapid, label-free access to this orthogonal data layer. Whether you need to resolve isomers, characterise metabolites, or build a CCS database for your own compound series, we handle the measurement, the calibration, and the interpretation.

Key Advantages of IM-MS CCS Profiling for Drug Discovery

An Extra Dimension for Identification

CCS values do not care about your chromatography. They are independent of column chemistry, mobile phase, and matrix effects. Two compounds with the same exact mass but different shapes — isomers, for example — that co-elute on your LC column will still separate in the ion mobility cell. That is the kind of resolving power that saves weeks of re-running samples.

Isomers That LC-MS Cannot Touch

Positional isomers of drug metabolites — a hydroxyl group here versus there — often produce identical MS/MS spectra and may co-elute. Their CCS values, however, are routinely different. We see this routinely with hydroxylated and glucuronidated metabolites where standard LC-MS/MS leaves ambiguity.

No Time Penalty

CCS data acquisition happens in milliseconds per compound, on the same LC-MS run you are already doing. There is no extra sample preparation, no derivatisation, no second injection. You get the CCS value as part of the standard data package.

Label-Free Structural Readout

No labelling, no tagging, no fragmentation needed. The CCS value itself reports on gas-phase conformation — molecular shape, flexibility, and solvent-accessible surface area — all from a single measurement.

Database-Driven Identification

Your measured CCS values can be matched against public databases like AllCCS (covering >100,000 compounds) or CCSondemand, or against your own proprietary library. And when a reference standard does not exist, machine learning models can predict CCS with median error around 1–2%.

Fits Naturally Into Your Workflow

IM-MS CCS profiling works alongside our other MS platforms. For label-free binding detection, we also offer affinity selection mass spectrometry (ASMS) and native ESI-MS for noncovalent complexes. The data layers complement each other.

Service Overview — Creative Proteomics IM-MS CCS Profiling Capabilities

We offer five service modes, each designed for a different stage of the discovery pipeline.

MODE 1

High-Throughput CCS Database Building

We measure CCS values for your compound library and deliver a searchable database.

  • TWIMS on Synapt G2-Si / G3 platforms.
  • Multi-adduct coverage ([M+H]+, [M+Na]+, [M-H]−).
  • Automated processing — up to 500 compounds per day.
MODE 2

Isomer Differentiation and Identification

When LC-MS cannot tell two compounds apart, CCS often can.

  • Positional isomers (hydroxylation, glucuronidation, sulfation).
  • Stereoisomers where CCS differences are sufficient.
  • Co-eluting isomers in complex mixtures.
MODE 3

Drug Metabolite CCS Profiling

Characterise metabolites by CCS for higher confidence in structural assignment.

  • In vitro metabolite generation coupled with IM-MS.
  • CCS matching against predicted values.
  • Structural isomer assignment.
MODE 4

Fragment and Natural Product CCS Screening

CCS-based screening for fragment libraries and natural product extracts.

  • Fragment hit characterisation.
  • Natural product dereplication by CCS database matching.
  • Mixture analysis with IM pre-separation.
MODE 5

Custom CCS Method Development

For compound classes or applications that need a tailored approach.

  • CCS calibration for specific adduct types.
  • Cross-platform CCS comparison (TWIMS, DTIMS, TIMS).
  • Machine learning model training on your data.

IM-MS CCS Profiling Workflow

Our standard workflow runs through five stages:

1

Sample Preparation and Method Setup

Samples go into MS-compatible solvent. We prepare CCS calibration standards alongside your samples for each adduct type you need.

2

Ion Mobility Separation

Ions travel through a buffer gas — typically nitrogen — and separate by how easily they move through it. Drift time is recorded and later converted to CCS.

3

High-Resolution Mass Detection

After ion mobility separation, ions enter the mass analyser for accurate mass measurement, typically within 3 ppm.

4

CCS Calculation and Database Matching

Drift times become CCS values via a calibration curve. We then match your measured CCS against public and proprietary databases.

5

Data Reporting and Interpretation

You receive measured CCS values, mass accuracy, database match results, and isomer resolution data — plus our interpretation of what it all means for your project.

Five-step IM-MS CCS profiling workflow diagram: sample preparation, ion mobility separation, MS detection, CCS calculation, data reporting.

Technology Comparison: IM-MS vs. Standard HRMS for Compound Screening

TechniqueSeparation DimensionsIsomer ResolutionIdentification ConfidenceThroughputStructural Information
IM-MS CCS Profiling (Creative Proteomics)RT + CCS + m/zYes (structural isomers)High (3 dimensions)High (ms per compound)CCS (shape/size)
Standard LC-HRMSRT + m/zLimited (co-eluting)Moderate (2 dimensions)HighNone (mass only)
LC-MS/MSRT + m/z + fragmentsPartial (MS/MS patterns)Moderate–HighModerateFragmentation pattern
NMRChemical shiftYesVery highLowFull structure
IMS alone (no MS)CCSYesLow (no mass)HighCCS only

Selection Strategy: We recommend IM-MS CCS profiling as a complementary technique when standard LC-HRMS cannot resolve isomeric species, when you need extra confidence for metabolite annotation, or when building a CCS database for long-term use. For routine quantitative screening, standard LC-HRMS or LC-MS/MS remains the primary tool. For label-free binding detection, our affinity selection mass spectrometry (ASMS) service provides an orthogonal approach.

Platform Instrumentation

Our IM-MS CCS profiling platform integrates Waters Synapt G2-Si / G3 TWIMS technology and Bruker timsTOF with advanced data analysis.

Module CategoryInstrument / SystemCore Capability
IM-MS PlatformWaters Synapt G2-Si / G3TWIMS with HDMS(E), CCS resolution < 2% RSD
IM-MS PlatformBruker timsTOFTrapped ion mobility, CCS resolution < 1% RSD
ChromatographyACQUITY UPLC I-ClassHigh-resolution LC-IM-MS coupling
InformaticsDriftScope + UNIFI + custom pipelineCCS calculation, database matching, ML prediction

Sample Requirements

Sample TypeRequired AmountConcentrationSolventNotes
Pure compound50–500 µg0.1–1 mg/mLMeOH/ACN/H2OProvide structure if available
Compound mixture1–5 mg per poolDMSO ≤1%Pool size up to 10 compounds
Drug metabolite sampleAs availableMS-compatibleIn vitro or in vivo derived
Fragment library1–5 mg10–100 mM in DMSODMSO ≤1%MW < 300 Da
Natural product extract0.5–2 mgMeOH/ACNProvide source information

Note: Sample requirements may vary depending on compound characteristics and the specific IM-MS platform used. We recommend a preliminary consultation to determine optimal conditions for your specific project.

Deliverables

  • Measured CCS values (Ų) for each compound and adduct type
  • CCS calibration curve and quality metrics
  • Drift time vs. m/z mobilogram plots
  • Database match results with CCS error (ΔCCS)
  • Isomer resolution data where applicable
  • Summary report with interpretation and recommendations

Representative Demo Data

Example: CCS Distribution Plot for a Compound Library

A representative CCS vs. m/z scatter plot showing how CCS values distribute across a compound library. Compounds cluster by structural class, and isomers that share the same m/z sit at clearly different CCS values.

CCS vs m/z scatter plot for compound library: X-axis m/z, Y-axis CCS (Ų), compounds coloured by structural class, isomer pairs highlighted.

Example CCS distribution plot for compound library screening

Case Study: Building a High-Throughput CCS Database for Drugs and Drug Metabolites

High-Throughput Measurement and Machine Learning-Based Prediction of Collision Cross Sections for Drugs and Drug Metabolites

Background

CCS values are useful for compound identification, but the field lacked large, high-quality CCS databases for drug-like molecules. Without a reference library, the routine use of CCS in drug discovery screening was limited. The team set out to build one — and to see whether machine learning could predict CCS accurately enough to cover compounds that had never been measured.

Methods

Colby and colleagues generated drug metabolites using human liver microsomes, then ran the samples on a travelling wave ion mobility (TWIMS) platform. They measured CCS values for over 1,000 compounds across multiple adduct types. The experimental data were then used to train a gradient boosting regression model for CCS prediction based on molecular descriptors.

Results

The final database covered 1,062 unique compounds with high reproducibility — coefficient of variation below 1% for replicate measurements. The machine learning model predicted CCS with a median absolute error of 1.2%, meaning that for most compounds the predicted CCS fell within 1–2% of the experimental value. Molecular weight, polarisability, and solvent-accessible surface area were the strongest predictors.

Conclusions

This work shows that high-throughput CCS measurement combined with machine learning prediction is practical and accurate enough for routine use in drug discovery. The approach is directly applicable to metabolite identification, impurity profiling, and hit characterisation — especially when reference standards are not available.

CCS database building workflow: drug metabolite generation, TWIMS measurement, CCS calculation, machine learning prediction, database matching.

Schematic of the high-throughput CCS database building and ML prediction workflow.

FAQ

Frequently Asked Questions

Q: What is a collision cross section (CCS) value?

CCS is a measure of an ion's effective size in the gas phase, reported in Ų. It reflects the ion's shape and is derived from how fast it moves through a buffer gas in an ion mobility cell.

Q: How reproducible are CCS measurements?

With proper calibration, CCS measurements are highly reproducible — typically < 2% RSD across instruments and laboratories.

Q: Can CCS distinguish between isomers that LC-MS cannot?

Yes. Structural isomers, positional isomers, and some stereoisomers that co-elute or produce identical mass spectra are routinely resolved by their CCS values.

Q: How much compound is needed?

Typically 50–500 µg of pure compound. For mixtures, 1–5 mg per pool of up to 10 compounds.

Q: Can CCS values be predicted?

Yes. Machine learning models predict CCS with median error around 1–2% for drug-like molecules, which is sufficient for confident identification when reference standards are unavailable.

Q: How does IM-MS compare with LC-MS/MS?

IM-MS adds an orthogonal dimension (CCS) to the standard RT + m/z + MS/MS workflow. It provides higher identification confidence, especially for isomers and isobars that fragmentation alone cannot distinguish.

References

  1. Colby, S.M. et al. High-Throughput Measurement and Machine Learning-Based Prediction of Collision Cross Sections for Drugs and Drug Metabolites. J Am Soc Mass Spectrom 33, 1061–1072 (2022).
  2. Jiménez-Lamana, J., Marigliano, L., Allouche, J., Grassl, B., Szpunar, J., Reynaud, S. A Novel Strategy for the Detection and Quantification of Nanoplastics by Single Particle Inductively Coupled Plasma Mass Spectrometry (ICP-MS). Anal Chem 92, 11474–11482 (2020).
  3. Zhou, Z., Luo, M., Chen, X., Yin, Y., Xiong, X., Wang, R., Zhu, Z.J. Ion mobility collision cross-section atlas for known and unknown metabolite annotation in untargeted metabolomics. Nat Commun 11, 4334 (2020).

Plan an IM-MS CCS profiling campaign with the MassTarget™ team

Share your compound library details and screening objectives and our scientists will design a tailored CCS profiling strategy for your discovery program.

Online Inquiry

Please submit a detailed description of your project. We will provide you with a customized project plan to meet your research requests. You can also send emails directly to for inquiries.

* Email
Phone
* Service & Products of Interest
Services Required and Project Description