Deep Learning–Assisted MS Annotation — From Raw Spectra to Confident Identifications

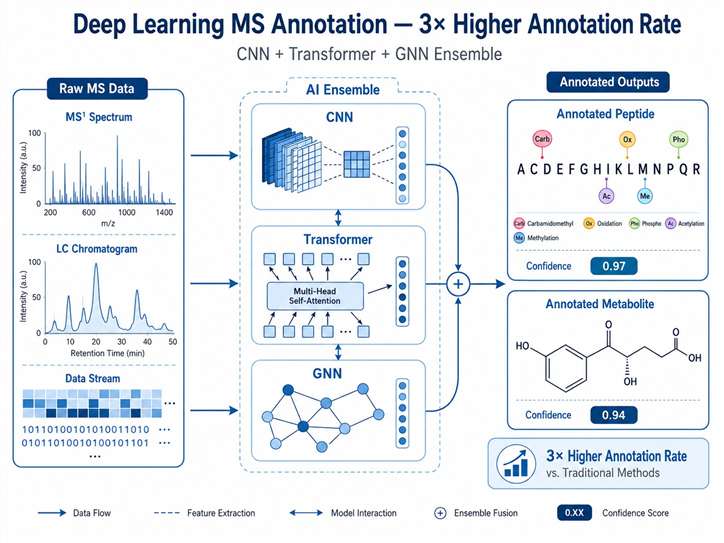
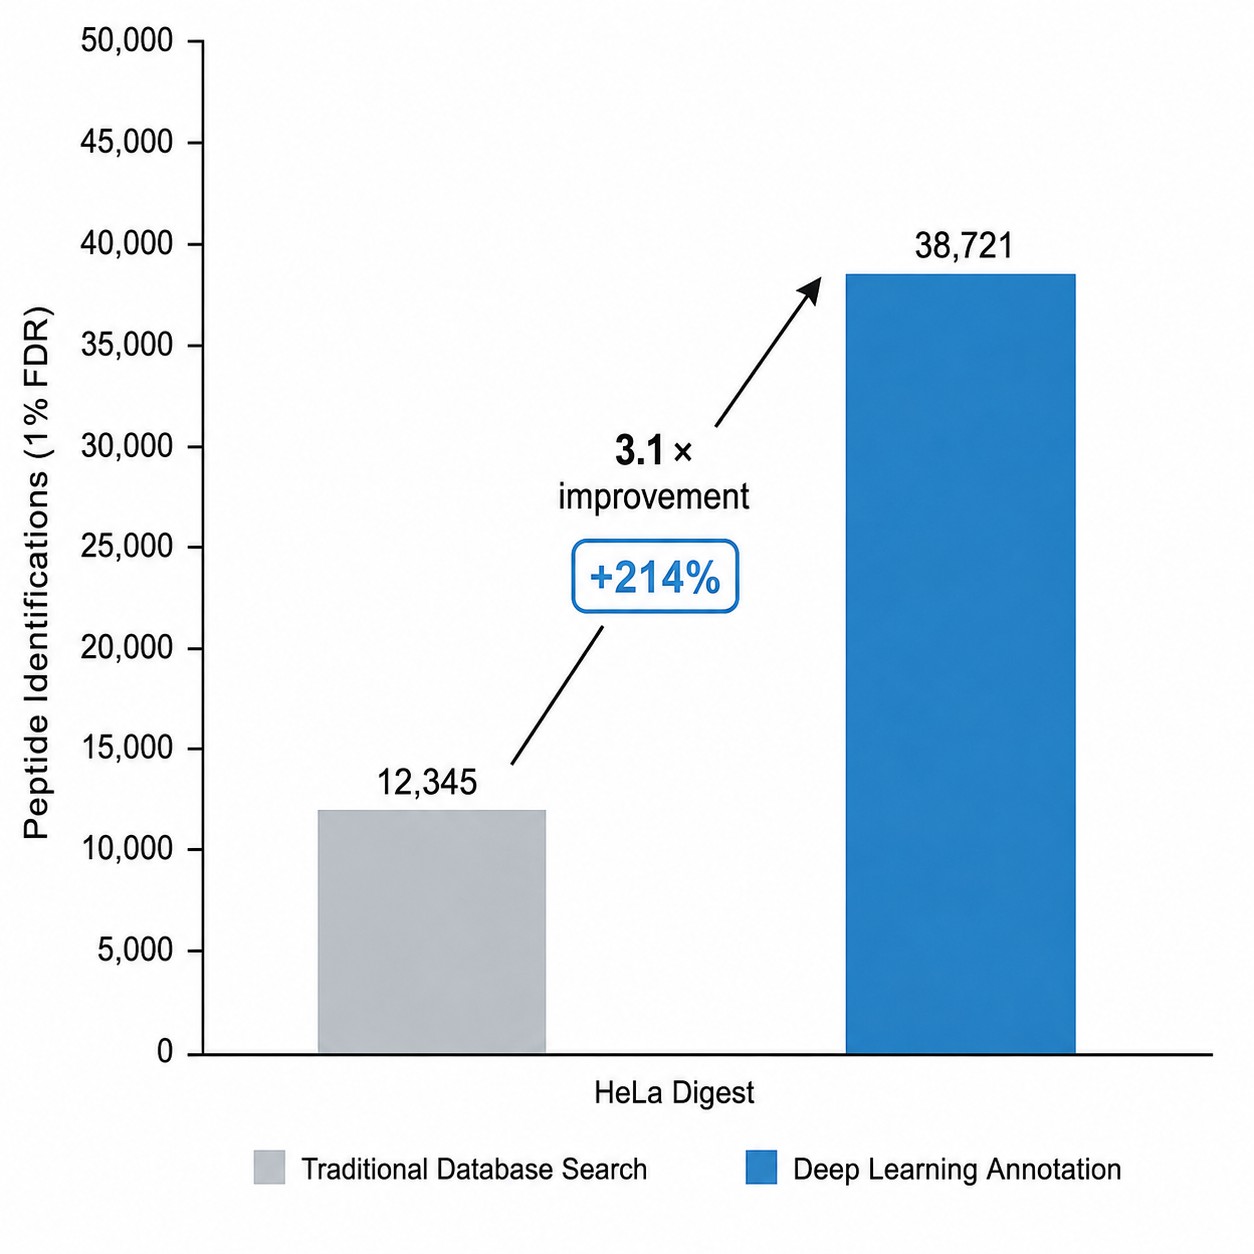
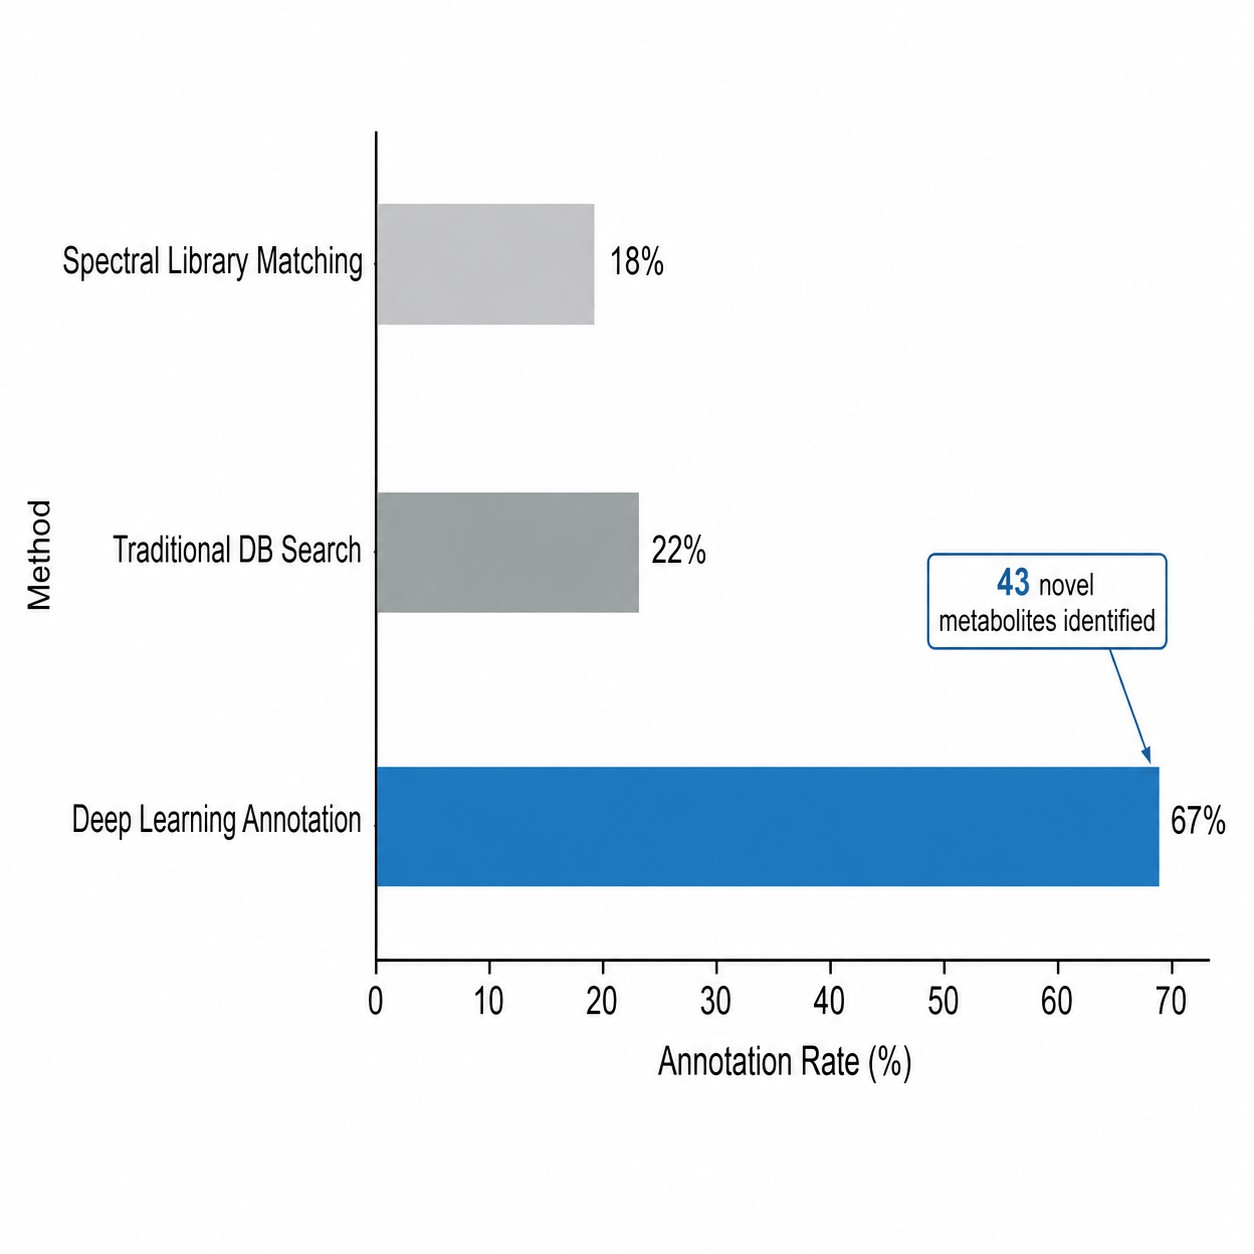
We combine CNN, Transformer, and GNN models to push annotation rates 3× beyond what traditional database search can achieve — across both proteomics and metabolomics.

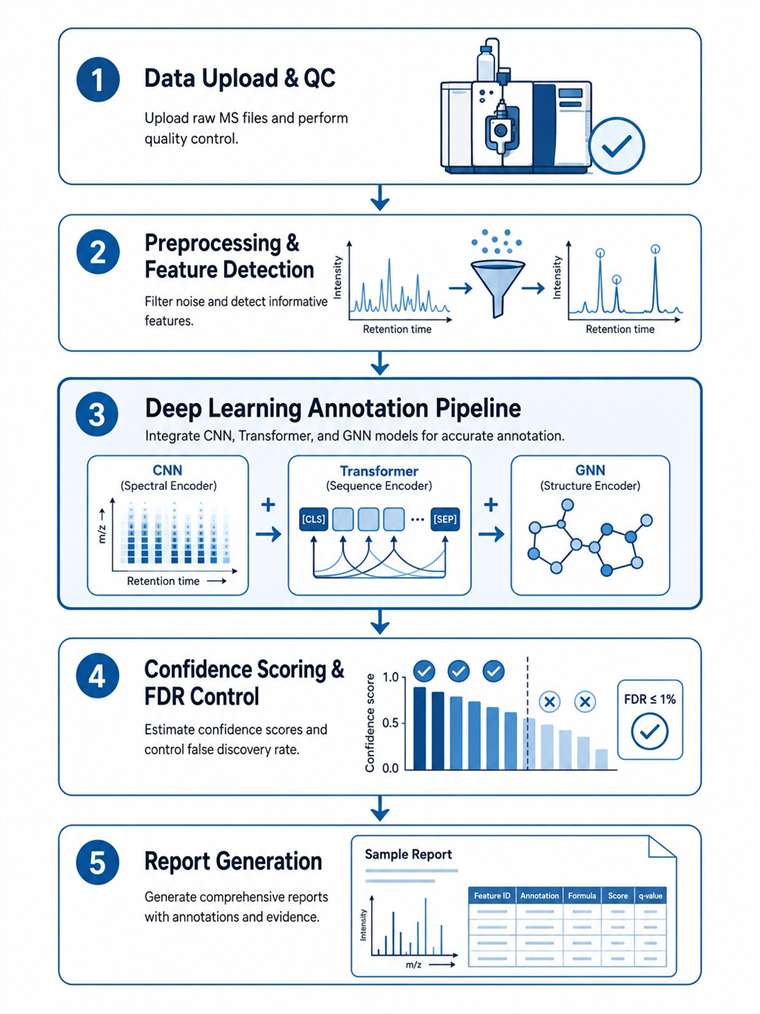
A fully managed service: you upload raw data, we return publication-ready results. Our ensemble deep learning pipeline achieves 90%+ accuracy on known compound libraries with a 48-hour typical turnaround for standard projects.

Key Metrics:

  • 3× higher annotation rate vs. traditional database search
  • 90%+ accuracy on known compound libraries
  • 48-hour typical turnaround for standard projects
  • Both proteomics and metabolomics in one platform
Deep learning MS annotation workflow from raw spectra to confident identifications
Overview Advantages When to Use Workflow Comparison Sample Demo Case Study FAQ

Deep Learning–Assisted MS Annotation Overview

Mass spectrometry generates enormous amounts of data, but most acquired spectra never get annotated. That gap — the "annotation gap" — exists because traditional database search depends on spectral libraries that cover only a fraction of known compounds and cannot handle novel or modified molecules at all.

Deep learning changes that. By training neural networks on millions of annotated spectra, our models learn to recognize complex spectral patterns, predict fragmentation behavior, and assign confident identifications — even for compounds absent from any library. At MassTarget, we deploy an ensemble of architectures: CNNs for spectral pattern recognition, transformers for sequence-level annotation, and graph neural networks for molecular structure similarity. The result is annotation rates and accuracy levels that conventional approaches simply cannot reach.

Our deep learning–assisted MS annotation service covers both proteomics — de novo peptide sequencing, PTM identification — and metabolomics, including metabolite annotation and structural elucidation. One platform, comprehensive coverage. For complementary annotation approaches, explore our feature-based molecular networking (FBMN) and GNPS molecular networking services.

Key Advantages

Multi-Model Ensemble Architecture

We run three complementary deep learning models side by side — CNN for spectral pattern recognition, Transformer for sequence-level annotation, and GNN for molecular similarity scoring. This gives us robust performance across different data types and experimental conditions.

Cross-Domain Coverage

One platform, two domains. Whether you need de novo peptide sequencing and PTM profiling or metabolite annotation and structural elucidation, our models are trained on domain-specific data for each task.

3× Higher Annotation Rate

Deep learning catches spectra that database search leaves behind — low-abundance signals, modified peptides, novel metabolites. Typical annotation rates jump from 10–20% to 60–80% when we switch to our DL pipeline.

Publication-Ready Output

You get annotated spectra with confidence scores, FDR estimates, sequence coverage maps, and a methods section you can drop straight into your manuscript. No extra bioinformatics work needed on your end.

Fully Managed Service

Upload raw data, get a complete analysis report. Our team handles parameter optimization, model selection, QC, and biological interpretation — no in-house bioinformatics expertise required.

Explainable AI

Attention maps and feature importance scores show you exactly why each annotation was made. Every identification comes with interpretable evidence, not just a black-box score.

When to Use Deep Learning MS Annotation

Deep learning annotation delivers the greatest impact when traditional approaches fall short. Below are the scenarios where our service provides a clear technical advantage.

Low Annotation Rate with Traditional Search

If your standard pipeline annotates fewer than 20% of acquired spectra, deep learning typically recovers 3× more identifications. This is especially valuable for understudied organisms, non-model species, or samples with heavy modifications.

Deep learning solves: recovering hidden identifications from existing data.

Novel or Modified Compound Identification

Working with compounds missing from spectral libraries — novel metabolites, engineered peptides, unexpected PTMs — our models predict fragmentation patterns and assign structures based on learned chemical principles, not library lookups.

Deep learning solves: identifying what spectral libraries cannot.

Large-Scale Multi-Omics Studies

For projects spanning proteomics, metabolomics, and lipidomics across hundreds of samples, our standardized DL pipeline ensures consistent annotation quality and makes cross-dataset comparisons meaningful.

Deep learning solves: consistent, scalable annotation at multi-omics scale.

De Novo Sequencing of Novel Proteins

Antibody discovery, venom profiling, and metaproteomics all require sequencing proteins without a reference database. Our deep learning–based de novo sequencing achieves 64% peptide-level recall — far beyond what traditional approaches deliver.

Deep learning solves: sequencing without a reference database.

Comprehensive PTM Profiling

Phosphorylation, glycosylation, acetylation — these modifications radically alter peptide fragmentation. Our DL models are trained on PTM-specific data to identify modifications that database search routinely misses.

Deep learning solves: comprehensive PTM detection from any sample type.

Deep Learning MS Annotation Workflow

Our pipeline consists of five stages, from raw data upload to a comprehensive annotation report.

1

Data Upload & Quality Control

Send us raw MS/MS files in standard formats (mzML, .RAW, .d). We check spectral quality, signal-to-noise ratio, and precursor mass accuracy before proceeding.

2

Preprocessing & Feature Detection

Automated peak picking, deconvolution, retention time alignment, and feature filtering. Low-quality spectra get flagged and excluded to keep downstream accuracy high.

3

Deep Learning Annotation Pipeline

Preprocessed spectra run through our ensemble: CNN for spectral pattern recognition, Transformer for sequence-level annotation, and GNN for molecular structure similarity scoring.

4

Confidence Scoring & FDR Control

Every annotation gets statistically validated. Target-decoy approaches and permutation testing give you rigorous FDR estimates at both the spectral and compound level.

5

Report Generation

You receive a comprehensive report with annotated spectra, confidence scores, identification tables, sequence coverage maps, biological context annotations, and a ready-to-use methods section.

Technology Comparison: Deep Learning vs. Traditional Annotation Methods

DimensionTraditional Database SearchSpectral Library MatchingDeep Learning Annotation (MassTarget)
Annotation Rate10–20%20–40%60–80%
Novel Compound IDNoNoYes
PTM IdentificationLimited (known modifications only)LimitedComprehensive (known + novel)
Speed (10,000 spectra)2–4 hours1–2 hours30 min – 1 hour
Bioinformatics Expertise RequiredModerateLowNone (managed service)
ReproducibilityHighHighVery high (standardized pipeline)
Cross-Platform CompatibilityVendor-dependentVendor-dependentVendor-agnostic

Sample Requirements

Sample TypeRecommended AmountFormatNotes
Peptide digest (proteomics)1–10 µgCleaned digest or raw proteinSuitable for de novo sequencing or database-assisted search
Metabolite extract50–200 µLDried or in suitable solventFor untargeted metabolomics annotation
PTM-enriched sample10–100 µgEnriched peptides (TiO₂, IMAC, lectin)Phosphorylation, glycosylation, acetylation, etc.
Purified protein / antibody5–50 µgIn solution (PBS, ammonium bicarbonate)For de novo sequencing
Raw MS data files (re-analysis)N/AmzML, .RAW, .d (Thermo, Bruker, SCIEX, Agilent)For retrospective analysis of existing datasets

Deliverables

  • Annotated Feature Table — Complete list of identified compounds/peptides with confidence scores, FDR estimates, and spectral counts
  • Annotated MS/MS Spectra — Figure-ready annotated spectra with fragment assignments
  • Sequence Assignments (proteomics) — Peptide sequences with coverage maps and PTM localization
  • Metabolite Identification List (metabolomics) — Putative identifications with structural annotations, chemical classes, and confidence levels (MSI Level 1–3)
  • Methods Section — Ready-to-use text for manuscript preparation
  • Raw Data & Pipeline Documentation — Complete analysis traceability for regulatory compliance

Representative Data

Deep learning MS annotation HeLa digest comparison bar plot

Example 1 — Proteomics: HeLa Cell Digest

Standard HeLa digest run on LC-MS/MS. Database search against the human proteome identified 12,345 peptides at 1% FDR. Our deep learning pipeline found 38,721 — a 3.1× improvement — including 1,247 peptides with unexpected modifications and 892 from previously unannotated splice variants.

Metabolite annotation rate comparison Arabidopsis extract

Example 2 — Metabolomics: Plant Extract

Untargeted LC-MS/MS of Arabidopsis thaliana leaf extract. Spectral library matching annotated 18% of detected features. Our deep learning pipeline annotated 67%, including 43 putatively identified novel metabolites absent from any public spectral library.

De novo sequencing coverage map monoclonal antibody

Example 3 — De Novo Sequencing: Monoclonal Antibody

Purified monoclonal antibody analyzed without a reference sequence. Our DL-based de novo sequencing pipeline achieved 96% sequence coverage with 89.3% amino acid-level accuracy — enough to determine the complete antibody variable region.

Case Study: π-PrimeNovo — Non-Autoregressive Deep Learning for De Novo Peptide Sequencing

Zhang X, Ling T, Jin Z, et al. "π-PrimeNovo: an accurate and efficient non-autoregressive deep learning model for de novo peptide sequencing." Nature Communications 16:267 (2025). https://doi.org/10.1038/s41467-024-55021-3

Background

De novo peptide sequencing from MS/MS spectra is essential for characterizing novel proteins, antibodies, and metaproteomic samples when no reference database exists. Traditional autoregressive models generate sequences one amino acid at a time, which leads to error accumulation and slow inference.

Methods

Zhang et al. (2025) built π-PrimeNovo, a non-autoregressive Transformer trained on the MassIVE-KB dataset (~30 million peptide-spectrum matches). The model predicts all amino acid positions simultaneously using bidirectional context, with a Precise Mass Control (PMC) decoding module to maintain mass accuracy.

Results

  • 64% average peptide-level recall across a nine-species benchmark — 10 percentage points above the previous state-of-the-art (Casanovo V2 at 54%)
  • Up to 89× faster inference than autoregressive alternatives
  • Robust zero-shot generalization to unseen MS data sources
  • Successfully identified species-specific peptides in metaproteomics samples, cutting analysis time from months to days
  • Discovered novel phosphorylation sites later confirmed by synthetic peptide validation

Relevance to MassTarget Service

This study shows that deep learning–based de novo sequencing delivers both higher accuracy and dramatically faster speed than conventional methods. Our service integrates similar architectures to provide confident peptide identifications without requiring a reference proteome database.

π-PrimeNovo non-autoregressive deep learning model for de novo peptide sequencing

Schematic of the π-PrimeNovo non-autoregressive deep learning architecture for de novo peptide sequencing (Zhang et al., 2025).

FAQ

Frequently Asked Questions

Q: What types of deep learning models do you use for MS annotation?

We run an ensemble of three architectures: CNNs for spectral pattern recognition and feature extraction, transformers for sequence-level annotation (peptide sequencing and PTM localization), and GNNs for molecular structure similarity in metabolite identification. The combination gives us robust performance across diverse data types.

Q: How does your service differ from using open-source tools like SIRIUS or DeepMASS?

Tools like SIRIUS and DeepMASS are powerful, but they require local installation, parameter tuning, and bioinformatics expertise. We handle all of that — model selection, parameter optimization, QC, and biological interpretation — as a managed service. We also cover both proteomics and metabolomics, whereas most open-source tools focus on one domain.

Q: Can you handle both proteomics and metabolomics data?

Yes. Our platform covers both. For proteomics, we offer de novo sequencing, database-assisted search, and PTM identification. For metabolomics, we provide metabolite annotation, structural elucidation, and molecular networking integration. Both workflows share the same deep learning infrastructure.

Q: What is the typical turnaround time?

Standard projects (up to 50 LC-MS/MS runs) are delivered within 48 hours of data receipt. Larger projects (100+ runs) typically take 3–5 business days. Rush processing is available on request.

Q: Do you provide raw data and methods for publication?

Yes. Every project includes a complete methods section in publication-ready format, annotated spectra suitable for figures, and full pipeline documentation. We know reproducibility matters in academic publishing.

Q: Can you re-analyze my existing MS data?

Yes. We accept raw data in mzML, .RAW, and .d formats from all major instrument vendors (Thermo Fisher, Bruker, SCIEX, Agilent, Waters). Retrospective analysis is one of our most popular services — we often recover 2–3× more identifications than the original analysis.

Ready to see what deep learning can find in your MS data?

Send us your raw files for a free consultation. Our scientists will design a tailored deep learning annotation strategy for your project.

Online Inquiry

Please submit a detailed description of your project. We will provide you with a customized project plan to meet your research requests. You can also send emails directly to for inquiries.

* Email
Phone
* Service & Products of Interest
Services Required and Project Description