Intracellular Drug Uptake & Retention Analysis by LC-MS/MS

Direct, quantitative measurement of intracellular compound accumulation, retention kinetics, and subcellular distribution — label-free LC-MS/MS quantification for any small molecule.

A compound's ability to enter cells and remain at a sufficient concentration over time is one of the most critical determinants of its pharmacological activity. Yet for decades, drug discovery teams have relied on a critical but incomplete surrogate — cell permeability (Papp) — to estimate intracellular exposure. While permeability tells you how fast a compound crosses a membrane, it does not tell you how much compound actually accumulates inside cells, how long it stays there, or what fraction is free to engage its target.

The disconnect between permeability and intracellular concentration is well documented. A compound with high Papp may be rapidly effluxed, metabolized intracellularly, or sequestered in lysosomes, resulting in a free intracellular concentration far below what permeability data would suggest. Conversely, a compound with moderate permeability but low efflux and high retention may achieve superior intracellular exposure.

At Creative Proteomics, our Intracellular Drug Uptake & Retention Analysis by LC-MS/MS service fills this critical gap by providing direct, quantitative measurement of intracellular compound concentration — enabling data-driven decisions during lead optimization, target engagement correlation, and drug resistance mechanism studies.

Key Capabilities:

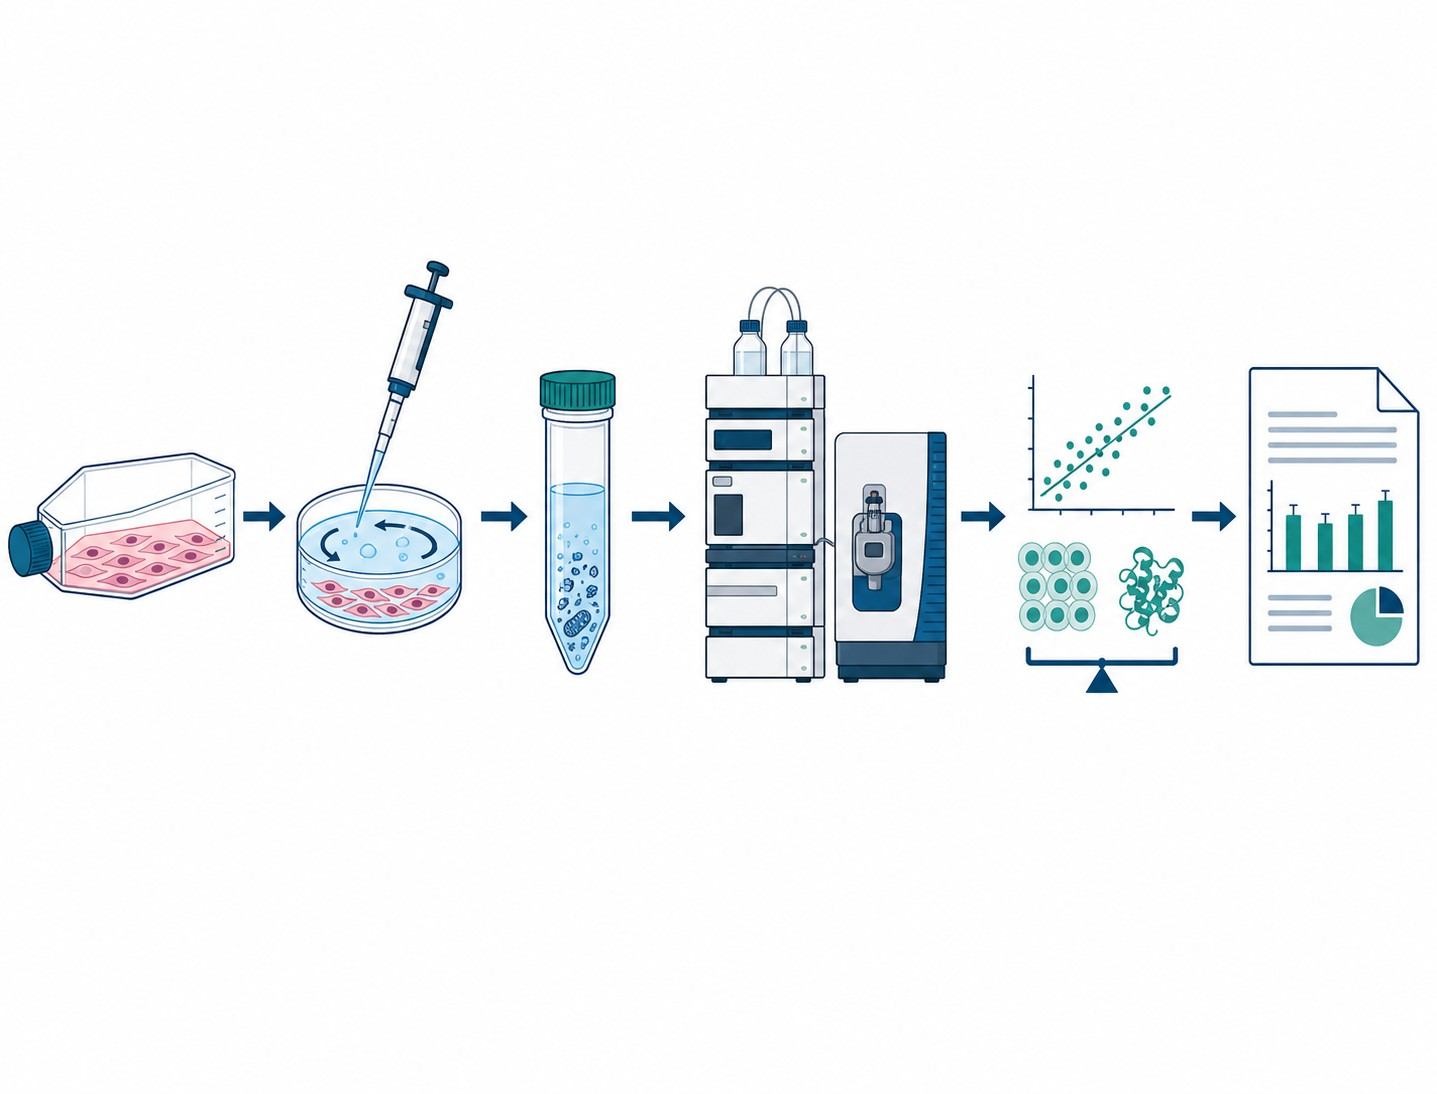
  • Direct LC-MS/MS quantification of intracellular compound concentration — label-free, compound-specific, compatible with any small molecule
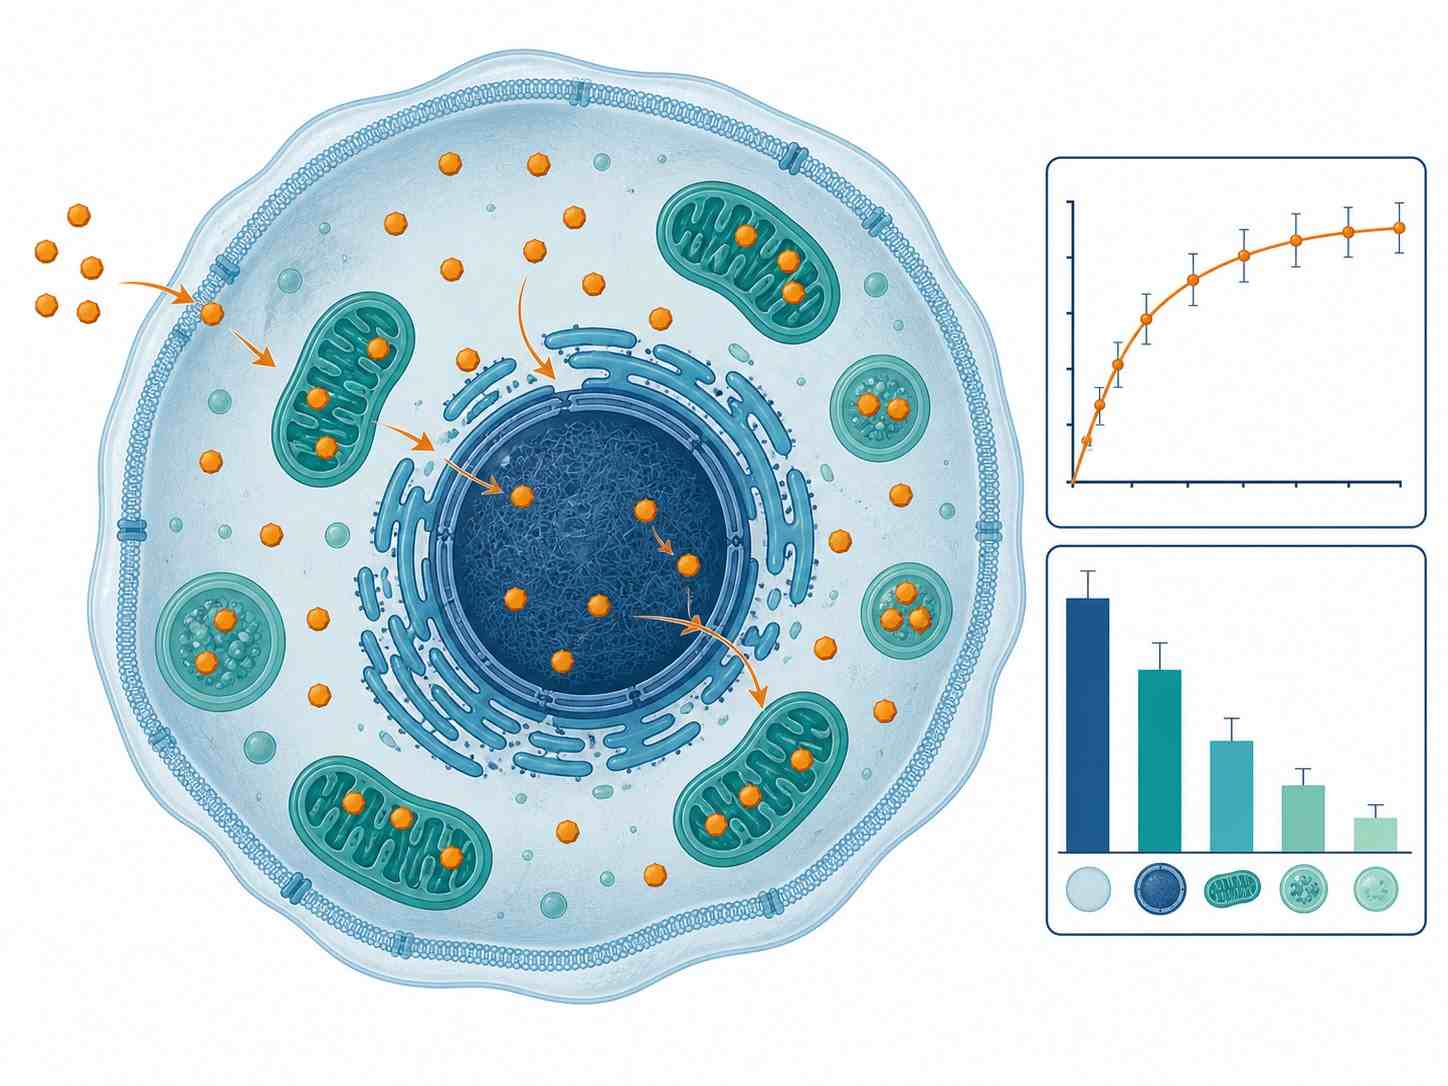
  • Time-course uptake kinetics (0-120 min), steady-state accumulation, and efflux/retention profiling
  • Subcellular fractionation: cytosolic, nuclear, mitochondrial, and membrane-bound distribution
  • Multiple validated cell models: suspension cells, adherent cells, primary hepatocytes, 3D spheroids, and drug-resistant lines
  • PROTAC, macrocycle, and beyond-Rule-of-5 compound compatibility
  • Integrated with our cell-based MS drug screening platform
Intracellular drug uptake and retention analysis platform overview showing compound entry into a cell, intracellular distribution across organelles, and LC-MS/MS quantification with time-concentration curves and subcellular fractionation data outputs.
Overview Cell Models Workflow Parameters Applications Case Study Sample Requirements FAQ

Why Measure Intracellular Drug Uptake & Retention?

The fundamental question in cellular pharmacology is not "how fast does a compound cross a membrane?" but rather "how much compound reaches the target site inside the cell, and how long does it stay there?" Intracellular drug uptake and retention analysis directly answers this question.

The permeability-intracellular concentration disconnect: A compound with high Papp in a Caco-2 assay may still achieve low intracellular concentration if it is rapidly effluxed by P-gp, metabolized by intracellular enzymes, or sequestered in lysosomes via ion trapping. Conversely, a compound with moderate permeability but low efflux and high retention may achieve superior intracellular exposure. Direct LC-MS/MS measurement resolves this uncertainty.

Why total cellular concentration does not equal free intracellular concentration: When a compound enters a cell, it partitions into multiple compartments — cytosol, nucleus, mitochondria, lysosomes, and membranes. Only the free (unbound) fraction in the cytosol is available for target engagement. Non-specific binding to cellular components, lysosomal trapping (for basic compounds), and active efflux all reduce the free intracellular concentration. Direct LC-MS/MS measurement of total intracellular concentration, combined with fractionation and equilibrium dialysis, provides the data needed to estimate free intracellular exposure.

MethodWhat It MeasuresKey Limitation
Fluorescent dye/imagingFluorescence intensity (surrogate)Requires fluorescent compounds; dye may alter distribution; not compound-specific
Radiolabeled tracerTotal radioactivityRequires radiolabeled compound; cannot distinguish parent drug from metabolites
LC-MS/MS direct quantification (our service)Mass of parent compound per cell or per mg proteinDirect, label-free, compound-specific; compatible with any small molecule
MALDI-MSISpatial distribution in tissue sectionsSemi-quantitative; lower throughput

Cell Models & Assay Formats

Selecting the right cell model is critical for generating uptake and retention data that translates to in vivo intracellular exposure. We offer a range of validated models, each with specific applications.

Suspension Cells (Jurkat, HL-60, THP-1)

Fast uptake kinetics; ideal for time-course studies and high-throughput screening of intracellular accumulation. Suitable for immune cell drug profiling.

Adherent Cells (HeLa, HEK293, A549, HepG2)

Standard monolayer format for uptake, accumulation, and retention studies. Compatible with 96-well and 24-well plate formats.

Primary Human Hepatocytes

Fresh or cryopreserved; active uptake transporters (OATP, NTCP, OCT1). Gold standard for hepatic uptake assessment and transporter-mediated DDI studies.

Caco-2 (Differentiated)

21-day monolayer with full transporter expression. Intracellular accumulation in enterocyte-like cells for oral absorption prediction.

MDCK-MDR1 / MDCK-BCRP

Transporter-transfected models for specific efflux assessment. Intracellular retention in the presence of P-gp or BCRP-mediated efflux.

3D Spheroids / Tumoroids

Multicellular architecture with extracellular matrix, hypoxia gradients, and cell-cell junctions. More physiologically relevant for solid tumor drug penetration and retention.

Drug-Resistant Cell Lines

P-gp-overexpressing, BCRP-overexpressing, and MRP-overexpressing lines. Direct comparison of intracellular accumulation in sensitive vs. resistant phenotypes.

Primary Immune Cells (PBMCs, Macrophages, T Cells)

For immunotherapy, CAR-T, and antibody-drug conjugate (ADC) payload accumulation studies.

Assay Formats Available: Time-course uptake (0, 5, 15, 30, 60, 120 min), steady-state accumulation (2-24 h), efflux/retention (load → wash → measure over 0-120 min), subcellular fractionation (cytosolic, nuclear, mitochondrial, membrane-bound), and cocktail assay (up to 5 compounds per experiment with MRM multiplexing).

Intracellular Drug Uptake & Retention Workflow

A standardized, quality-controlled process from cell culture to final report. Each project is tailored to your specific compound, cell model, and research question.

1

Cell Culture & Treatment

Cells are cultured under specified conditions and treated with test compounds at defined concentrations (typically 0.1-50 µM). For time-course studies, cells are harvested at multiple time points. For steady-state accumulation, incubation continues for 2-24 h. For efflux studies, cells are loaded, washed, and sampled over time.

2

Wash & Quench

After treatment, cells are rapidly washed with ice-cold PBS (3×) to remove extracellular compound. For adherent cells, washing is performed directly in the plate. For suspension cells, centrifugation at 4°C with PBS washes. Quenching with ice-cold methanol stops all metabolic activity.

3

Cell Lysis & Extraction

Cells are lysed with 50% acetonitrile/water or methanol/water (v/v) containing internal standards. For subcellular fractionation, differential centrifugation or commercial fractionation kits are used. Lysates are centrifuged at 14,000g for 10 min at 4°C, and supernatants are collected for LC-MS/MS analysis.

4

LC-MS/MS Analysis

Samples are analyzed on a Sciex Triple Quad 6500+ or Thermo Q Exactive HF-X mass spectrometer coupled with a UHPLC system. Each compound is monitored using optimized MRM transitions with 3-5 min analytical run time. Internal standards (isotope-labeled or structural analogs) are used for all quantifications. Method validated for linearity (R² >0.99), accuracy (85-115%), and precision (CV<15%).

5

Data Normalization & Calculation

Intracellular concentration is normalized to cell count (per 10⁶ cells) or total protein content (per mg protein). Key parameters: uptake rate (pmol/min/10⁶ cells), steady-state accumulation ratio (Cintra/Cmedium), retention half-life (t½, min), efflux rate constant (keff, min⁻¹), and AUC ratio (AUCcell/AUCmedium).

6

Deliverables

Comprehensive report including: time-concentration curves for each compound, uptake rate constants, steady-state accumulation ratios, retention half-lives, comparison to reference compounds, and raw LC-MS/MS data files (available upon request). Typical turnaround: 2-3 weeks from sample receipt.

Intracellular drug uptake and retention workflow diagram showing six steps from cell culture and compound treatment through wash and quench, cell lysis, LC-MS/MS analysis, data normalization, and final deliverable report generation.

Key Parameters & Data Outputs

Our LC-MS/MS platform delivers quantitative intracellular exposure data with defined quality metrics. Each parameter is calculated using standardized equations and validated against reference compounds.

ParameterDescriptionTypical Range
Intracellular concentrationCompound amount per 10⁶ cells or per mg proteinVariable by compound
Uptake rateInitial linear rate of intracellular accumulation0.1-100 pmol/min/10⁶ cells
Steady-state accumulation ratioCintra / Cmedium at equilibrium1-1000 (active uptake)
Retention half-life (t½)Time for 50% of compound to efflux after washout5-120 min
Efflux rate constant (keff)First-order rate of compound loss from cells0.005-0.1 min⁻¹
Fraction unbound in cell (fu,cell)Free fraction available for target binding0.01-0.5
AUC cell/AUC medium ratioTotal intracellular exposure over time1-500

Quality Control: Reference compounds are included in every experiment: metformin (OCT substrate, high accumulation), digoxin (P-gp substrate, low retention), and propranolol (high passive permeability, rapid efflux).

Applications

Intracellular drug uptake and retention analysis is most impactful when researchers need to understand why compounds show discrepancies between biochemical and cellular potency, or when optimizing intracellular exposure during lead optimization.

Target Engagement & Cellular Potency Correlation

Many compounds show a disconnect between biochemical potency (IC₅₀ in purified enzyme assays) and cellular potency (EC₅₀ in cell-based assays). Intracellular concentration measurement bridges this gap by revealing the true free drug concentration available for target binding.

We provide: Time-concentration profiles and fu,cell estimates for PK/PD modeling.

Drug Resistance Mechanism (Efflux Upregulation)

P-gp, BCRP, and MRP overexpression is a major mechanism of acquired drug resistance in cancer. Direct comparison of intracellular accumulation in parental vs. resistant cell lines quantifies the contribution of efflux transporters.

We provide: Accumulation ratios in sensitive vs. resistant pairs, with and without specific inhibitors (verapamil, Ko143, MK-571).

PROTAC Intracellular Delivery Assessment

PROTACs (molecular weight 800-1200 Da) face unique cellular uptake challenges. Our LC-MS/MS platform directly measures intracellular PROTAC concentration, enabling structure-intracellular exposure relationship (SIER) analysis.

We provide: Time-course uptake and retention data for PROTACs, including ternary complex formation efficiency correlation.

Lysosomal Trapping & Phospholipidosis Risk

Basic lipophilic compounds (e.g., many CNS drugs and kinase inhibitors) accumulate in lysosomes via ion trapping. This can lead to phospholipidosis and off-target toxicity. Our assay quantifies lysosomal vs. cytosolic distribution.

We provide: Subcellular fractionation data showing lysosomal enrichment ratio and phospholipidosis risk assessment.

Formulation Strategy for Poorly Permeable Compounds

For compounds with low permeability, formulation strategies (lipid-based, nanoparticle, prodrug) aim to enhance intracellular delivery. Our assay provides direct evidence of formulation-enabled uptake enhancement.

We provide: Intracellular concentration comparison between free drug and formulated drug, with time-course and dose-response data.

Transporter-Mediated DDI (OATP, OCT, MATE)

Regulatory agencies (FDA, EMA) require assessment of transporter-mediated drug-drug interactions. Our cellular uptake assay in transporter-expressing cells (OATP1B1, OATP1B3, OCT2, MATE1) quantifies victim and perpetrator potential.

We provide: Uptake ratios in transporter-expressing vs. control cells, with and without known inhibitors.

For related services, see our cell permeability assessment, intracellular accumulation MS, RapidFire MS screening, and drug-resistance mechanism MS services. Explore our cell-based MS drug screening platform for the full suite of cellular ADME profiling capabilities.

Case Study: LC-MS/MS Quantification of Intracellular Compound Accumulation in E. coli

Geddes EJ, Li Z, Hergenrother PJ. An LC-MS/MS assay and complementary web-based tool to quantify and predict compound accumulation in E. coli. Nature Protocols 2021;16:4833-4859. https://doi.org/10.1038/s41596-021-00598-y (PMCID: PMC8715754)

Background

Intracellular accumulation of antibiotics in Gram-negative bacteria is a major determinant of efficacy, yet methods to measure it were limited to radiolabeled compounds or fluorescent probes. Geddes et al. (2021) developed a standardized LC-MS/MS-based protocol to quantify intracellular compound accumulation in Escherichia coli, addressing the need for a label-free, compound-agnostic method applicable to any small molecule.

Study Design

The authors established a complete workflow: bacterial culture to mid-log phase → compound treatment (10-200 µM, 10 min) → rapid centrifugation through silicone oil to separate cells from extracellular medium → cell lysis with acetonitrile/water → LC-MS/MS quantification using multiple reaction monitoring (MRM). Key validation experiments included: (1) time-course accumulation for 24 compounds with diverse chemotypes; (2) correlation between LC-MS/MS accumulation data and antibacterial activity (MIC values); (3) efflux pump contribution assessment using a ΔtolC mutant strain; and (4) development of the eNTRyway web tool for predicting compound accumulation from chemical structure.

Key Findings

The LC-MS/MS assay successfully quantified intracellular accumulation for all 24 test compounds, with detection limits as low as 0.1 pmol/10⁶ cells. A strong correlation was observed between intracellular accumulation and antibacterial activity (R² = 0.72 for the training set). The ΔtolC mutant (efflux-deficient) showed 2- to 50-fold higher accumulation than wild-type, confirming the role of efflux in reducing intracellular concentration. The eNTRyway web tool, trained on the LC-MS/MS data, achieved a predictive accuracy of R² = 0.67 for an external test set of 16 compounds.

Relevance

This case study demonstrates the power of direct LC-MS/MS quantification of intracellular compound accumulation. The same principles — rapid separation of cells from extracellular medium, lysis, LC-MS/MS analysis, and normalization to cell count — are directly applicable to mammalian cell uptake and retention studies. The eNTRyway approach also highlights how LC-MS/MS data can be used to build predictive models for intracellular exposure.

Fig. 2 from Geddes et al. (2021): LC-MS/MS quantification workflow for intracellular compound accumulation in E. coli showing the silicone oil separation method, MRM chromatograms, and correlation plot between intracellular accumulation and antibacterial activity (adapted from Nature Protocols, CC BY 4.0).

Adapted from Geddes et al. (2021): LC-MS/MS workflow for intracellular compound accumulation quantification in E. coli, demonstrating the label-free approach applicable to mammalian cell uptake studies.

Sample Requirements for Drug Uptake & Retention Studies

Our protocols are optimized for a wide range of compound types and cell models. The table below provides recommended starting conditions for standard projects.

ParameterRequirement
Compound amount≥50 µL of 10 mM DMSO stock (or ≥0.5 mg solid) per compound
Number of compounds≥5 per project (minimum)
Cell modelSuspension, adherent, primary, 3D spheroid, or resistant cell lines
Cell number≥1 × 10⁶ cells per condition (standard); ≥5 × 10⁵ (miniaturized)
Replicates3 per condition (triplicate wells); 2 independent experiments recommended
Time points0, 5, 15, 30, 60, 120 min (standard); custom schedules available
Compound concentration0.1-50 µM (standard); solubility-limited concentrations accepted
DMSO tolerance≤0.5% final concentration
Control compoundsProvided by us (metformin, digoxin, propranolol)
ShippingDry ice for cell lysates; ambient temperature for DMSO stock solutions
Turnaround time2-3 weeks (standard project); 1 week (expedited, 10-compound minimum)

For rare or proprietary cell models, we offer assay development and validation services. Contact our scientific team to discuss your specific requirements.

FAQ

Frequently Asked Questions

Q: How is intracellular drug uptake different from permeability?

Permeability (Papp) measures the rate at which a compound crosses a cell monolayer from apical to basolateral side. Intracellular uptake measures the actual amount of compound that accumulates inside cells. A compound can have high permeability but low intracellular accumulation if it is rapidly effluxed, metabolized, or trapped in lysosomes. Both parameters are complementary for a complete ADME picture.

Q: What cell models do you recommend for uptake studies?

For hepatic uptake, primary human hepatocytes or transporter-transfected cell lines (OATP1B1, OATP1B3). For cancer cell accumulation, the specific cancer cell line of interest (e.g., A549 for lung, MCF-7 for breast). For drug resistance mechanisms, paired parental/resistant lines. For general screening, HeLa or HEK293 cells. Contact us for model selection guidance.

Q: How do you distinguish between membrane-bound and free cytosolic drug?

We offer subcellular fractionation using differential centrifugation or commercial kits. After treatment and washing, cells are homogenized and fractionated into cytosolic, membrane/organelle, nuclear, and cytoskeletal fractions. Each fraction is analyzed separately by LC-MS/MS to determine the distribution profile.

Q: What is the minimum cell number needed?

For standard LC-MS/MS quantification, we recommend ≥1 × 10⁶ cells per condition. For miniaturized assays (e.g., rare primary cells or limited samples), we can work with as few as 5 × 10⁵ cells with optimized sample preparation and high-sensitivity MRM methods.

Q: Can you measure uptake in 3D spheroids or organoids?

Yes. We have validated protocols for drug uptake and retention in 3D spheroids (e.g., HCT116, MCF-10A) and patient-derived organoids. The workflow includes spheroid dissociation, washing, lysis, and LC-MS/MS analysis. Penetration gradients within spheroids can be assessed using laser capture microdissection (LCM) coupled with LC-MS/MS.

Q: How do you normalize intracellular concentration data?

We normalize to cell count (per 10⁶ cells) using automated cell counters or hemocytometer counts, and to total protein content (per mg protein) using BCA or Bradford assays. Both normalization methods are provided in the final report. For spheroids, normalization to total DNA content is also available.

Q: What is fu,cell and why does it matter?

fu,cell (fraction unbound in cell) is the fraction of intracellular compound that is free (not bound to cellular components) and available for target engagement. It is measured using equilibrium dialysis of cell lysate or intact cell binding assays. fu,cell is critical for translating biochemical potency (IC₅₀) to cellular potency (EC₅₀) and for PK/PD modeling.

Q: Can you measure uptake of PROTACs and other large molecules?

Yes. Our LC-MS/MS platform is label-free and detects compounds by mass-to-charge ratio. We have validated protocols for PROTACs (MW 800-1200 Da), cyclic peptides, and antibody-drug conjugate payloads. The MRM transitions are optimized for each compound individually.

Q: How do you handle compounds with high non-specific binding?

For compounds with high non-specific binding to plasticware or cell membranes, we use low-binding tubes and plates, include 0.1% BSA or 0.01% Tween-80 in wash buffers, and perform recovery controls. Non-specific binding is quantified using cell-free controls and subtracted from total intracellular concentration.

Q: What is the turnaround time for a standard uptake study?

Standard projects (5-20 compounds, single cell line, 6 time points) are completed in 2-3 weeks from sample receipt. Expedited projects (10-compound minimum) can be delivered in 1 week. Large screening campaigns (50+ compounds) require 3-4 weeks.

References

  1. Geddes EJ, Li Z, Hergenrother PJ. An LC-MS/MS assay and complementary web-based tool to quantify and predict compound accumulation in E. coli. Nat Protoc. 2021;16:4833-4859. doi:10.1038/s41596-021-00598-y. PMCID: PMC8715754. https://doi.org/10.1038/s41596-021-00598-y
  2. Gordon LJ, Allen M, Artursson P, et al. Direct Measurement of Intracellular Compound Concentration by RapidFire Mass Spectrometry Offers Insights into Cell Permeability. SLAS Discov. 2016;21(2):156-164. doi:10.1177/1087057115604141. https://doi.org/10.1177/1087057115604141
  3. Mateus A, Gordon LJ, Wayne GJ, et al. Prediction of intracellular exposure bridges the gap between target- and cell-based drug discovery. Proc Natl Acad Sci USA. 2017;114(30):E6231-E6239. doi:10.1073/pnas.1701848114. https://doi.org/10.1073/pnas.1701848114
  4. Hann MM, Simpson GL. Intracellular drug concentrations and the prediction of the therapeutic window. Drug Discov Today. 2014;19(9):1298-1302. doi:10.1016/j.drudis.2014.06.004. https://doi.org/10.1016/j.drudis.2014.06.004

Plan your drug uptake & retention study with the MassTarget™ team

Tell us about your compounds, cell models, and research questions — our scientists will design a tailored intracellular exposure profiling strategy for your drug discovery program.


For research use only. Not for use in diagnostic procedures. Creative Proteomics provides intracellular drug uptake and retention analysis services exclusively for research and development purposes. Results are not intended for clinical diagnosis or medical decision-making.

Online Inquiry

Please submit a detailed description of your project. We will provide you with a customized project plan to meet your research requests. You can also send emails directly to for inquiries.

* Email
Phone
* Service & Products of Interest
Services Required and Project Description