Phosphoproteomics Activation Mapping Service for Drug Response and Kinase Pathway Analysis

Map treatment-induced phosphorylation changes into kinase, pathway, and network-level signaling evidence.

Phosphoproteomics Activation Mapping Service helps you interpret how drug treatment, dose, time, or phenotype changes reshape phosphorylation-driven signaling inside cells, tissues, or disease models. We connect regulated phosphosites to kinase activity, pathway activation, signaling networks, and follow-up validation priorities, so your team can move from site-level data to clearer mechanism-focused decisions.

At Creative Proteomics, we combine phosphopeptide enrichment, LC-MS/MS, statistical analysis, kinase inference, pathway enrichment, and network visualization to turn treatment-response samples into clear, review-ready signaling evidence.

Our service helps you:

  • Map treatment-induced phosphosite changes to kinase and pathway-level hypotheses.
  • Compare control, dose, time-course, or phenotype-defined sample groups.
  • Receive phosphosite tables, pathway heatmaps, kinase ranking, and network views.
  • Prioritize phosphorylation markers for follow-up validation.
  • Support drug response, mechanism-of-action, and translational signaling studies.
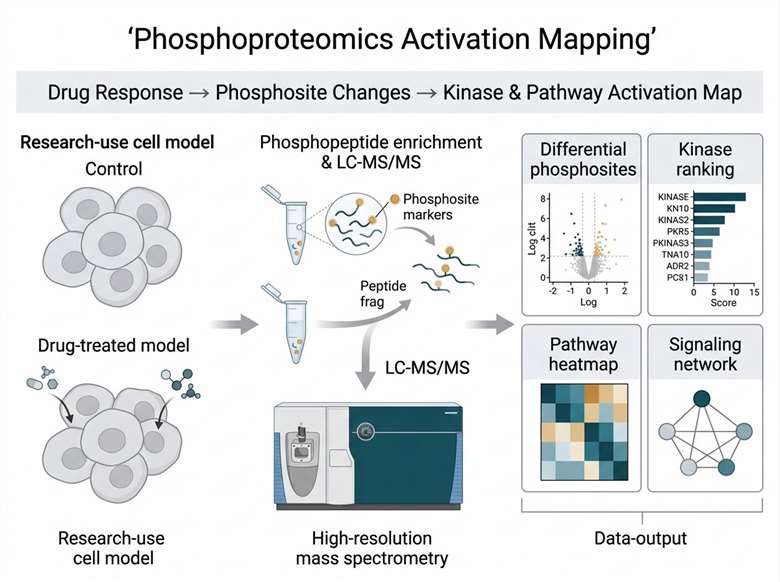
Phosphoproteomics activation mapping workflow for drug response and kinase pathway analysis.
Signaling Changes Right Fit Workflow & QC Study Design Sample Bioinformatics Demo Results Method Comparison Applications Case Study Start Project FAQ References Disclaimer

Map Phosphorylation-Driven Signaling Changes from Drug-Treated Models

Drug-response studies often show a clear phenotype before the mechanism is understood. Cells may stop proliferating, change morphology, shift metabolism, or respond differently across dose levels. Total protein abundance can help explain part of the response, but it often misses the fast signaling events driven by phosphorylation.

That is where phosphoproteomics activation mapping is useful. We measure phosphorylation-site changes across your experimental groups, then help interpret those changes at the kinase, pathway, and network levels.

This MassTarget service is different from a standard Phosphoproteomics Service. A standard project may focus on identifying and quantifying phosphoproteins or phosphopeptides. Here, we go further by helping you understand what the phosphorylation pattern may suggest about pathway activity, upstream kinase behavior, and validation planning.

For example, if a treatment changes multiple phosphosites in a MAPK, PI3K-AKT, cell-cycle, DNA-damage, metabolic, or stress-response pathway, we help organize those signals into interpretable maps. The final output is not only a site list. It is a structured activation view that can support your next experimental decision.

When Activation Mapping Is the Right Fit

Drug response without a clear mechanism

This service is a good fit when your compound produces a strong biological response, but the signaling route is still uncertain. We compare treated and control samples to identify regulated phosphosites, affected pathways, and candidate upstream kinases.

Kinase inhibitor or pathway inhibitor profiling

For kinase inhibitors, pathway inhibitors, or pathway-modulating compounds, activation mapping can show how the signaling system changes after treatment. This is useful when the expected target effect is only one part of the response and downstream or compensatory signaling may also matter.

Disease-model signaling dysregulation

We can also compare disease vs control models, resistant vs sensitive models, or phenotype-defined groups. The goal is to identify phosphorylation-driven signaling differences that may not be visible from total protein abundance alone.

Time-course or dose-response signaling studies

Some phosphorylation events are early and transient. Others appear later as adaptive responses. With a time-course or dose-response design, we help track how signaling activity shifts across treatment conditions.

From Sample to Signaling Map: Workflow and QC Checkpoints

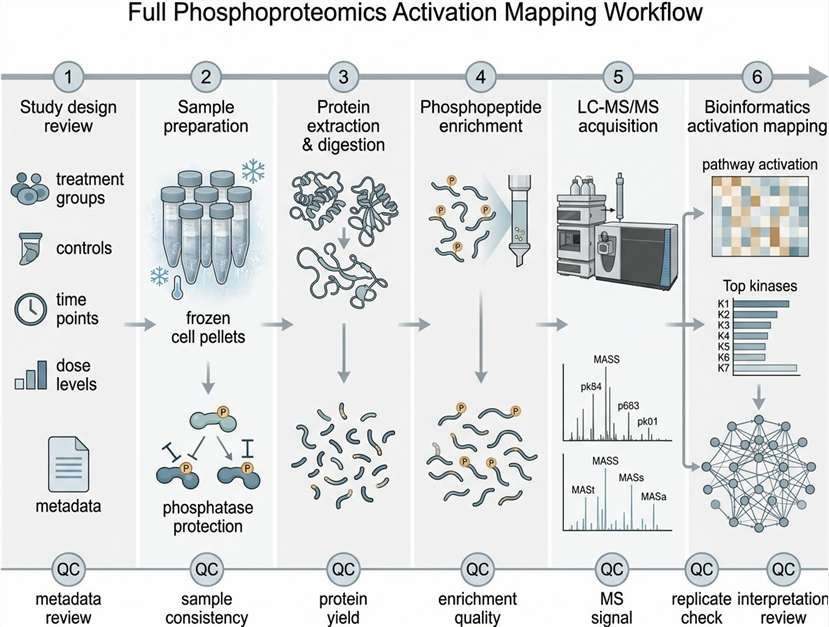
Our workflow covers both the technical phosphoproteomics process and the project-level review needed for meaningful interpretation. Activation mapping depends on sample quality, treatment metadata, enrichment performance, MS data quality, and bioinformatics context.

1

Study design review

We review treatment groups, controls, time points, doses, sample type, and biological question. QC focus: group balance, metadata completeness, and treatment logic.

2

Sample intake and preparation

Samples are checked for type, storage condition, and compatibility with phosphoproteomics processing. QC focus: sample amount, freeze-thaw history, and lysis compatibility.

3

Protein extraction and digestion

Proteins are extracted, quantified, digested, and prepared for phosphopeptide enrichment. QC focus: protein yield, digestion quality, and sample consistency.

4

Phosphopeptide enrichment

Phosphopeptides are enriched to improve detection of phosphorylation events. QC focus: enrichment performance, phosphopeptide recovery, and contamination risk.

5

LC-MS/MS acquisition and data analysis

Enriched phosphopeptides are analyzed, quantified, filtered, and interpreted as kinase, pathway, network, and validation-candidate outputs.

Phosphoproteomics activation mapping workflow with QC checkpoints.
StepWhat HappensQC CheckpointWhy It Matters
1. Study design reviewWe review your treatment groups, controls, time points, doses, sample type, and biological question.Group balance, metadata completeness, treatment logicGood activation mapping starts with interpretable comparisons.
2. Sample intake and preparationSamples are checked for type, storage condition, and compatibility with phosphoproteomics processing.Sample amount, freeze-thaw history, lysis compatibilityPhosphorylation signals can be sensitive to sample handling.
3. Protein extraction and digestionProteins are extracted, quantified, digested, and prepared for phosphopeptide enrichment.Protein yield, digestion quality, sample consistencyReliable peptide preparation supports downstream phosphosite quantification.
4. Phosphopeptide enrichmentPhosphopeptides are enriched to improve detection of phosphorylation events.Enrichment performance, phosphopeptide recovery, contamination riskEnrichment quality affects site coverage and interpretability.
5. LC-MS/MS acquisitionEnriched phosphopeptides are analyzed by LC-MS/MS.MS signal quality, identification rate, replicate consistencyStable acquisition supports group comparison and statistical filtering.
6. Phosphosite quantificationPhosphosites are quantified and compared across groups.Missing-value pattern, normalization, outlier reviewQuantitative quality affects confidence in differential phosphosite calls.
7. Activation-level interpretationRegulated sites are mapped to kinases, pathways, networks, and validation candidates.Biological consistency, database support, inference boundaryInterpretation should support hypotheses, not overstate proof.
8. Deliverable packageWe provide data tables, figures, QC summary, and interpretation notes.File completeness, figure clarity, method summaryYour team receives outputs ready for internal review and follow-up planning.

Study Design Inputs We Need Before Mapping Activation

The strongest projects begin with clear biological contrasts. Before we start, we ask you to share the treatment and sample context behind the project.

  • Sample type: cell pellets, tissue, organoid-derived material, lysate, or other matrix
  • Group design: control, treated, resistant, sensitive, time-course, or dose-response groups
  • Treatment details: compound, concentration, exposure time, vehicle, and known phenotype
  • Replicates: biological replicate number and any technical replicate plan
  • Collection method: harvest timing, wash steps, storage condition, and freeze-thaw history
  • Research question: pathway activation, kinase response, resistance mechanism, or validation marker discovery
  • Desired output: phosphosite table, kinase ranking, pathway heatmap, network map, or validation shortlist

If total protein abundance may also affect interpretation, we can discuss paired total proteomics. This is helpful when the same phenotype may result from both protein abundance changes and phosphorylation-mediated activation changes.

Sample Requirements for Phosphoproteomics Activation Mapping

Phosphorylation-sensitive studies depend on consistent collection, cold handling, and clear metadata. Samples should be collected and stored quickly, and special treatments such as drug exposure should be described in detail.

The table below gives practical starting points based on Creative Proteomics proteomics sample submission guidance. Final requirements may vary by project design, sample complexity, and desired analysis depth.

Sample TypeRecommended InputContainer / FormatShippingRequired MetadataNotes
Suspension or adherent cultured cells5 × 106 cells for label-free/DIA; 1 × 10⁷ cells for larger-scale size recommendationCell pellet in low-bind tube or cryovialDry iceCell line, treatment, dose, time point, control, replicate IDWash with pre-chilled PBS and avoid repeated freeze-thaw.
Trace cell samples200–5000 cells for trace DIA feasibilityLow-bind tubeDry iceCell number, collection method, treatment groupFeasibility review required before project start.
General animal tissues30–50 mg for trace DIA; 100–200 mg is commonly used for routine tissue proteomics depending on tissue typeCryovialDry iceTissue source, region, treatment, time point, replicate IDCollect comparable regions when possible.
Hard animal tissue200 mg for label-free/DIA; 300–500 mg for size recommendationCryovialDry iceTissue type, processing method, storage historyDiscuss grinding or pretreatment needs.
Microbial cell pellets50 μL for label-free/DIA; 100 μL for size recommendationCryovialDry iceSpecies/strain, culture condition, treatment, OD or pellet volumeWash quickly with pre-chilled PBS to reduce medium contamination.
Plasma / serum / CSF20 μL without high-abundance protein depletion; 50–100 μL with depletion1.5 mL tubeDry iceMatrix, anticoagulant if applicable, collection condition, group IDHemolysis and matrix differences can affect interpretation.
Culture supernatant10 mL for label-free/DIA; 20 mL for larger-scale size recommendationTube suitable for frozen shipmentDry iceMedium type, serum condition, treatment, collection timeSerum-free medium limitations should be discussed before submission.
Pure protein / lysate150 μg for label-free/DIA; 300 μg for larger-scale size recommendationFrozen tubeDry iceBuffer composition, protein concentration, inhibitors, freeze-thaw historyBuffer compatibility must be reviewed before phosphopeptide enrichment.
FFPE material10 slices at 10 μm thickness, 1.5 × 2 cm area; 15–20 slices for larger-scale size recommendationFFPE sectionsAs advised by project teamTissue type, section thickness, fixation detailsFeasibility depends on sample quality and project goal.

Bioinformatics Analysis: From Phosphosites to Kinase and Pathway Activity

We design the analysis around your biological question. For activation mapping, the key step is not only finding regulated phosphosites. It is connecting those phosphosites to a useful interpretation framework.

For projects that require deeper network interpretation, our team can also connect activation mapping outputs with Network Analysis Service and Functional Annotation and Enrichment Analysis Service when pathway-level interpretation is important.

Analysis LayerMinimum DeliverablesOptional Add-ons
Phosphosite-level outputsRaw and processed phosphoproteomics data package; phosphosite identification and quantification table; normalized phosphosite intensity matrixDose-response phosphosite trend analysis; time-course signaling trajectory analysis
Group comparisonDifferential phosphosite analysis; group comparison summary; visualization files including volcano plots and heatmapsDrug-combination response mapping; paired total proteomics integration
Kinase and pathway interpretationPathway enrichment or pathway activation summary; candidate upstream kinase inferenceKinase-substrate network visualization; custom pathway panel interpretation
Review packageQC summary for sample, enrichment, MS acquisition, and replicate consistency; method and parameter summary for review and reproducibilityOff-target signaling hypothesis generation; validation marker prioritization; multi-omics integration

Example output files:

  • phosphosite_quantification_matrix.xlsx
  • differential_phosphosite_results.xlsx
  • kinase_inference_summary.xlsx
  • pathway_enrichment_results.xlsx
  • network_edge_table.csv
  • qc_summary.pdf
  • method_and_parameter_summary.txt

Phosphoproteomics can support kinase and pathway inference, but it should not be treated as a single-step proof of a complete mechanism. We use careful language around inference, mapping, prioritization, and hypothesis generation, then help you choose markers for follow-up validation.

Representative Demo Results: What Activation Mapping Can Show

A phosphoproteomics activation mapping report can be built around several result types. The exact figures depend on your design, but the examples below show what your team can expect.

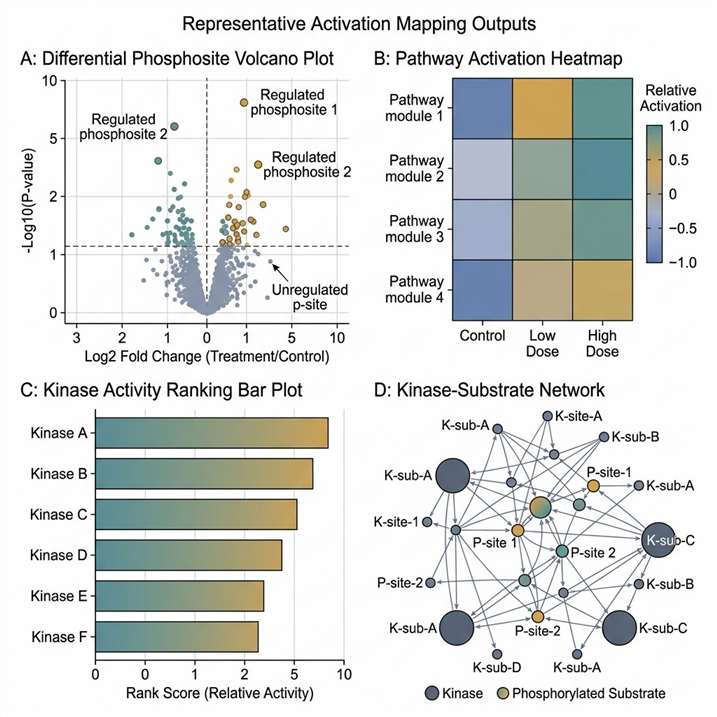
Representative phosphoproteomics activation mapping demo results.

Representative activation mapping outputs

Demo Result TypeWhat It ShowsHow You Can Use It
Differential phosphosite tableRegulated phosphosites with protein name, residue, direction, comparison, and confidence fieldsReview key phosphorylation events and select candidates for validation.
Phosphosite volcano plotPhosphosites that differ between treatment and control groupsQuickly identify strong treatment-associated phosphorylation changes.
Pathway activation heatmapPathway-level response patterns across groups, time points, or dosesSee whether signaling programs appear activated, suppressed, or rewired.
Kinase activity rankingCandidate upstream kinases inferred from phosphosite patternsPrioritize kinase hypotheses for mechanistic follow-up.
Kinase-substrate networkConnections between candidate kinases and regulated substrate sitesCommunicate complex signaling changes in a visual format.
Time-course activation trendPhosphosite or pathway changes across treatment time pointsSeparate early signaling events from later adaptive responses.
Validation candidate shortlistRanked phosphosites or proteins for targeted follow-upPlan Western blot, PRM, or functional assays around the most useful markers.

Choosing the Right Signaling Readout: Phosphoproteomics vs Other Methods

Different methods answer different questions. The best choice depends on whether you need broad discovery, known-marker validation, direct kinase activity measurement, or integrated pathway interpretation.

MethodMain Question AnsweredDiscovery CoverageActivation InsightBest-Fit Use CaseKey LimitationRecommended Follow-Up
Total proteomicsWhich proteins change in abundance?HighIndirectProtein abundance landscape, pathway composition, proteome-wide responseMay miss fast phosphorylation-driven signalingAdd phosphoproteomics when pathway activation is central.
Global phosphoproteomics activation mappingWhich phosphosites, kinases, and pathways change after treatment?HighStrong for phosphorylation-driven signalingDrug response, kinase pathway analysis, time-course signaling, MoA hypothesis generationRequires careful enrichment, design, and interpretationValidate selected sites with targeted assays.
Western blotDoes a known protein or phosphosite change?LowStrong for selected markersFollow-up validation of known targets or candidate markersAntibody-dependent and low throughputUse after discovery-scale phosphoproteomics.
Targeted phosphorylation assayWhat happens to selected phosphorylation sites?Low to mediumStrong for known sitesFocused validation when markers are already chosenNot ideal for broad discoveryUse phosphoproteomics first if markers are unknown.
Kinase MS activity assayWhat is the activity of a selected kinase or kinase panel?FocusedDirect for selected kinase activityTesting a defined kinase hypothesisDoes not map the whole signaling networkPair with phosphoproteomics when upstream and downstream context matters.
Multi-omics MoA profilingHow do signaling, abundance, metabolism, and phenotype connect?BroadestIntegratedComplex drug response, resistance, pathway rewiring, combination studiesRequires stronger study design and interpretationUse when one data layer cannot explain the phenotype.

A practical rule is simple: choose total proteomics when protein abundance is the main question. Choose phosphoproteomics activation mapping when kinase signaling, pathway activation, or rapid treatment response is the main question. Choose targeted methods when you already know which markers need validation.

Applications in Drug Discovery and Translational Research

Kinase inhibitor response profiling

We compare treated and control samples to see whether expected downstream phosphorylation patterns change and whether additional compensatory signaling appears.

Pathway inhibitor MoA studies

For pathway-modulating compounds, activation mapping helps show which signaling branches respond to treatment. This can support MoA hypotheses and guide follow-up marker selection.

Combination treatment response mapping

Combination studies often produce signaling changes that are not obvious from one marker. Phosphoproteomics can help compare single-agent and combination groups at the pathway and network levels.

Resistance-associated signaling rewiring

Resistant models may activate alternative pathways or bypass signals. Activation mapping can help identify phosphorylation patterns that differ between sensitive and resistant groups.

Phenotype-to-pathway hypothesis generation

When a phenotype is clear but the signaling explanation is not, phosphoproteomics can help move from observation to a testable pathway hypothesis.

Case Study: PKM2 S287 Phosphorylation Links Functional State, Metabolism, and Treatment Response

CIP2A induces PKM2 tetramer formation and oxidative phosphorylation in non-small cell lung cancer. Cell Discovery. 2024.

Background

Liang et al. published a 2024 open-access study in Cell Discovery titled CIP2A induces PKM2 tetramer formation and oxidative phosphorylation in non-small cell lung cancer. The study investigated how CIP2A regulates metabolic behavior in non-small cell lung cancer models.

The authors focused on PKM2 because PKM2 can exist in different oligomeric states and those states are linked to different metabolic functions. The central question was how CIP2A affects PKM2 state, phosphorylation, cellular localization, oxidative metabolism, and response to combined treatment conditions.

Methods

The study used multiple experimental approaches across cell models, protein interaction experiments, metabolic assays, phosphorylation analysis, and animal tumor samples. The authors identified PKM2 as a CIP2A-binding protein by immunoprecipitation followed by mass spectrometry. They then used co-immunoprecipitation, pull-down assays, immunofluorescence, proximity ligation assays, gel filtration, crosslinking experiments, site-directed mutants, phospho-specific analysis, Seahorse metabolic assays, and tumor sample staining.

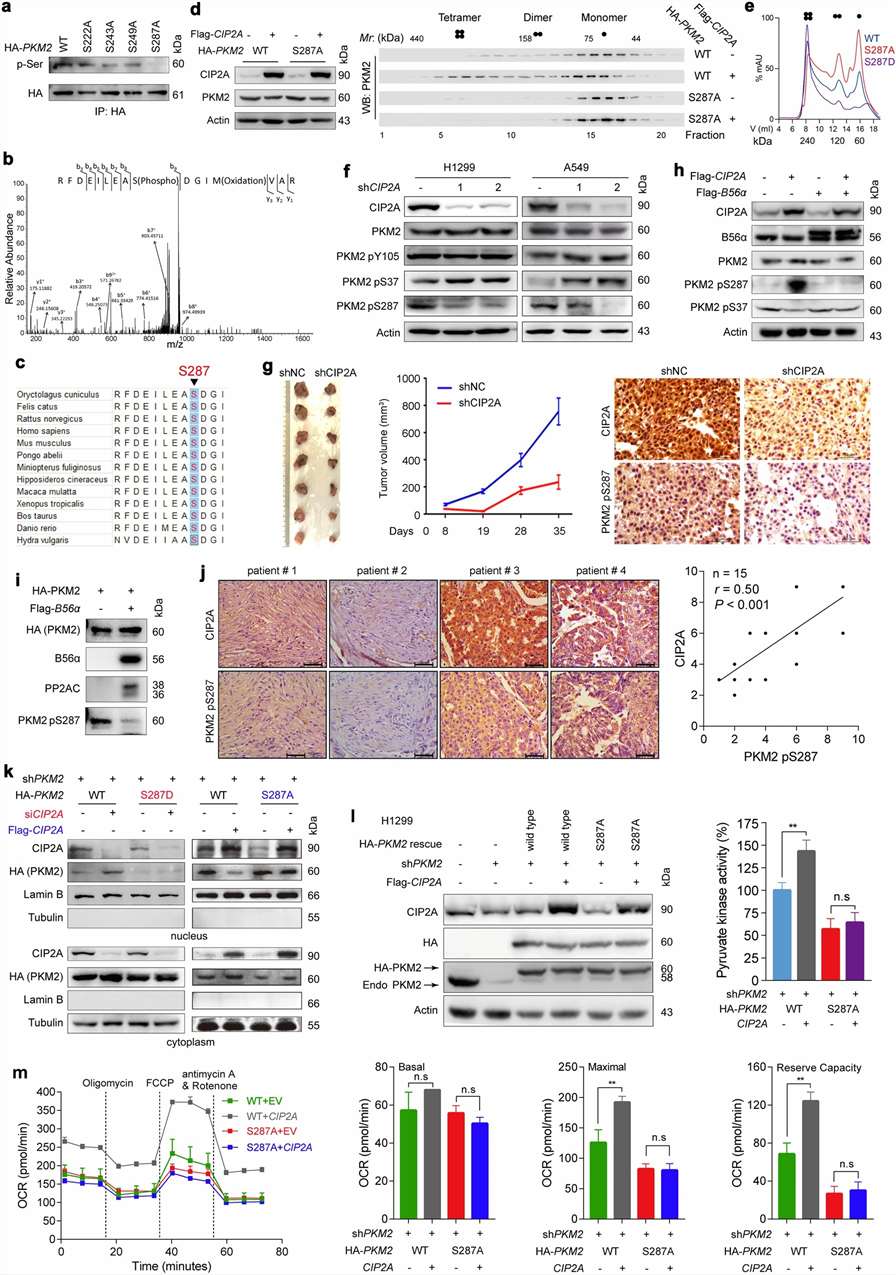
For the activation-mapping angle, Fig. 5 is especially relevant. In this figure, the authors tested whether serine 287 is a critical phosphorylation site of PKM2. They used S287A and S287D mutants, MS-based site evidence, size exclusion chromatography, phosphorylation-specific analyses, pyruvate kinase activity assays, and OCR mitochondrial respiration measurements.

Results

The study reported several connected observations.

First, CIP2A was found to bind PKM2 and promote PKM2 tetramer formation. The authors showed that CIP2A knockdown reduced PKM2 tetramer levels, while CIP2A overexpression shifted PKM2 toward higher-molecular-weight forms.

Second, S287 was identified as a key phosphorylation site. In Fig. 5a, the S287A mutation reduced PKM2 phosphorylation, while the other tested serine-to-alanine mutants did not significantly reduce overall PKM2 phosphorylation under the same condition. In Fig. 5b, MS analysis showed PKM2 S287 phosphorylation. In Fig. 5d and Fig. 5e, PKM2 S287 status was linked to oligomeric state, including tetramer, dimer, and monomer distribution.

Third, the authors connected this phosphorylation site to tumor-model and tissue evidence. In Fig. 5g, CIP2A knockdown inhibited tumor growth and reduced PKM2 S287 phosphorylation in tumor samples from mice inoculated with shCIP2A-expressing A549 cells. In Fig. 5j, IHC staining of 15 human lung adenocarcinoma specimens showed that PKM2 pS287 levels and CIP2A levels were correlated.

Fourth, S287 phosphorylation was linked to functional output. In Fig. 5l, PKM2 S287A showed lower pyruvate kinase activity compared with the relevant control context. In Fig. 5m, OCR mitochondrial respiration parameters were also affected, with measurements reported from three independent experiments. The authors further reported that PKM2 S287 phosphorylation was associated with CIP2A regulation and metabolic state.

Fifth, the study connected phosphorylation state to treatment-response logic. The abstract reported that CIP2A-targeting compounds synergized with a glycolysis inhibitor in suppressing cell proliferation in both in vitro and in vivo models.

Conclusion

This paper is a strong example of why phosphorylation-site evidence matters beyond site identification. The S287 phosphorylation event was not treated as an isolated modification. It was connected to PKM2 oligomeric state, pyruvate kinase activity, mitochondrial respiration, tumor-model observations, and treatment-response behavior.

For phosphoproteomics activation mapping, this is the type of logic we aim to support: a phosphosite change should be interpreted in relation to protein function, pathway activity, biological state, and practical validation plans.

PKM2 S287 phosphorylation activation mapping in non-small cell lung cancer.

The most relevant source figure is Fig. 5, “S287 is a critical phosphorylation site of PKM2.” Adapted from Liang et al., Cell Discovery (2024), Fig. 5, the figure shows how PKM2 S287 phosphorylation was associated with PKM2 oligomeric switching, pyruvate kinase activity, mitochondrial respiration, and tumor-response evidence.

How to Start a Phosphoproteomics Activation Mapping Project

Send us your treatment design and research question first. Our team can help review whether phosphoproteomics activation mapping is the right fit and whether paired total proteomics or additional validation planning would strengthen the project.

Useful starting information includes:

  • Sample type and available amount
  • Number of groups and biological replicates
  • Treatment compound, dose, and exposure condition
  • Control group and vehicle information
  • Time points or dose levels, if applicable
  • Known phenotype or expected pathway
  • Desired deliverables, such as kinase ranking, pathway heatmap, or validation marker list
  • Any existing proteomics, transcriptomics, metabolomics, or functional assay data

Share your treatment design with Creative Proteomics, and we will help you plan an activation mapping workflow that fits your signaling question.

FAQ

Frequently Asked Questions

Q: What is phosphoproteomics activation mapping?

Phosphoproteomics activation mapping measures phosphorylation-site changes and interprets them at the kinase, pathway, and signaling network levels. It is useful when you need to understand how treatment or phenotype changes affect signaling activity.

Q: How is this different from standard phosphoproteomics service?

Standard phosphoproteomics often focuses on identifying and quantifying phosphosites. Activation mapping focuses on what those changes may suggest about kinase activity, pathway activation, network rewiring, and validation planning.

Q: Can phosphoproteomics infer kinase activity?

Yes, phosphosite patterns can support upstream kinase inference when multiple regulated sites, substrate information, motif context, and pathway evidence point toward candidate kinases. The result should be treated as a prioritized hypothesis for follow-up validation.

Q: Does a phosphosite change prove pathway activation?

Not by itself. A single phosphosite change may suggest a regulatory event, but pathway activation should be interpreted using site patterns, pathway context, replicate consistency, and supporting evidence.

Q: Should I run total proteomics together with phosphoproteomics?

Paired total proteomics is useful when protein abundance changes may influence interpretation. It helps separate phosphorylation-specific regulation from changes caused by altered protein levels.

Q: What sample types are suitable?

Common starting materials include drug-treated cell pellets, control vs treated tissue samples, time-course samples, dose-response samples, organid-derived samples, and compatible protein lysates. Final feasibility depends on sample quality, protein yield, storage history, and study design.

Q: Can this service support time-course or dose-response studies?

Yes. Time-course and dose-response designs are well suited for activation mapping because they can show whether signaling changes are early, delayed, transient, dose-dependent, or adaptive.

Q: What deliverables will I receive?

Deliverables may include raw and processed data, phosphosite quantification tables, differential phosphosite results, kinase inference summaries, pathway enrichment results, network visualizations, QC summaries, and method notes.

Q: How are validation markers prioritized?

We can prioritize markers based on statistical strength, biological relevance, pathway position, kinase-substrate support, consistency across groups, and suitability for targeted follow-up assays.

Q: When should I choose Western blot or targeted assays instead?

Choose Western blot or targeted assays when you already know the marker you want to test. Choose activation mapping when the key signaling markers or upstream kinases are still unknown.

Compliance / Disclaimer

Creative Proteomics provides this service for Research Use Only. This service is not intended for clinical diagnosis, medical decision-making, patient management, or therapeutic use.

Online Inquiry

Please submit a detailed description of your project. We will provide you with a customized project plan to meet your research requests. You can also send emails directly to for inquiries.

* Email
Phone
* Service & Products of Interest
Services Required and Project Description