Targeted Metabolomics Panel Screening for Drug Discovery

When you already know which metabolites matter — measure them with the precision your data decisions require.

Targeted metabolomics panel screening is the analytical approach of choice once a hypothesis is in hand. Rather than profiling the entire metabolome, it focuses quantitative power on a predefined set of metabolites — a pathway, a biomarker class, or a mechanistically relevant analyte group — and delivers absolute or calibrated relative concentrations with validated accuracy across biological replicates and study time points.

At Creative Proteomics, targeted metabolomics panels are built on triple-quadrupole LC-MS/MS (MRM) and high-resolution PRM workflows. Each panel is matched to the biological question: bile acid panels for enterohepatic signalling studies, acylcarnitine and TCA cycle panels for mitochondrial function assessment, amino acid and one-carbon metabolism panels for mechanistic drug follow-up, nucleotide panels for proliferation pathway confirmation, and custom panels designed around your compound's known mechanism. The output is concentration data — not feature ratios — anchored to stable-isotope-labelled internal standards and validated against QC benchmarks before any biological interpretation begins. For earlier-stage discovery where the metabolite target set is not yet defined, our untargeted metabolomics MoA service supports hypothesis generation upstream of panel design.

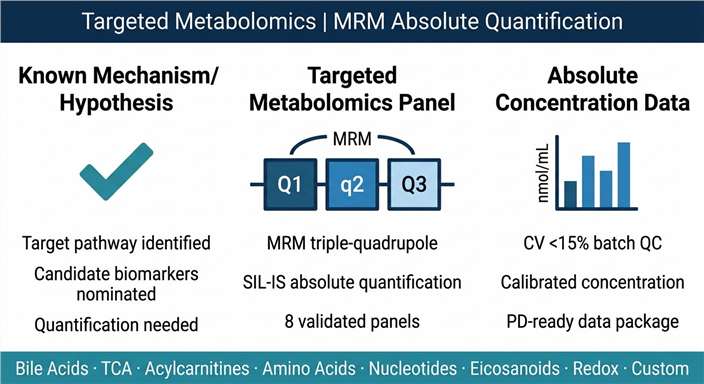
Targeted metabolomics panel screening overview: from defined metabolite panel and drug-treated samples through MRM triple-quadrupole LC-MS/MS to absolute concentration deliverables and pharmacodynamic biomarker confirmation.
What Is Targeted Panel Service Overview Tech Comparison Sample Demo Case Study FAQ

What Targeted Metabolomics Panel Screening Measures — and Why Precision Matters

Targeted metabolomics panel screening quantifies a curated set of metabolites with the analytical rigour required for reproducible cross-sample comparison. The defining characteristic is not what is measured, but how: each analyte is quantified against an authentic stable-isotope-labelled internal standard (SIL-IS), calibration curves are built into every batch, and acceptance criteria — intra-batch CV <15%, recovery 80–120% — are verified before data release. This transforms metabolite signal into concentration, and concentration into a defensible biological readout.

In drug discovery applications, this precision matters because the scientific question has changed. When a compound enters the pharmacodynamic confirmation stage, researchers no longer ask "what changed?" — they ask "by how much, at what dose, at what time, and with what consistency across replicates?" These are quantitative questions that targeted panels are designed to answer, and that untargeted discovery data cannot reliably address at the single-metabolite level.

Targeted panels are organised around biological logic rather than analytical convenience. A bile acid panel covers primary, secondary, conjugated, and unconjugated species because the FXR/TGR5 signalling question requires the full pool composition. A TCA cycle panel covers all eight intermediates because flux direction cannot be inferred from a single node. A purine salvage panel covers both synthesis pathway intermediates and salvage products because drug-induced redirection between routes is the mechanistic question. This pathway-anchored panel design is what distinguishes a targeted metabolomics service from a broad metabolite quantification list. For studies that extend into the cellular metabolite level during drug treatment experiments, this service complements our cellular metabolomics screening platform.

Why Targeted Panels Are the Right Tool at the Right Stage

Pharmacodynamic biomarker confirmation

After untargeted or proteomics-based MoA profiling nominates candidate biomarkers, targeted panels validate whether those markers change reliably across the compound concentration range, across biological replicates, and across model systems — the minimum evidence set for advancing a PD biomarker toward translational use.

Dose-response and time-course quantification

Understanding the concentration–response relationship for a metabolic endpoint requires absolute concentrations, not fold-changes. Targeted panels deliver the numerical data needed to fit PK/PD models, establish EC50 values at the metabolic level, and define the therapeutic window around a metabolic endpoint.

Selectivity profiling across a compound series

When structurally related compounds differ in their on-target metabolic effect, targeted panel data quantifies those differences numerically. This supports lead selection decisions grounded in metabolic selectivity data rather than indirect viability readouts.

Cross-study and cross-laboratory comparability

Programmes that span multiple time points, animal cohorts, or CRO partners need data that can be directly compared across batches. Internal standard-anchored targeted panel data carries that comparability; untargeted relative abundance data does not without substantial normalisation effort.

Service Overview — Targeted Metabolomics Panels Available

We offer eight analytically validated panels covering the metabolite classes most frequently interrogated in drug discovery, pharmacology, and preclinical research. Each panel can be run as a standalone service or combined with a second panel from the same sample — a design that captures both central energy metabolism and pathway-specific drug effects from a single sample aliquot. Custom panels built around your compound's mechanism or your specific analyte list are also accommodated; contact our team with your target analyte list and matrix to initiate panel validation. All panels are supported by the pharmaco-metabolomics framework when drug response interpretation is the primary objective.

PANEL 1

Bile Acid Panel (45 species)

Covers primary bile acids (cholic acid, chenodeoxycholic acid), secondary bile acids (deoxycholic acid, lithocholic acid, ursodeoxycholic acid), taurine-conjugated and glycine-conjugated forms, and muricholic acid isomers relevant to rodent studies.

  • Relevant to: FXR/TGR5 agonist/antagonist studies, gut microbiome–liver axis research, bariatric surgery metabolic mechanism, cholestasis safety assessment.
  • Matrix: plasma, serum, liver tissue, bile, feces, intestinal contents.
  • Quantification: MRM triple-quadrupole with deuterium-labelled SIL-IS for each conjugation class.
PANEL 2

TCA Cycle & Organic Acid Panel (28 metabolites)

Quantifies all eight TCA intermediates (citrate, isocitrate, α-ketoglutarate, succinate, fumarate, malate, oxaloacetate, acetyl-CoA proxies) plus pyruvate, lactate, and key anaplerotic substrates.

  • Relevant to: mitochondrial complex inhibitor profiling, IDH1/2 inhibitor studies, oncology metabolic reprogramming, compound-induced Warburg shift detection.
  • Matrix: cell pellets, tissue, plasma.
  • Quantification: HILIC-MRM with U-¹³C SIL-IS for key intermediates.
PANEL 3

Acylcarnitine & Fatty Acid Oxidation Panel (36 species)

Profiles short-, medium-, long-, and very-long-chain acylcarnitine species (C2–C26) plus free carnitine, providing a diagnostic readout of mitochondrial fatty acid β-oxidation flux and capacity.

  • Relevant to: drug-induced mitochondrial toxicity, FAOD compound studies, cardiac metabolism profiling, hepatotoxicity liability flagging.
  • Matrix: plasma, dried blood spots, liver tissue, cardiac tissue.
  • Quantification: UHPLC-MRM/MS with acylcarnitine-specific deuterium SIL-IS series.
PANEL 4

Amino Acid & One-Carbon Metabolism Panel (40 analytes)

Covers all 20 standard amino acids plus methionine cycle intermediates (SAM, SAH, homocysteine), folate pathway metabolites (5-methylTHF, FIGLU), and tryptophan pathway branches (kynurenine, serotonin, indole metabolites).

  • Relevant to: DNMT inhibitor studies, IDO/TDO pathway drugs, mTORC1-dependent amino acid sensing, nutritional and starvation response profiling.
  • Matrix: plasma, cell pellets, tissue, urine.
  • Quantification: HILIC-MRM with amino acid-specific ¹³C/¹⁵N SIL-IS.
PANEL 5

Nucleotide & Purine/Pyrimidine Panel (32 analytes)

Quantifies adenine and guanine nucleotides (AMP, ADP, ATP, GMP, GDP, GTP), pyrimidine nucleotides, purine salvage intermediates (hypoxanthine, xanthine, inosine), and NAD+/NADH/NADP+/NADPH redox couples.

  • Relevant to: PRPP synthetase inhibitors, purine biosynthesis pathway drugs, NAMPT inhibitor studies, IDH-mutant cell model profiling.
  • Matrix: cell pellets (ice-cold extraction essential), tissue (immediate freeze required).
  • Quantification: ion-pairing RP or HILIC-MRM; short extraction-to-injection interval critical for labile adenylate species.
PANEL 6

Eicosanoid & Lipid Mediator Panel (55 species)

Profiles prostaglandins (PGE2, PGD2, PGF2α), thromboxanes, leukotrienes (LTB4, LTC4, LTD4), hydroxyeicosatetraenoic acids (HETEs), epoxides, lipoxins, resolvins, and protectins — the full arachidonic acid and DHA/EPA-derived lipid mediator landscape.

  • Relevant to: COX/LOX inhibitor profiling, anti-inflammatory compound MoA confirmation, innate immune activation studies, NSAID selectivity assessment.
  • Matrix: plasma, bronchoalveolar lavage, cell conditioned medium, tissue.
  • Quantification: RP-MRM with deuterium-labelled prostanoid SIL-IS; samples processed immediately after collection to prevent ex vivo eicosanoid generation.
PANEL 7

Redox & Glutathione Panel (18 analytes)

Quantifies reduced glutathione (GSH), oxidised glutathione (GSSG), glutathione disulfide ratio, cysteine, homocysteine, γ-glutamylcysteine, ophthalmic acid, and markers of oxidative stress including 8-OHdG and protein carbonyl proxies.

  • Relevant to: compound-induced oxidative stress, electrophile detoxification profiling, NRF2 pathway activation studies, reactive oxygen species downstream monitoring.
  • Matrix: cell pellets, liver tissue, plasma (immediate deproteinisation at 4°C required).
  • Quantification: RP-MRM with N-ethylmaleimide derivatisation for thiol stabilisation.
PANEL 8

Custom Mechanism-Focused Panel

When your compound's mechanism points to a specific metabolic node not covered by standard panels, we build and validate a custom analyte list matched to your biological question. Custom panels include analyte selection consultation, SIL-IS sourcing, method development and validation, and full QC documentation.

  • Minimum analyte set: 8 metabolites.
  • Validation deliverable: method validation report covering linearity, accuracy, precision, matrix effects, and stability.
  • Timeline: discuss with our team based on analyte availability and matrix complexity.

Analytical Workflow

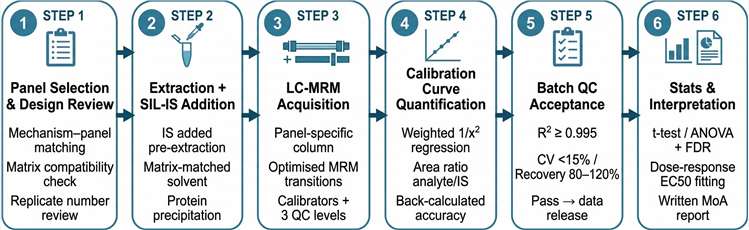
Six stages from sample receipt to validated concentration data:

1

Panel selection and experimental design review

Before extraction begins, our team reviews your compound mechanism, sample matrix, collection protocol, and replicate structure. Common design issues — insufficient replication for the statistical test planned, timing inconsistencies that introduce confounded metabolite variation, or matrix-analyte incompatibilities — are flagged and resolved before the project starts. This review is included for every panel project.

2

Matrix-matched extraction with SIL-IS addition

Stable-isotope-labelled internal standards are added to each sample at a defined concentration before extraction begins. This controls for matrix-specific ion suppression, extraction efficiency variation, and instrument drift across a run batch. Extraction solvents and precipitation conditions are matched to the analyte class: acidified acetonitrile for bile acids and eicosanoids, methanol for amino acids and organic acids, perchloric acid deproteinisation for nucleotides and redox metabolites.

3

Chromatographic separation and MRM acquisition

Extracted samples are injected onto a panel-specific LC column: C18 RP for bile acids and eicosanoids, HILIC for amino acids and nucleotides, or C8 with ion-pairing reagents for adenylates. MRM transitions are optimised for each analyte–IS pair on the triple-quadrupole platform. Each batch includes blank samples, double blank samples, calibration standards at six to eight concentration levels, and at least three QC levels (low, mid, high). Injection order is randomised with respect to study group to prevent run-order bias.

4

Quantification against calibration curve

Peak areas are extracted for each analyte and its SIL-IS; the analyte/IS area ratio is fitted to the calibration curve by weighted linear regression (1/x² weighting). Analyte concentrations are calculated from the regression equation, with back-calculated calibration standard accuracy reported for each level. For analytes without available SIL-IS, a nearest structural analogue IS is used and the resulting semi-quantitative value is flagged as such in the data table.

5

Batch QC acceptance and data release

Each batch must pass pre-defined acceptance criteria before data release: calibration curve R² ≥ 0.995, back-calculated calibration standard accuracy within ±15% (±20% at LLOQ), QC sample CV <15% within batch, and QC recovery 80–120%. Batches failing these criteria are re-extracted and re-analysed. QC results are reported as an acceptance table in the final deliverable package.

6

Statistical analysis and biological interpretation

Validated concentration data are submitted to univariate (t-test or ANOVA with post-hoc correction) and optionally multivariate (PCA, heatmap) analysis. For dose-response designs, Spearman rank correlation and EC50 fitting at the metabolic endpoint level are provided. A written interpretation report connects numerical findings to the panel's biological context — identifying which specific metabolites changed significantly, whether the pattern is consistent with known pathway logic for the compound class, and what follow-up quantification or validation is warranted.

Targeted metabolomics panel screening workflow: panel selection and design review, matrix-matched extraction with SIL-IS addition, LC-MS/MS MRM acquisition, calibration curve quantification, batch QC acceptance, statistical analysis and interpretation.

Applications Across Drug Discovery Stages

Pharmacodynamic Endpoint Quantification

Drug-induced changes in a specific metabolic pathway need to be measured with sufficient precision to define the pharmacodynamic relationship — which metabolite, at which concentration, changes by how much and when. Targeted panel data provides the absolute concentration values that PK/PD modelling requires.

Output: Concentration–response curves for key metabolic endpoints, EC50 estimates at the metabolic level, time-course profiles suitable for compartmental or empirical PD model fitting.

Enterohepatic and Gut-Liver Axis Research

Bile acid pool composition is a critical readout for FXR agonists, intestinal microbiome-modulating compounds, bariatric surgery mechanism studies, and hepatotoxicity profiling. Our bile acid panel resolves individual conjugated and unconjugated species that are invisible to total bile acid assays but biologically decisive for receptor engagement.

Output: Species-level bile acid concentrations in plasma, tissue, or fecal matrices; primary-to-secondary BA ratio; conjugated fraction profile; relevant to both in vitro and in vivo study designs. Connects directly to ADME-related studies on our ADME/DMPK/PK-PD platform.

Mitochondrial Toxicity and Energy Metabolism Profiling

Drug-induced mitochondrial liability is a leading cause of late-stage attrition. Targeted acylcarnitine panels and TCA cycle panels detect compound-induced FAO impairment or respiratory chain disruption at sub-cytotoxic concentrations, providing an early safety readout alongside the primary mechanism characterisation.

Output: Acylcarnitine species profile with chain-length diagnostic pattern; TCA intermediate concentration ratio (e.g., succinate/fumarate, α-KG/citrate) as enzyme activity surrogates; data suitable for mitochondrial risk scoring frameworks.

Immunometabolic Drug Profiling

Anti-inflammatory and immunomodulatory compounds alter metabolic programmes in immune cells — glycolytic/OXPHOS balance in macrophages, kynurenine pathway activity in immunosuppressive contexts, and eicosanoid biosynthesis in activated innate immune populations. Targeted panels capture these changes quantitatively and reproducibly across treatment conditions. Our immunometabolism MS service extends this with dedicated immune cell metabolic profiling protocols.

Output: Kynurenine/tryptophan ratio and downstream IDO pathway metabolite concentrations; eicosanoid species panel covering COX and LOX products; amino acid panel changes in activated vs. quiescent immune cell models.

Oncology Metabolic Drug Target Confirmation

Drugs targeting cancer metabolism — IDH inhibitors, PRPP synthetase inhibitors, NAMPT inhibitors, glutaminase inhibitors — produce specific, measurable metabolite changes that confirm target engagement at the metabolic level. Targeted panels built around the affected pathway deliver on-target evidence with the precision needed for preclinical candidate selection.

Output: Concentration data for the key metabolite(s) immediately upstream and downstream of the inhibited enzyme; substrate accumulation and product depletion profiles at multiple drug concentrations; cell model and matched in vivo tissue data from the same panel for cross-system comparability.

Metabolic Pathway Drug Response Confirmation

After metabolic pathway drug response profiling identifies which pathways are perturbed by a compound, targeted panels confirm the specific metabolite changes quantitatively, with the analytical rigour needed to defend the data in a programme-level decision review.

Output: Absolute concentrations for the nominated pathway metabolites across treatment groups; statistical significance and effect size at each metabolic endpoint; comparison matrix if multiple compound concentrations or analogues are being confirmed simultaneously.

Technology Comparison: Quantification Approaches for Metabolomics in Drug Research

ApproachQuantification BasisAnalyte ScopePrecision & AccuracyBest Application in Drug Research
Targeted Panel MRM (this service)Calibration curve + SIL-IS; absolute concentration in nmol/mg or µM8–60 pre-defined metabolites per panel; pathway-anchored selectionCV <15%; accuracy 80–120%; validated across batches and labsPD biomarker confirmation, dose-response quantification, cross-study comparability, regulatory-grade preclinical data packages
Untargeted LC-HRMSFeature intensity ratio (treated/control); semi-quantitative2,000–8,000 features; covers known and unknown metabolitesCV 20–40% for most features; no absolute concentrations without standardsHypothesis generation, MoA fingerprinting, novel pathway discovery. See our untargeted metabolomics MoA service.
¹³C Isotope Tracer / FluxomicsIsotopologue distribution from labelled substrate; fractional enrichment and flux estimatesConnected metabolites of the labelled precursor route (20–80 isotopologues)High within a defined pathway; no absolute pool sizes without additional quantificationMetabolic flux direction and rate through a specific pathway node. See our ¹³C fluxomics service for complementary flux validation.
Enzymatic Colorimetric / Fluorometric AssaysEnzyme reaction coupled to colorimetric or fluorescent reporter; relative or absoluteSingle metabolite per assay (e.g., lactate, ATP, NADH)High for abundant analytes; matrix interference common in complex biological samplesSingle-metabolite high-throughput screening; not suitable for multi-metabolite pathway profiling
NMR MetabolomicsChemical shift and integration against reference standard; absolute for major species~100–200 metabolites; limited to relatively abundant species (>1 µM detection)Excellent reproducibility for abundant species; insensitive to low-abundance signalling metabolitesHigh-abundance metabolite quantification in standardised biofluids; not suited for bile acids, eicosanoids, or nucleotides at physiological concentrations
LC-MS/MS Bioanalytical QuantificationGLP-grade calibration curve + SIL-IS; regulatory-grade accuracy1–5 analytes per method; compound-specificGLP CV <15%; FDA/EMA-guideline validatedDrug compound PK quantification in plasma/tissue. For drug concentration measurement, see our LC-MS/MS bioanalysis service; targeted panels cover endogenous metabolites, not drug compound quantification.

Sample Requirements by Panel

PanelPrimary MatrixMinimum AmountStorage & TransportCritical Pre-Analytical Notes
Bile Acid PanelPlasma, serum, liver tissue, feces, bilePlasma/serum: ≥ 100 µL; Tissue: ≥ 50 mg; Feces: ≥ 100 mg−80°C; ship on dry ice; heparin anticoagulant (green cap) for plasmaCollect plasma within 30 min of blood draw; fasting status must be documented; indicate anticoagulant used; bile samples must be diluted immediately to prevent auto-oxidation
TCA Cycle & Organic Acid PanelCell pellets, tissue, plasmaCells: ≥ 5 × 10⁶ per sample; Tissue: ≥ 30 mg; Plasma: ≥ 100 µLSnap-freeze within 30 s of harvest; −80°C; dry iceCell pellet must be washed 2× with ice-cold PBS before freezing; oxaloacetate and α-ketoglutarate are highly labile — avoid all room-temperature exposure after quenching; contact our team for in-dish cold methanol quenching protocol
Acylcarnitine & FAO PanelPlasma, liver/cardiac tissue, dried blood spotsPlasma: ≥ 50 µL; Tissue: ≥ 30 mg; DBS: 3–5 spots (3.2 mm punch)Plasma: EDTA tubes acceptable; −80°C; dry ice. DBS: room temperature in sealed desiccant bagHaemolysis significantly elevates short-chain acylcarnitines — avoid forceful blood collection; for DBS, allow complete drying at room temperature (4 h) before sealing
Amino Acid & One-Carbon PanelPlasma, urine, cell pellets, tissuePlasma: ≥ 50 µL; Urine: ≥ 200 µL; Cells: ≥ 1 × 10⁶; Tissue: ≥ 20 mg−80°C; dry ice; EDTA or heparin for plasma; urine: centrifuge before freezingFasting status essential for plasma amino acid profiling; document feeding status for all animal studies; for tryptophan pathway analytes, protect samples from light during collection
Nucleotide PanelCell pellets only (standard); tissue (specialist protocol)Cells: ≥ 5 × 10⁶ per sampleImmediate cold methanol quenching on plate/flask; snap-freeze; −80°C; dry iceATP degrades within seconds at room temperature post-harvest; contact our team before collection to receive the in-situ quenching protocol — DO NOT follow standard PBS-wash-freeze-pellet procedure for nucleotide samples
Eicosanoid & Lipid Mediator PanelPlasma, BAL fluid, cell conditioned medium, tissuePlasma: ≥ 500 µL; BAL: ≥ 1 mL; Conditioned medium: ≥ 2 mL; Tissue: ≥ 100 mg−80°C; dry ice; EDTA anticoagulant for plasma; add antioxidant (BHT 0.005%) to samples containing highly unsaturated speciesEicosanoids are enzymatically generated ex vivo in blood — plasma must be prepared within 15 min of blood collection; platelet activation during clotting generates TXB2 — serum is therefore not suitable for thromboxane measurement
Redox & Glutathione PanelCell pellets, liver tissue, plasmaCells: ≥ 2 × 10⁶; Tissue: ≥ 20 mg; Plasma: ≥ 100 µLImmediate deproteinisation at 4°C with NEM or SSA; −80°C; dry iceGSH oxidises to GSSG within minutes at room temperature — samples must be deproteinised immediately; contact our team for the NEM-derivatisation protocol before sample collection; EDTA anticoagulant only for plasma
Custom PanelAs defined by analyte list and matrixDiscuss with technical team−80°C; dry ice; indicate matrix (Matrigel or equivalent) in advanceMatrix-matched controls required; see our organoid metabolomics service for matrix-specific extraction protocols.

Biological replicates: minimum 5 per group for all targeted panel studies (≥6 recommended for in vivo studies). Fewer than 4 replicates per group preclude meaningful univariate statistics on concentration data and will be flagged in the design review. All panels require a matched vehicle control group processed identically to the treatment group. For bioanalytical quantification of the drug compound itself alongside metabolite panels, see our LC-MS/MS bioanalysis service.

Deliverables

  • Validated concentration data table: analyte name, concentration per sample (with unit), SIL-IS used, LLOQ, and semi-quantitative flag where applicable
  • Batch QC acceptance report: calibration curve R², back-calculated standard accuracy per level, QC recovery and CV at three concentration levels
  • Statistical analysis results: group means ± SD, t-test or ANOVA p-values (FDR-corrected for multi-analyte panels), effect sizes, and significance annotations
  • Dose-response curves and EC50 estimates at metabolic endpoints (where applicable)
  • Annotated data visualisations: box plots or bar charts per analyte, heatmap of all analytes across treatment groups, pathway diagram with analyte concentration overlaid
  • Method summary: chromatographic conditions, MRM transitions used, IS species per analyte, extraction procedure, calibration range, and QC acceptance criteria
  • Written interpretation report: identification of significantly changed analytes, pathway-level interpretation, comparison to expected mechanistic pattern for the compound class, and recommended next steps
  • Raw data files: peak area files, calibration curve fits, and processed data tables in Excel format

For programmes requiring integration of targeted metabolomics concentration data with proteomics or untargeted omics datasets from the same study, our multi-omics integration service supports cross-layer data reconciliation and joint pathway analysis.

Representative Results

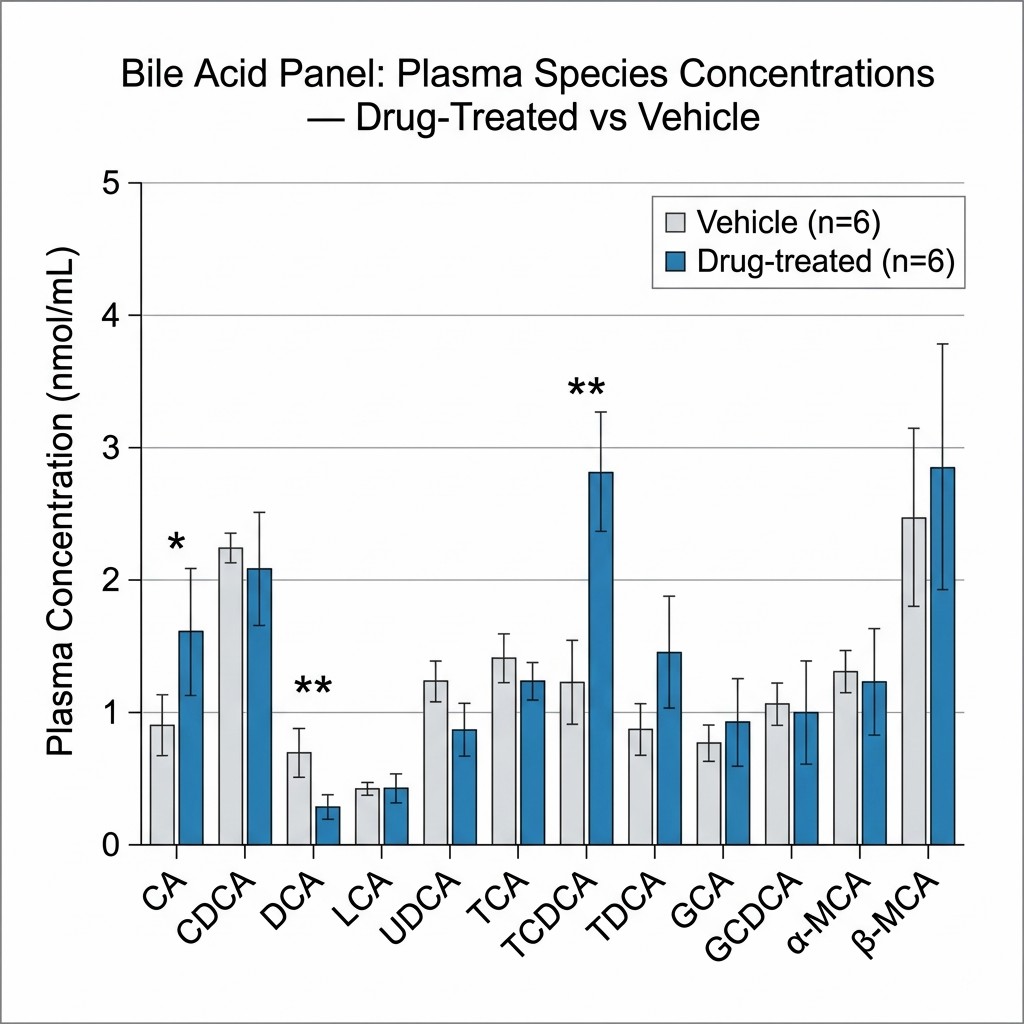
Bile acid panel targeted metabolomics bar chart showing individual species concentrations in nmol/mL across drug-treated and vehicle control groups, with error bars representing SD and significance asterisks above bars for each bile acid species.

Bile acid panel: species-level concentration across treatment groups

Individual bile acid species concentrations (nmol/mL plasma) in drug-treated versus vehicle control groups (n=6/group, means ± SD). Primary conjugated (TCDCA, GCDCA), secondary (DCA, LCA), and muricholic acid species shown separately. Significant changes between groups marked (* p<0.05, ** p<0.01, ANOVA with Tukey post-hoc).

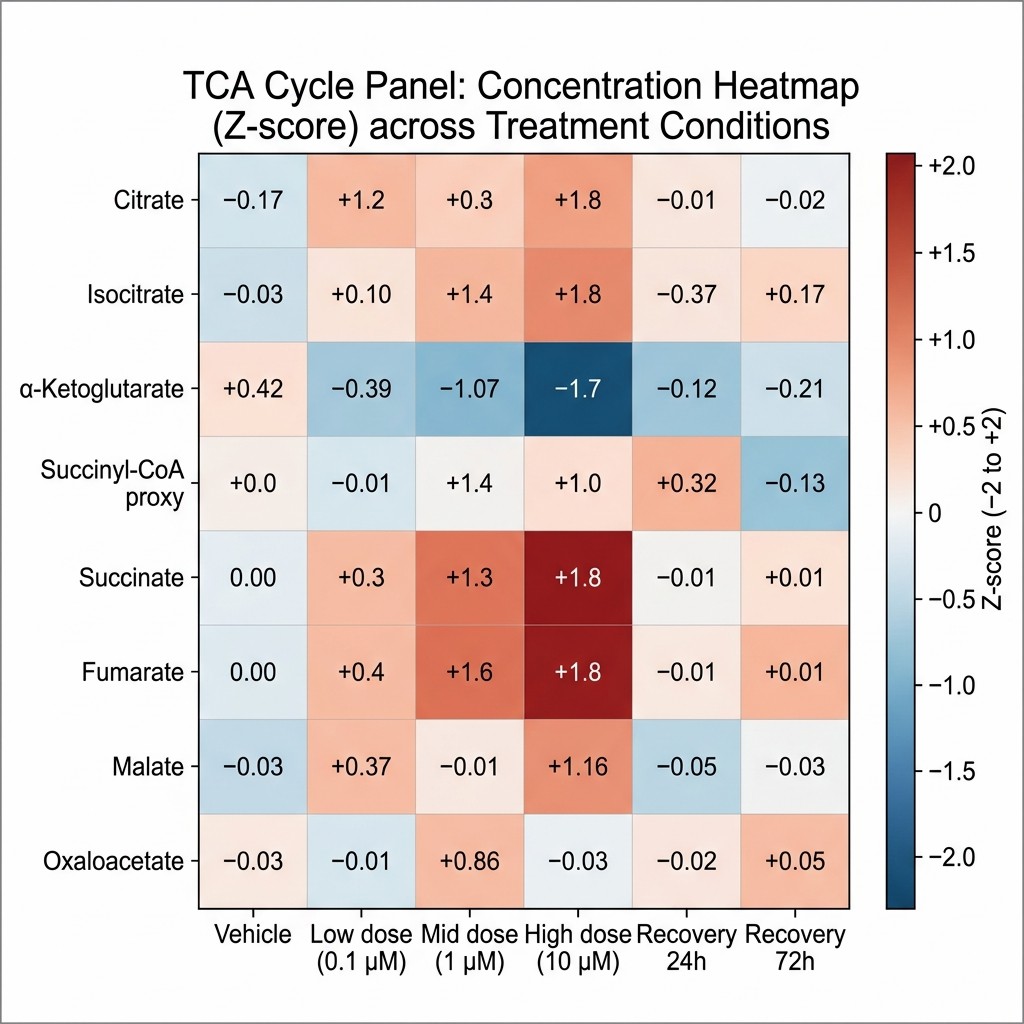
TCA cycle metabolite concentration heatmap from targeted metabolomics panel across six treatment conditions, showing individual TCA intermediates on y-axis, treatment groups on x-axis, Z-scored concentrations colour-coded blue to red, with significant changes annotated.

TCA cycle panel: concentration heatmap across treatment conditions

Z-scored concentrations of eight TCA cycle intermediates across six treatment conditions (vehicle, low dose, mid dose, high dose, recovery 24h, recovery 72h). Colour gradient: blue (below group mean) to red (above group mean). Succinate and fumarate accumulation at high dose consistent with complex II perturbation.

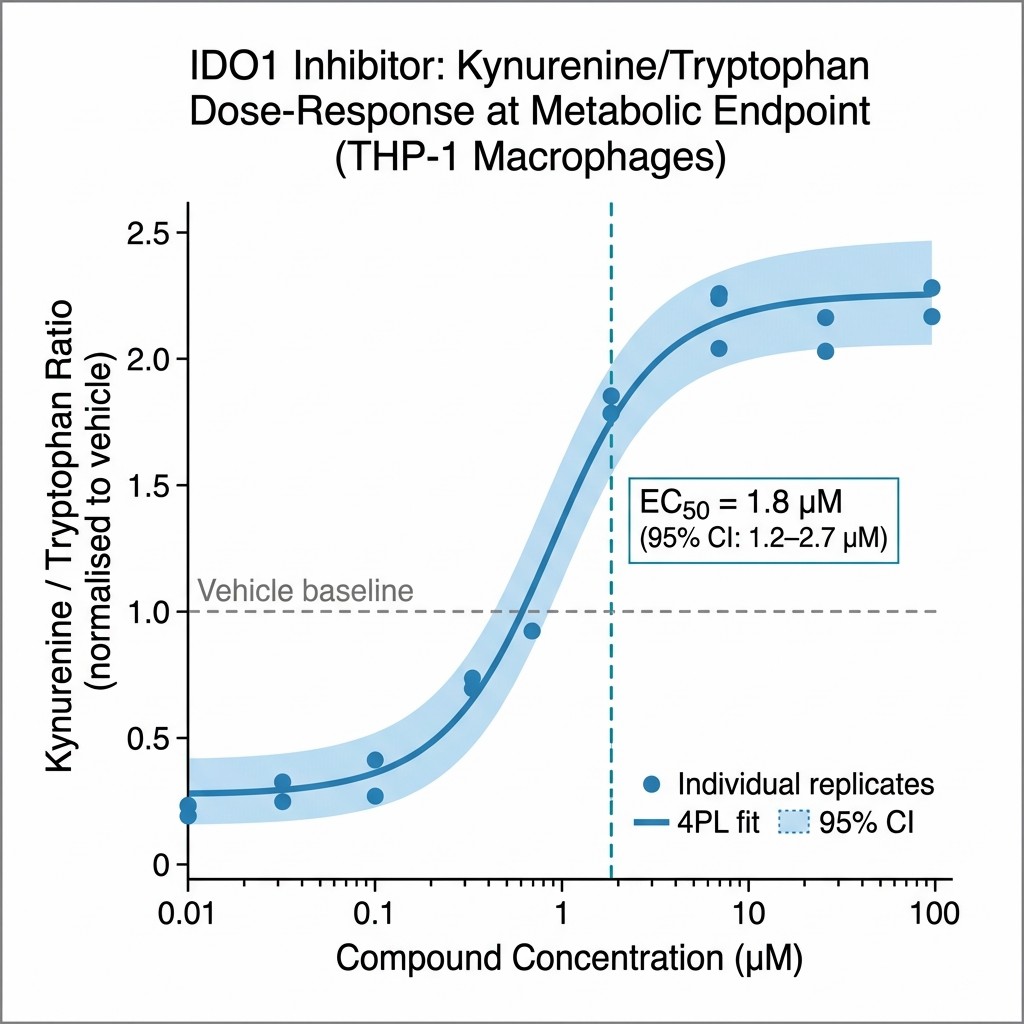
Dose-response curve from targeted amino acid panel showing kynurenine-to-tryptophan ratio on y-axis versus compound concentration on x-axis in µM, with EC50 annotation and 95% confidence interval band, individual data points shown as scatter overlay.

Amino acid panel: dose-response curve at metabolic endpoint

Kynurenine/tryptophan ratio versus compound concentration (0.01–100 µM) from targeted amino acid panel in THP-1 macrophages (n=6/concentration). EC50 = 1.8 µM (95% CI: 1.2–2.7 µM) at the metabolic endpoint, providing PD relationship data for IDO1 inhibitor dose selection in subsequent animal studies.

Case Study: Targeted Bile Acid Panel Decodes Gut Microbiome–Liver Axis Following Sleeve Gastrectomy

Hamamah S., Amin A., Ievoli C., et al. "Gut Microbiome and Bile Acid Changes after Male Rodent Sleeve Gastrectomy: What Comes First?" American Journal of Physiology — Regulatory, Integrative and Comparative Physiology (2025). https://doi.org/10.1152/ajpregu.00297.2024

Research Question

Sleeve gastrectomy (SG) produces metabolic benefits — including reduced weight gain, improved glucose homeostasis, and altered lipid metabolism — that cannot be attributed to caloric restriction alone. The mechanistic sequence linking SG to these outcomes involves both the gut microbiome and the hepatic bile acid (BA) synthetic programme, but the causal directionality had not been established: does SG first alter the microbiome, which then expands the BA pool, or does hepatic BA synthesis change independently of microbiome remodelling? Resolving this required quantitative measurement of individual bile acid species across biological compartments — a question that total BA assays cannot answer.

Methods

Male C57BL/6J mice underwent sleeve gastrectomy or sham surgery. Fecal material transfer (FMT) experiments were conducted from SG or sham donors to surgically naïve recipients with an intact microbiome, separating microbiome-dependent from surgery-direct effects on the BA pool. Creative Proteomics provided bile acid mass spectrometry and quantitative analysis — a targeted metabolomics panel approach measuring individual conjugated and unconjugated bile acid species in plasma and relevant tissue compartments. Gut microbiome composition was characterised by 16S rRNA amplicon and metagenomic sequencing. Hepatic expression of key BA synthesis and transport genes (slc10a1, cyp8b1) was quantified by qPCR.

Key Findings

SG significantly deflected weight gain compared with sham surgery: 5 ± 2 g versus 10 ± 3 g at the study endpoint (p = 0.004). The targeted bile acid panel demonstrated that SG significantly increased the total BA pool. Hepatic transcription of slc10a1 — the sodium-taurocholate cotransporting polypeptide responsible for BA reuptake from portal circulation — was reduced after SG (p = 0.04), as was cyp8b1 (p = 0.03), the enzyme controlling the ratio of cholic acid to chenodeoxycholic acid-derived species in the primary BA pool. Random forest analysis of the metagenomic dataset identified Lactobacillus as among the taxa with significantly increased relative abundance in SG versus sham mice. Critically, FMT from SG donors to naïve recipients reproduced elements of the BA pool expansion, supporting a causal role for microbiome remodelling in the BA response — but the hepatic gene expression changes preceded microbiome-dependent effects, suggesting SG initiates BA pool expansion through a direct liver mechanism before the microbiome adapts.

Significance for Targeted Metabolomics Panel Services

This study demonstrates why species-level targeted BA quantification is essential for mechanistic studies involving the gut–liver axis. Total bile acid measurements would have confirmed that the BA pool increased after SG but could not have resolved whether the increase was in primary or secondary species, conjugated or unconjugated forms, or which specific enzymatic steps (cyp8b1, slc10a1) were responsible. The targeted panel data provided the molecular resolution that connected hepatic gene expression changes to specific BA species shifts — mechanistic evidence that informed the causal sequence between surgery, liver enzyme activity, and microbiome adaptation. This precision is what targeted panel screening delivers across any metabolic pathway interrogated in drug discovery or pharmacological mechanism research.

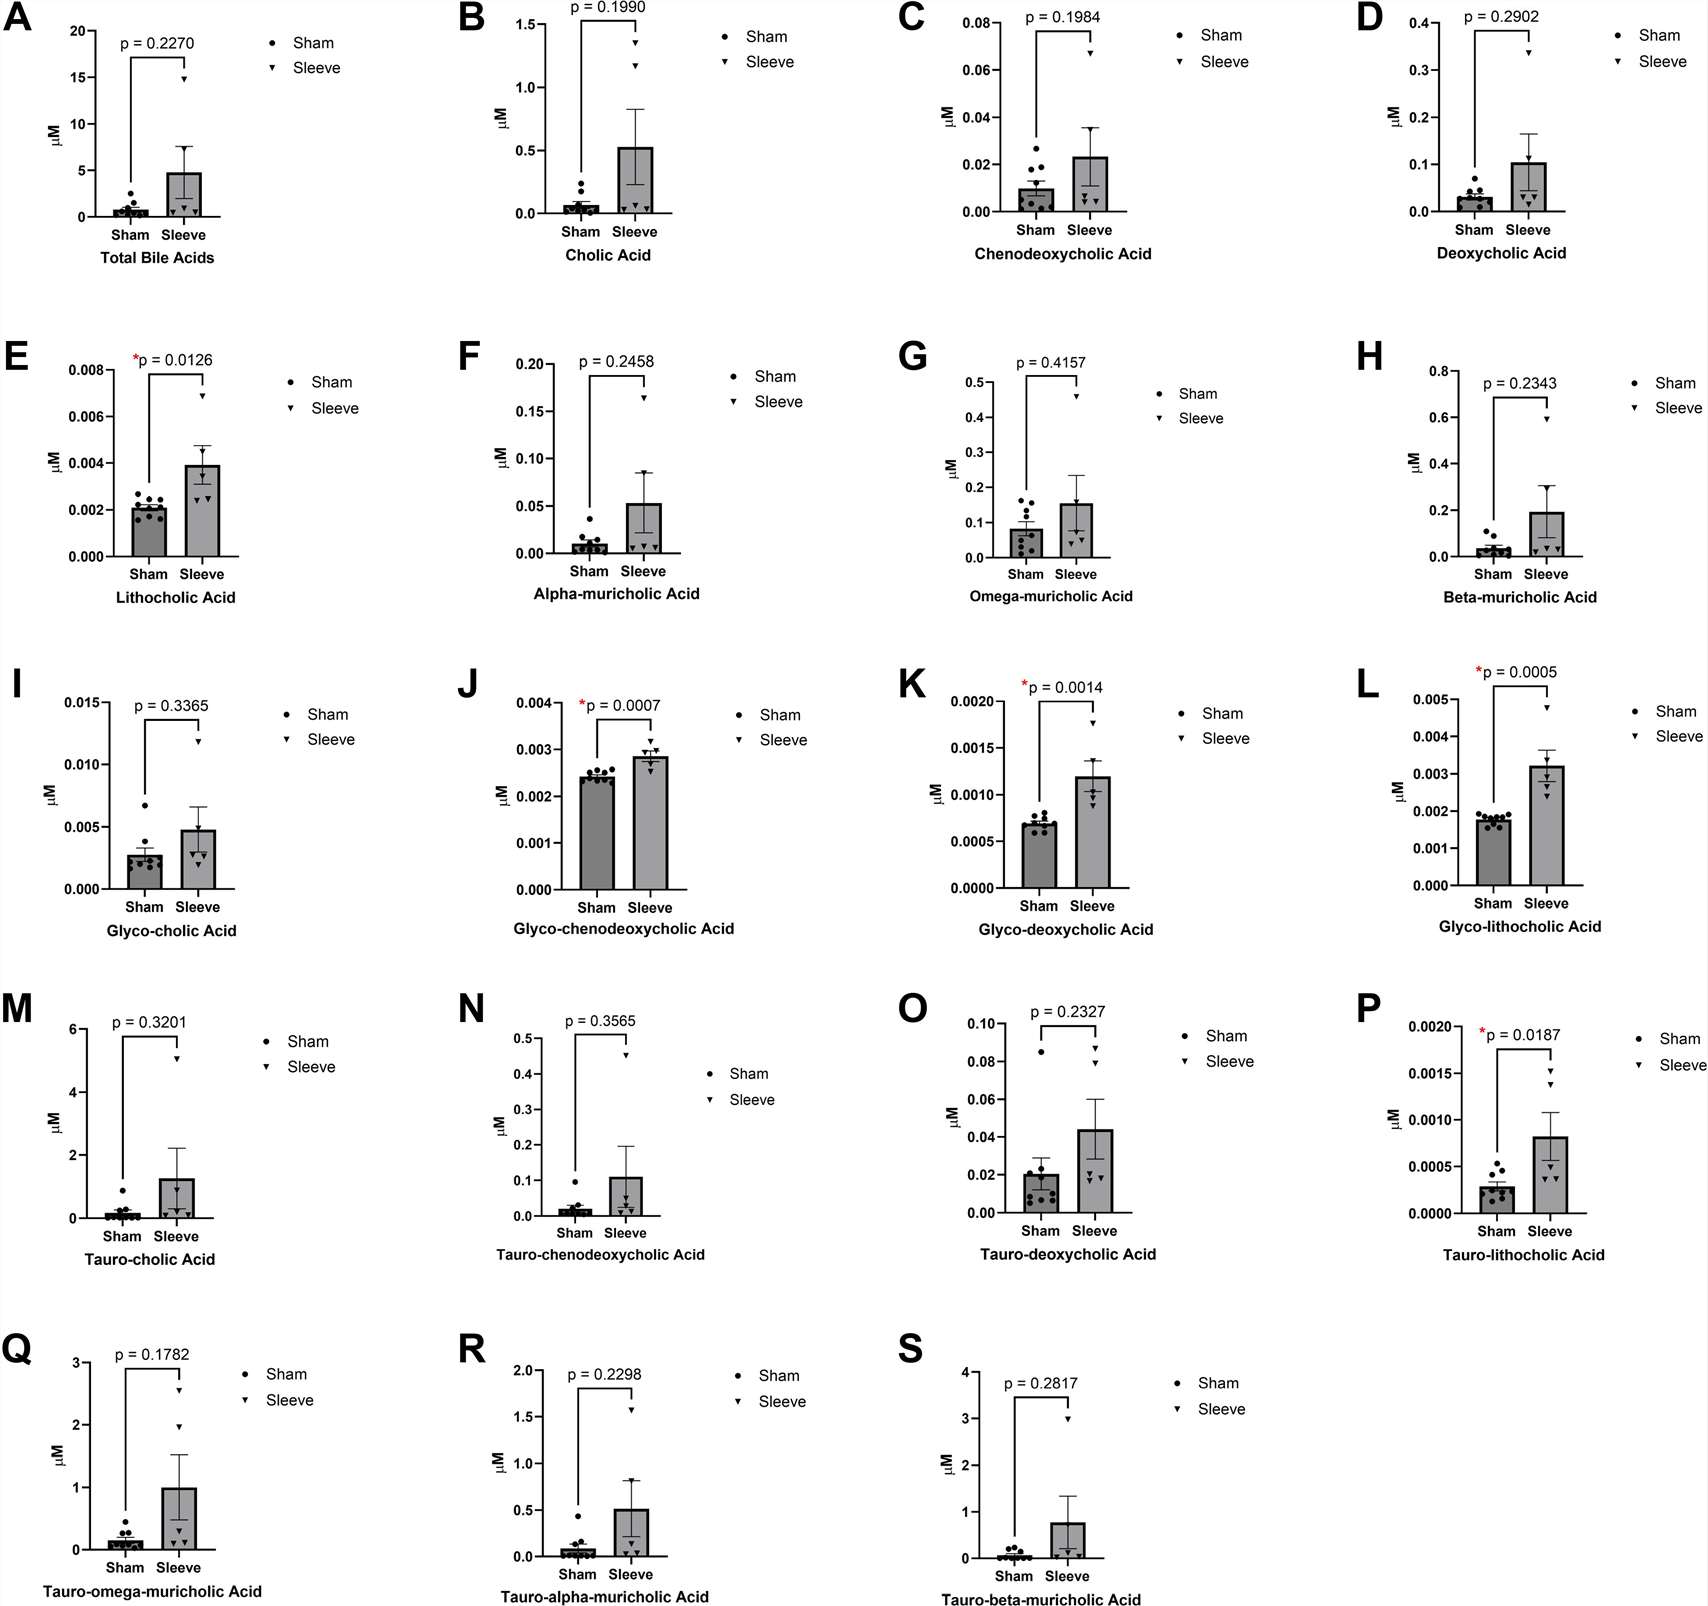
Figure from Hamamah et al. 2025, AJP-RICI, showing targeted bile acid panel quantification data from sleeve gastrectomy versus sham surgery mice, illustrating species-level changes in bile acid pool composition measured by Creative Proteomics LC-MS/MS targeted metabolomics.

Figure from Hamamah et al. 2025 (Am. J. Physiol., DOI: 10.1152/ajpregu.00297.2024). Targeted bile acid panel data from sleeve gastrectomy versus sham surgery study. Creative Proteomics provided bile acid mass spectrometry and quantitative analysis.

FAQ

Frequently Asked Questions

Q: How do I decide between a targeted metabolomics panel and untargeted metabolomics for my drug study?

The decision turns on whether you already have a mechanistic hypothesis. If your compound's biological target or affected pathway is unknown and you need to discover which metabolic routes are involved, untargeted metabolomics is the right starting point — it covers the full metabolome without a predefined analyte list. Once untargeted data (or proteomics, or published literature) has nominated specific metabolite markers or pathways, a targeted panel delivers those markers with the absolute quantification, validated accuracy, and inter-study comparability that confirmation and PD endpoint studies require. Many programmes use both in sequence: untargeted first for pathway discovery, then a custom targeted panel for quantitative confirmation. For earlier-stage discovery, our untargeted metabolomics MoA service is designed for that hypothesis-generation phase.

Q: What does "absolute quantification" mean in practice, and why does it matter for drug research?

Absolute quantification means that each metabolite concentration is expressed in real units — nanomoles per millilitre of plasma, picomoles per milligram of tissue, or nanomoles per million cells — rather than as a ratio or normalised intensity. This matters for drug research in three specific ways. First, it enables direct comparison across different sample batches, time points, and study sites — essential for multi-cohort PD studies. Second, it supports PK/PD modelling, which requires numerical concentration values rather than fold-changes. Third, it allows comparison against published reference ranges or clinical thresholds. Untargeted metabolomics can tell you that succinate increased 3.2-fold after compound treatment; targeted quantification tells you it increased from 12 to 38 µM — the latter is what a programme decision review or safety assessment framework requires.

Q: Can targeted panels be run on the same sample extract used for proteomics or untargeted metabolomics?

In some cases, yes — particularly when the sample matrix is a cell pellet or tissue that has been extracted in a solvent compatible with both assay types. However, the extraction conditions optimised for targeted panel analytes (e.g., acidified acetonitrile for bile acids, perchloric acid deproteinisation for nucleotides) are often incompatible with protein-level analysis from the same aliquot. Standard practice is to divide the sample into separate aliquots at the point of collection, with each aliquot allocated to its appropriate extraction protocol. Our team can advise on sample splitting volumes and collection procedures when designing a multi-assay study. For coordinating metabolomics and proteomics data from the same study, our pharmaco-proteomics service and targeted panel service can be run in parallel with a shared sample plan.

Q: What is a stable-isotope-labelled internal standard (SIL-IS), and does every analyte have one?

A stable-isotope-labelled internal standard is a chemically identical version of the analyte where specific atoms (commonly ¹³C, ²H, or ¹⁵N) are replaced with heavier stable isotopes. Because the labelled molecule is chemically indistinguishable from the endogenous analyte but separable by mass, it controls for every source of variability introduced after it is added to the sample — extraction efficiency, ion suppression, instrument response drift. For quantification-critical analytes, we source dedicated SIL-IS. Where no dedicated SIL-IS is commercially available, we use the nearest structural analogue as a surrogate IS and flag the resulting data as semi-quantitative with a defined accuracy range. Full IS coverage per analyte is documented in the method summary delivered with every dataset. For studies requiring absolute quantification with regulatory-grade accuracy for the drug compound itself, see our LC-MS/MS bioanalysis service, which operates under GLP-grade method validation.

Q: How many biological replicates do targeted metabolomics panel studies require?

We recommend a minimum of five biological replicates per treatment group for targeted panel studies. The minimum is higher than for untargeted metabolomics because targeted data is used for statistical inference at the individual metabolite level, rather than at the level of a feature set. With five replicates per group, t-tests can detect effect sizes of approximately 1.5 standard deviations with 80% power at α = 0.05. For in vivo studies with high biological variability (e.g., human patient samples, dietary intervention studies), six to eight replicates per group are advisable. For dose-response designs, three to four replicates per concentration level is acceptable when at least five concentrations are included. These power considerations should be factored into study design before animals are allocated or patient recruitment begins — our team can assist with power calculation for specific panel analytes based on published or pilot CV data.

Q: How do I confirm which metabolites should be included in a custom panel for my compound?

Custom panel design starts from the compound's known or proposed mechanism. We review the primary target's known substrates and products, the downstream pathway architecture, the metabolites most likely to accumulate (upstream of the inhibited step) or deplete (downstream), and any published literature on metabolite markers for the relevant enzyme family or pathway. We also screen for available SIL-IS for each candidate analyte and confirm that expected physiological concentrations fall within the practical LLOQ of the MRM method. For metabolite identification confirmation upstream of panel design — particularly for novel compounds where the perturbed metabolites are inferred from untargeted data rather than established biochemistry — our metabolite identification service provides MS2-based structural confirmation before analytes are committed to a validated targeted method.

References

  1. Hamamah S., Amin A., Ievoli C., et al. Gut microbiome and bile acid changes after male rodent sleeve gastrectomy: what comes first? Am J Physiol Regul Integr Comp Physiol. 2025.
  2. Nguyen H.T. Advancements in mass spectrometry-based targeted metabolomics and lipidomics: implications for clinical research. Molecules. 2024;29(24):5934.
  3. Lynn K.S., Tang H.Y., Lo C.J., et al. MRMQuant: automated MRM data quantitation for large-scale targeted metabolomics analysis. Anal Chem. 2024;96(33):13625–13635.
  4. Xu T., Pan L., Ge C., et al. Metabolomics-driven approaches for identifying therapeutic targets in drug discovery. MedComm. 2024;5(11):e792.

Design your targeted metabolomics panel study with the MassTarget™ team

Tell us your compound, your mechanism hypothesis, and your sample matrix — we'll recommend the right panel, flag any pre-analytical considerations specific to your analyte class, and confirm SIL-IS coverage before your study begins.

For Research Use Only (RUO). Not intended for diagnostic, therapeutic, or clinical decision-making purposes. Creative Proteomics services are designed to support preclinical research, drug discovery, and mechanism of action studies only.

Online Inquiry

Please submit a detailed description of your project. We will provide you with a customized project plan to meet your research requests. You can also send emails directly to for inquiries.

* Email
Phone
* Service & Products of Interest
Services Required and Project Description