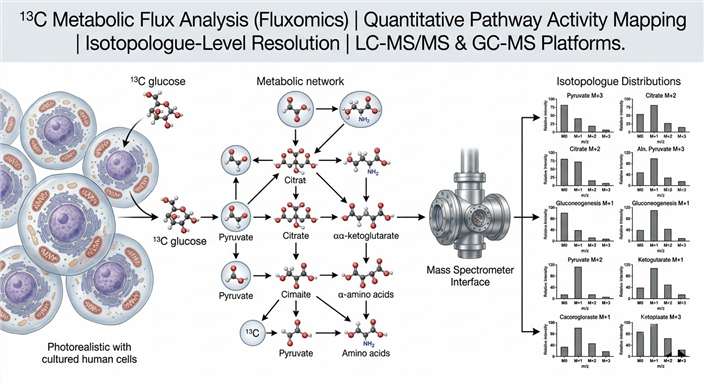
13C Metabolic Flux Analysis (Fluxomics) Service — Quantitative Pathway Activity Mapping for Drug Discovery

Move beyond static metabolite abundance. Quantify intracellular carbon flow through central metabolism with 13C tracer-based fluxomics, powered by high-resolution LC-MS/MS and GC-MS platforms.

13C metabolic flux analysis (13C-MFA) resolves a critical blind spot in conventional metabolomics: metabolite pool size cannot distinguish increased synthesis from decreased consumption. By tracing stable isotope-labeled carbon from a defined substrate through downstream metabolites, we quantify the actual rate of carbon flow through each pathway branch — giving drug discovery teams mechanistic data that abundance measurements alone cannot provide.

At Creative Proteomics, our end-to-end fluxomics service covers experimental design, tracer selection, LC-MS/MS and GC-MS data acquisition, isotopologue analysis, and quantitative flux modeling, supporting applications from cancer metabolism research to bioprocess optimization.
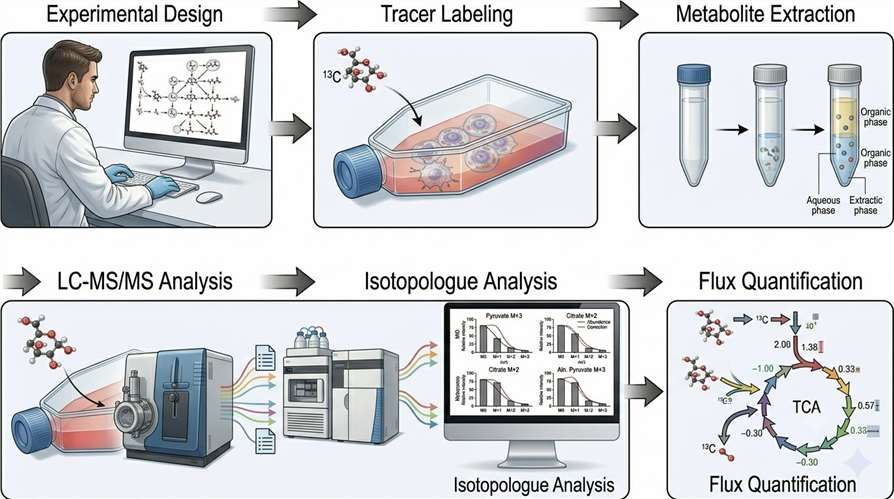
<sup>13</sup>C metabolic flux analysis workflow from tracer labeling through LC-MS/MS detection to flux map visualization
What Is 13C-MFA Why Flux Over Abundance Tracer Strategy Pathways Workflow Platform Sample Case Study FAQ

What Is 13C Metabolic Flux Analysis (13C-MFA)?

13C-MFA is a quantitative technique that measures intracellular metabolic fluxes — the rates at which carbon moves through individual enzymatic reactions and pathway networks. Cells are cultured with a 13C-labeled substrate (typically [U-13C]-glucose, [U-13C]-glutamine, or [U-13C]-palmitate), which is incorporated into downstream metabolites. The resulting mass isotopomer distributions (MIDs) are measured by LC-MS/MS or GC-MS and fitted to a metabolic network model to compute absolute or relative flux values.

Unlike flux balance analysis (FBA), which predicts optimal flux distributions under steady-state constraints, 13C-MFA provides experimentally measured fluxes resolved at the pathway and branch-point level. This makes it the gold-standard approach for quantifying central carbon metabolism, including glycolysis, the TCA cycle, the pentose phosphate pathway (PPP), and anaplerotic reactions.

Why Measure Flux Instead of Metabolite Abundance?

Resolve ambiguous biology

A metabolite that accumulates under drug treatment could reflect increased synthesis or blocked consumption — two opposite mechanisms with identical metabolomic readouts. 13C-MFA disambiguates these scenarios by tracking label incorporation rather than pool size.

Quantify pathway activity, not just endpoints

Standard metabolomics reports what is present; 13C-MFA reports how fast carbon moves through each pathway branch. This distinction is critical for evaluating whether a drug candidate truly suppresses glycolytic flux or merely alters lactate export kinetics.

Detect metabolic rewiring

Cells compensate for pathway inhibition by redirecting flux through alternative routes. 13C-MFA captures these compensatory shifts — such as increased glutamine anaplerosis when glycolysis is impaired — that static metabolite panels miss entirely.

Generate actionable flux maps

Our deliverable includes quantitative flux maps with confidence intervals, enabling you to prioritize metabolic nodes for target validation or identify the most active pathway branches for bioprocess engineering.

Tracer Options and Labeling Strategy Design

GLUCOSE TRACERS

[U-13C]-Glucose and [1,2-13C]-Glucose

  • Glycolysis, TCA cycle, PPP, serine synthesis, hexosamine pathway.
  • [1,2-13C]-glucose specifically resolves oxidative vs non-oxidative PPP branching.
GLUTAMINE TRACERS

[U-13C]-Glutamine

  • Glutaminolysis, TCA cycle anaplerosis, reductive carboxylation (IDH-mutant).
  • Preferred tracer for studies of glutamine dependency and mitochondrial metabolism.
FATTY ACID TRACERS

[U-13C]-Palmitate / Oleate

  • β-oxidation flux, TCA entry via acetyl-CoA, ketogenesis.
  • Assess metabolic flexibility and fatty acid dependency in cancer or metabolic disease models.
DUAL-TRACER

Simultaneous 13C-Glucose + 13C-Glutamine

  • Comprehensive central metabolism profiling in a single experiment.
  • Resolves interactions between glycolytic and glutaminolytic flux simultaneously.

Recommendations: 6 biological replicates per condition; time-course sampling (0, 1, 2, 4, 8, 24 h) for dynamic flux; labeling plateau verification for isotopic steady state. Custom tracers (13C-ethanol, 13C-acetate, 15N-glutamine) are available upon consultation.

Pathways Covered

Our fluxomics panel covers over 30 metabolic pathways, from central carbon metabolism to specialized biosynthesis routes.

Pathway CategoryPathways IncludedKey Metabolites / Readouts
Glycolysis / GluconeogenesisEMP pathway, lactate fermentationGlucose-6P, Fructose-6P, PEP, Pyruvate, Lactate
Pentose Phosphate PathwayOxidative & non-oxidative PPP6PG, Ru5P, Ribulose-5P, Sedoheptulose-7P
TCA CycleCitrate cycle, anaplerosisCitrate, α-KG, Succinate, Fumarate, Malate
Glutamine MetabolismGlutaminolysis, reductive carboxylationGlutamine, Glutamate, α-KG, Aspartate
Serine / Glycine / One-CarbonSerine synthesis, SHMT, folate cycleSerine, Glycine, Methionine, SAM, SAH
Fatty Acid & Lipid Metabolismβ-oxidation, lipogenesis, ketogenesisPalmitate, Oleate, β-OHB, Acylcarnitines
Nucleotide MetabolismPurine & pyrimidine synthesisIMP, UMP, Ribonucleotides
NADPH / Redox MetabolismMalic enzyme, G6PD, IDHNADPH/NADP+ ratio, GSH/GSSG

Workflow — From Tracer Infusion to Flux Map

1

Experimental Design Consultation

Biological question review, tracer selection, replicate strategy definition.

2

Cell Culture & Tracer Labeling

Culturing with 13C-labeled substrate; parallel 12C controls for correction.

3

Metabolite Extraction

Validated biphasic solvent extraction; derivatization for GC-MS.

4

LC-MS/MS & GC-MS Acquisition

Orbitrap / QTRAP targeted MRM for 200+ metabolite MIDs per run.

5

Isotopologue Analysis & Correction

MID correction for natural abundance, tracer purity, derivatization.

6

Flux Quantification & Reporting

INCA / 13CFLUX2 modeling, flux maps with 90% CI, publication-ready figures.

Six-step fluxomics workflow from experimental design through flux quantification

Platform Instrumentation

InstrumentConfigurationApplication
Orbitrap ID-XTribrid HRMS, HILIC + RP LCUntargeted + targeted isotopologue profiling, high-resolution MID measurement
Q Exactive HFQuadrupole-Orbitrap, 120,000 FWHMHigh-resolution targeted fluxomics, full-scan MID acquisition
QTRAP 6500+Triple quad with linear ion trap, MRMTargeted MRM-based flux quantification, high-sensitivity MID detection
Agilent 7890B GC-MSEI, CI modes with FIDSugar-phosphate isotopologue profiling, amino acid derivatization
ACQUITY UPLC I-ClassBinary HILIC + RP systemsPolar metabolite separation, lipid class separation

Sample Requirements

Sample TypeRecommended AmountMinimum Amount
Adherent cells (6-well)2–5 × 10⁶ cells1 × 106 cells
Suspension cells5 × 106 cells2 × 106 cells
Tissue (biopsy)50–100 mg20 mg
Microbial pellets5–10 OD units2 OD units

Deliverables

  • Mass isotopomer distribution (MID) tables corrected for natural abundance and tracer purity
  • Quantitative flux maps with 90% confidence intervals (INCA / 13CFLUX2 / OpenFLUX)
  • PCA/PLS-DA scores plots, volcano plots, isotopologue enrichment heatmaps
  • Pairwise differential flux analysis with FDR correction
  • Pathway enrichment overlay on KEGG pathway diagrams
  • Raw MS data (.RAW / .wiff) with instrument methods and processing parameters
  • Full methods report: experimental details, tracer specifications, correction algorithms, modeling assumptions

Experimental Design Consultation

Our team provides dedicated consultation on: tracer selection (positional vs uniform labeling), labeling time and plateau verification, replicate strategy (minimum 5–6 per group), control design (unlabeled parallel cultures), quenching and extraction protocols, and sample stability. For researchers integrating fluxomics with other omics layers, we coordinate sample splitting workflows so that proteomics, metabolomics, or lipidomics data can be generated from the same biological specimens through our multi-omics integration service.

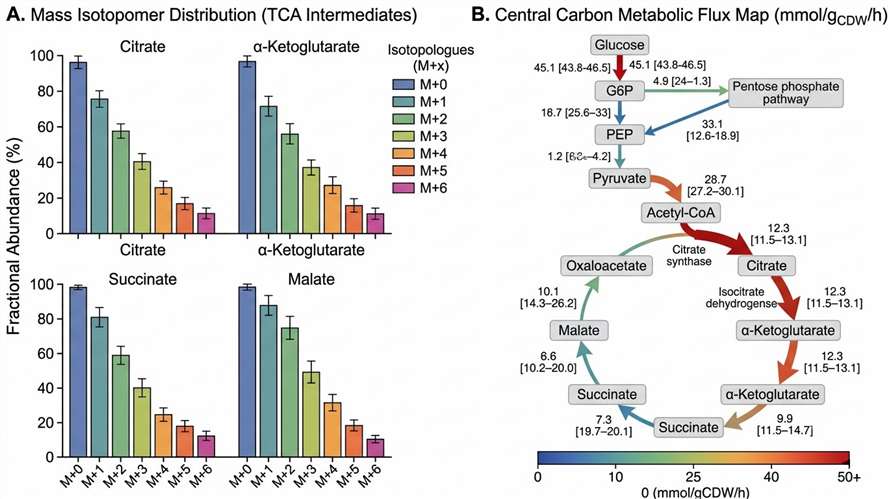
Representative Fluxomics Data

Representative <sup>13</sup>C fluxomics data showing mass isotopomer distribution bar chart and flux maps

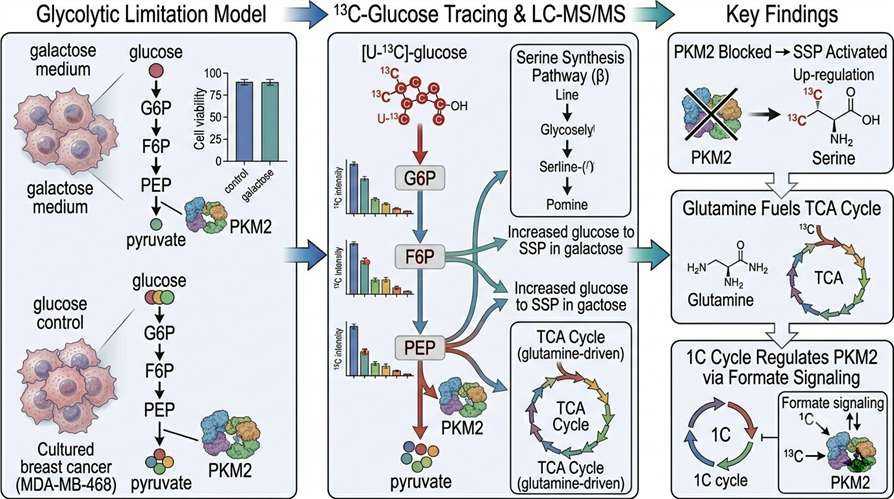
Case Study — 13C-Glucose Tracing Reveals PKM2-Dependent Glycolytic Rewiring in Cancer Cells

Benzarti M., Neises L., Oudin A., et al. "PKM2 diverts glycolytic flux in dependence on mitochondrial one-carbon cycle." Cell Reports 43(3), 2024. https://doi.org/10.1016/j.celrep.2024.113868 (CC BY 4.0)

Background

PKM2 catalyzes the final step of glycolysis and is regulated in response to nutrient availability. The authors investigated how PKM2 activity is modulated under glycolytic limitation — a condition relevant to the nutrient-scarce tumor microenvironment.

Methods

MDA-MB-468 and U87 glioblastoma cells were cultured in galactose-containing medium to model glycolytic limitation. [U-13C]-glucose tracing was performed for 24 h, followed by LC-MS/MS-based isotopologue analysis of glycolytic, TCA cycle, and serine pathway intermediates. Mitochondrial one-carbon cycle activity was modulated by SHMT2 deletion and formate supplementation.

Results

Under glycolytic limitation, PKM2 activity was almost completely blocked, diverting glycolytic carbon upstream of pyruvate toward the serine synthesis pathway. Glutamine emerged as the primary TCA cycle fuel, with ME1-mediated malate decarboxylation supporting NADPH production. Deletion of the mitochondrial one-carbon cycle reversed the PKM2 block, revealing a formate-dependent signaling axis that coordinates mitochondrial one-carbon flux with cytosolic PKM2 activity.

Conclusions

The study demonstrated that cancer cells employ a nutrient-responsive mechanism to reprogram glycolytic flux, prioritizing serine synthesis when glucose availability is limited. 13C-MFA was essential for uncovering these non-obvious metabolic regulatory circuits that static metabolomics alone cannot resolve.

Research workflow diagram illustrating the PKM2-dependent glycolytic rewiring study design

Overview of the multi-omics study design combining 13C-glucose tracing with LC-MS/MS isotopologue analysis.

FAQ

Frequently Asked Questions

Q: What is the difference between 13C-MFA and standard metabolomics?

Standard metabolomics measures static metabolite pool sizes. 13C-MFA measures the rate of carbon flow through each pathway by tracking incorporation of a 13C-labeled tracer into downstream metabolites. Two conditions with identical metabolite levels can have completely different flux distributions.

Q: Which tracer should I use for my experiment?

[U-13C]-glucose is the standard for central carbon metabolism. For glutamine-dependent pathways (e.g., TCA anaplerosis in hypoxic conditions), [U-13C]-glutamine is more appropriate. Dual-tracer experiments combining glucose and glutamine tracers are available for comprehensive coverage.

Q: How many biological replicates are needed for robust flux estimation?

We recommend 6 biological replicates per group for robust flux estimation with narrow confidence intervals. 3–4 replicates may be acceptable for pilot studies, but confidence intervals on estimated flux values will be wider.

Q: Can you work with limited sample amounts (fewer than 1 × 10⁶ cells)?

Our QTRAP 6500+ MRM methods achieve sensitive detection from as few as 1 × 10⁶ cells. Below this threshold, flux confidence may be reduced, but we can discuss options during the experimental design consultation.

Q: Do you provide in vivo fluxomics support?

We provide ex vivo analysis of samples from in vivo 13C infusion studies. The tracer infusion must be performed by the client; we handle sample processing, MS acquisition, and flux modeling. Tissue-specific flux analysis is supported from appropriately preserved specimens.

Q: Can I integrate fluxomics data with proteomics or transcriptomics data?

Yes. When samples are pre-split appropriately, we can generate matched fluxomics and proteomics data from the same biological specimens to enable pathway-level correlation analysis across multiple omic layers.

Q: What is natural abundance correction and why is it important?

Without correction, measured MIDs include 13C atoms incorporated at natural abundance (1.1% per carbon) rather than from the experimental tracer. We apply validated correction algorithms — including correction for tracer isotopic purity — to ensure that reported MIDs reflect only label incorporation from the administered tracer.

Q: Do you offer isotopic non-stationary MFA (INST-MFA)?

Yes. For systems that do not reach isotopic steady state — including plant metabolism, certain microbial cultures, and in vivo tracer studies — we support INST-MFA using time-course MID fitting and cumomer/EMU-based modeling frameworks.

References

  1. Benzarti M., Neises L., Oudin A., et al. "PKM2 diverts glycolytic flux in dependence on mitochondrial one-carbon cycle." Cell Reports 43(3), 113868 (2024). https://doi.org/10.1016/j.celrep.2024.113868
  2. Antoniewicz M.R. "A guide to 13C metabolic flux analysis for the cancer biologist." Exp. Mol. Med. 50, 19 (2018). https://doi.org/10.1038/s12276-018-0060-y
  3. Zamboni N., Fendt S.M., Rühl M., Sauer U. "13C-based metabolic flux analysis." Nat. Protoc. 4, 878–892 (2009). https://doi.org/10.1038/nprot.2009.58

Ready to Quantify Your Metabolic Pathways?

Contact our team to discuss your fluxomics project. We will help you select the right tracer, design the optimal labeling strategy, and deliver publication-ready flux maps.

Our fluxomics service is intended for research use only (RUO). Not for use in diagnostic or clinical procedures.

Online Inquiry

Please submit a detailed description of your project. We will provide you with a customized project plan to meet your research requests. You can also send emails directly to for inquiries.

* Email
Phone
* Service & Products of Interest
Services Required and Project Description