Untargeted Metabolomics for Drug Mechanism-of-Action (MoA) Research

Read the metabolic fingerprint your compound leaves behind — and decode what it's actually doing.

When a compound shows cellular activity but the target or pathway is unknown, the metabolome records exactly what changed. Untargeted metabolomics captures thousands of small-molecule features simultaneously from drug-treated and control samples, revealing which metabolic pathways were perturbed, in which direction, and at what magnitude — without requiring any prior hypothesis about the mechanism.

At Creative Proteomics, our untargeted metabolomics MoA service deploys dual-column LC-HRMS (RP + HILIC), positive and negative ion mode switching, and an integrated bioinformatics pipeline — HMDB annotation, KEGG pathway mapping, and multivariate statistics — to turn raw metabolic signal into a mechanistic fingerprint that can separate MoA classes and prioritise compounds for follow-up.

Key Advantages:

  • Hypothesis-free, system-wide coverage of the cellular metabolome — from central carbon and energy metabolism to lipid mediators and nucleotide pools.
  • Dual-column platform (RP + HILIC) maximises polar and non-polar metabolite detection in a single project.
  • MS2 fragmentation-based structural confirmation for key annotated features, reducing false annotations.
  • Deliverables include MoA-class separation heatmaps, perturbed pathway summaries, and compound comparison matrices for lead triage.
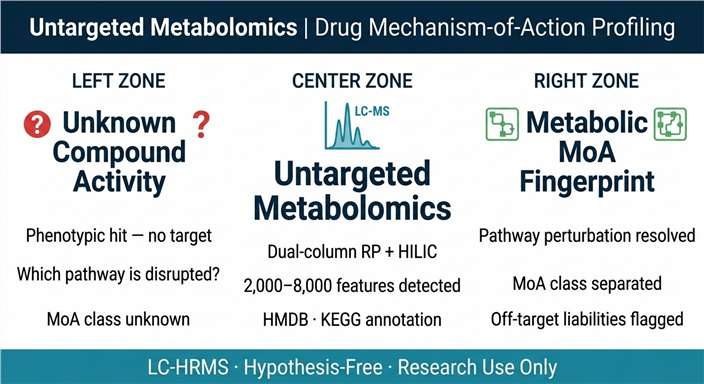
Untargeted metabolomics for drug MoA: three-zone diagram showing unknown compound activity input, LC-HRMS metabolic fingerprinting, and mechanistic pathway output.
What Is Metabo-MoA Service Overview Tech Comparison Sample Demo Case Study FAQ

The Metabolic Fingerprint as a Mechanism-of-Action Readout

Metabolites are the immediate downstream products of enzymatic activity. When a drug disrupts a protein, inhibits an enzyme, alters membrane transport, or engages a receptor, the metabolite pool shifts within minutes to hours — before any transcriptional or translational response is detectable. This makes the metabolome one of the most sensitive and temporally proximate readouts of pharmacological action available to researchers.

Untargeted metabolomics exploits this property by profiling thousands of small molecules simultaneously across drug-treated and control samples. Rather than measuring a pre-selected panel of metabolites, the untargeted approach captures the full complement of detectable features — polar intermediates, lipid mediators, nucleotides, amino acids, organic acids, xenobiotic metabolites — and uses multivariate statistics to identify which features change significantly between conditions. The result is a metabolic fingerprint specific to the compound and its concentration, which can be overlaid onto known biochemical pathways to infer mechanism.

For drug discovery teams, the practical value is in triage and hypothesis generation. A compound that perturbs the TCA cycle suggests mitochondrial targeting; one that disrupts nucleotide biosynthesis intermediates points toward DNA replication or purine salvage pathways; a compound that shifts eicosanoid profiles implicates phospholipase or cyclooxygenase activity. These metabolic signatures can separate MoA classes across a compound series, prioritise hits from phenotypic screens, and generate mechanistic hypotheses for subsequent validation by metabolic pathway drug response profiling or orthogonal proteomics approaches.

Where Untargeted Metabolomics Fills the MoA Gap

Phenotypic hits without a target hypothesis

Compounds identified through cell viability, phenotypic, or whole-organism screens often lack a clear molecular target. Metabolic fingerprinting provides the first mechanistic signal — distinguishing compounds that act through metabolic enzyme inhibition from those affecting membrane integrity, signalling cascades, or non-metabolic pathways.

Rapid MoA class separation across a series

When comparing analogues or scaffold variants, unsupervised clustering of metabolic fingerprints groups compounds by shared mechanism — even when potency differences are small. This guides structure-activity reasoning at the mechanistic level, not just the biochemical one.

Off-target and toxicity pathway detection

Drug-induced metabolic shifts that fall outside the intended pathway — glutathione depletion, bile acid accumulation, mitochondrial membrane potential loss — emerge naturally from an untargeted dataset. These are not measurable by targeted panels focused only on the primary mechanism.

Natural product and complex mixture characterisation

For extracts, fractions, or natural product compounds where no reference mechanism exists, untargeted metabolomics generates an empirical mechanistic profile from the biological system itself — without requiring prior knowledge of the active component's structure or target. See our natural product MS discovery service for related upstream fractionation and dereplication workflows.

The Metabolome vs Other MoA Evidence Layers

Mechanism-of-action research increasingly draws on multiple molecular layers — proteomics, transcriptomics, and metabolomics each record the consequences of drug action at a different level of biological organisation. The metabolome occupies a uniquely proximate position: it reflects the functional output of enzymatic activity rather than the potential for that activity (gene expression) or the abundance of the catalytic machinery (protein levels). This temporal proximity means that metabolic perturbations are often detectable at lower drug concentrations and earlier time points than proteomic or transcriptomic changes — making untargeted metabolomics a sensitive first-pass MoA screen. For research programmes integrating multiple evidence layers, our multi-omics integration service supports cross-layer pathway reconciliation from a single study design.

Service Overview – Untargeted Metabolomics MoA Capabilities

Our untargeted metabolomics MoA service covers the full analytical chain from sample receipt to interpreted mechanistic output. We offer four complementary modes, each addressing a distinct phase of MoA research — from initial fingerprint generation to comparative mechanism-class triage across multiple compounds. All modes are built on the same dual-column LC-HRMS platform, ensuring data comparability across projects. For cell-based drug treatment experiments that require direct metabolic readout alongside the compound treatment, our service is closely related to cellular metabolomics screening.

MODE 1

Single-Compound MoA Fingerprinting

A single drug or compound is profiled against a matched control (DMSO or vehicle) across multiple biological replicates. The metabolic fingerprint identifies statistically significant feature changes and maps them onto perturbed biochemical pathways.

  • Minimum 3 biological replicates per group; 6+ recommended for robust statistics.
  • Dual-column RP + HILIC acquisition in positive and negative ion modes.
  • Output: differential feature list, volcano plot, pathway enrichment map, top-20 annotated metabolites with HMDB IDs.
MODE 2

Comparative Compound MoA Triage

Two to eight compounds from the same chemical series or screening campaign are profiled simultaneously. Hierarchical clustering of metabolic fingerprints groups compounds by shared mechanistic signatures and reveals analogues that diverge in MoA despite structural similarity.

  • Shared vehicle control across all compounds enables direct cross-compound comparison.
  • PCA and OPLS-DA used to visualise mechanism-class separation.
  • Delivers a compound MoA comparison matrix — useful for prioritising lead candidates before committing to resource-intensive target identification.
MODE 3

Time-Course Metabolic Perturbation Profiling

Samples collected at multiple time points after compound addition reveal the temporal sequence of metabolic pathway involvement — distinguishing primary metabolic effects (rapid, often within 1–4 hours) from secondary and adaptive responses.

  • Typical design: 1 h, 4 h, 12 h, 24 h post-treatment.
  • Temporal trajectory analysis identifies which pathway perturbations are early and compound-specific versus late and stress-adaptive.
  • Particularly informative for distinguishing direct enzyme inhibition from indirect metabolic adaptation.
MODE 4

Dose-Response Metabolic Signature Mapping

Cells or tissues are treated across a defined concentration range (e.g., IC10–IC80) to identify dose-correlated metabolic changes. Features that shift monotonically with dose are prioritised as on-mechanism biomarkers; those that appear only at high doses may indicate off-target or toxic effects.

  • Dose-correlated feature extraction using Spearman rank correlation across concentration series.
  • Separates mechanism-specific metabolic changes from non-specific cytotoxic perturbations.
  • Supports early safety flagging alongside mechanistic interpretation.

Analytical Workflow

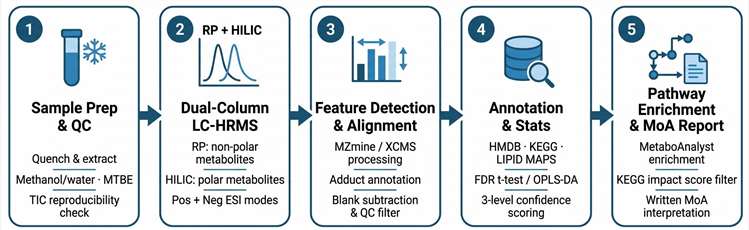
Five stages from sample receipt to MoA-annotated deliverable:

1

Sample preparation and quality assessment

Drug-treated and control samples (cells, tissue, plasma, or culture supernatant) are processed by established quenching and extraction protocols matched to the sample matrix — methanol/water for polar metabolites, MTBE-methanol-water for lipidomic coverage, or a combined biphasic extraction for broadest coverage. Protein precipitation and centrifugation remove macromolecules before injection. Sample QC: total ion chromatogram (TIC) reproducibility check and pooled QC sample injection at defined intervals.

2

Dual-column LC-HRMS data acquisition

Each sample is run in two separate LC-HRMS acquisitions: reversed-phase (RP) chromatography for non-polar and moderately polar metabolites, and hydrophilic interaction liquid chromatography (HILIC) for highly polar species (amino acids, nucleotides, organic acids, sugars). Both acquisitions are performed in full-scan MS1 mode with data-dependent MS2 fragmentation triggered for the top-N precursors — providing both coverage depth and structural identification capacity from a single injection per mode.

3

Feature detection and alignment

Raw MS data are processed using MZmine or XCMS for peak picking, retention time alignment, and feature grouping across samples. Adduct annotation (M+H, M+Na, M+NH4, M−H, M+Cl) is applied to reduce redundant features. Blank subtraction and QC-based filtering remove noise features before statistical analysis. Typically 2,000–8,000 features are retained for biological interpretation per acquisition.

4

Statistical analysis and metabolite annotation

Differential features between treated and control groups are identified by fold-change and FDR-corrected t-test or Mann-Whitney U test. Multivariate analysis (PCA, OPLS-DA) visualises group separation. Retained features are annotated against HMDB, KEGG, and LIPID MAPS databases by accurate mass matching (≤5 ppm) and MS2 spectral matching. Annotation confidence is reported at three levels: MS1 mass-match only, MS1 + MS2 library match, and MS1 + MS2 + retention time match.

5

Pathway enrichment and MoA interpretation

Significantly changed metabolites are submitted to MetaboAnalyst for KEGG pathway enrichment analysis, identifying which biochemical pathways show statistically overrepresented perturbation. Results are filtered by pathway impact score and FDR to prioritise mechanistically interpretable pathways. A written MoA interpretation report translates pathway findings into mechanistic hypotheses — distinguishing primary effects from secondary adaptation and flagging potential off-target metabolic liabilities.

Untargeted metabolomics MoA workflow: sample preparation and extraction, dual-column RP+HILIC LC-HRMS acquisition, feature detection and alignment, statistical analysis and HMDB annotation, KEGG pathway enrichment and MoA interpretation.

Applications by Drug Discovery Context

Untargeted metabolomics generates mechanistic signal that is most actionable in five research contexts — each defined by a distinct question that metabolic data can uniquely answer.

Phenotypic Screening Deconvolution

After a phenotypic screen identifies active compounds, metabolic fingerprinting provides the first mechanistic triage layer — separating compounds that act through energy metabolism, membrane disruption, nucleotide biosynthesis, or signalling pathway inhibition without requiring individual target binding assays.

Metabolic evidence delivers: a mechanism-class assignment for each active compound, enabling prioritisation of those with novel or desired MoA before investing in target identification workflows.

Antibiotic and Antiprotozoal MoA Characterisation

Metabolomics is particularly powerful for characterising antimicrobial compound mechanisms, where the metabolic consequences of target engagement (e.g., cell wall biosynthesis inhibition causing UDP-MurNAc accumulation, or folate pathway disruption causing thymidylate depletion) are biochemically distinctive.

Metabolic evidence delivers: a signature metabolite cluster diagnostic for the affected pathway, enabling blind MoA prediction for novel compounds with no known target — a workflow demonstrated at scale in published high-throughput antimicrobial MoA studies.

Immune-Metabolic Drug Profiling

Compounds targeting inflammatory signalling, immune cell activation, or checkpoint pathways alter immunometabolic pathways including glycolysis/OXPHOS balance, fatty acid oxidation, and eicosanoid biosynthesis in ways that are clearly metabolically distinguishable. Our immunometabolism MS service extends this into dedicated immune cell metabolic profiling contexts.

Metabolic evidence delivers: eicosanoid, cytokine-related metabolite, and energy metabolism perturbation profiles across treatment groups, supporting MoA characterisation for anti-inflammatory and immunomodulatory compounds.

Early Hepatotoxicity and Metabolic Liability Flagging

Drug-induced metabolic shifts that indicate early hepatotoxic liability — bile acid accumulation, glutathione depletion, taurine conjugate shifts, or acylcarnitine accumulation indicating mitochondrial fatty acid oxidation impairment — emerge naturally from an untargeted dataset at non-cytotoxic concentrations.

Metabolic evidence delivers: pre-cytotoxic metabolic stress signatures that can be incorporated into early safety decision frameworks, without requiring dedicated targeted toxicology assays at the screening stage.

Natural Product MoA Profiling

Natural product compounds from plant extracts, marine organisms, or fungal fermentations frequently act through metabolic enzyme targets. Since no synthetic target-binding reference exists, the biological metabolic response is often the only available mechanistic signal before labour-intensive target ID.

Metabolic evidence delivers: a cell-derived mechanistic hypothesis from the metabolome alone, guiding which target identification approach (affinity enrichment, thermal proteomics, ABPP) to deploy for follow-up validation.

Combination Synergy Mechanism Analysis

When two compounds show synergistic activity, untargeted metabolomics identifies whether the synergy is metabolic in origin — complementary pathway blockade, sequential enzyme inhibition in a shared route — or reflects convergence on non-overlapping targets whose combined effect amplifies pathway disruption.

Metabolic evidence delivers: pathway-level synergy mapping, pinpointing which metabolic node is most severely impacted by the combination versus either single agent — directly supporting rational combination design.

Technology Comparison: Metabolomics Platforms for MoA Research

PlatformCoverage PrincipleMoA Research StrengthsKey LimitationsBest Suited For
Untargeted LC-HRMS (RP + HILIC)Full-scan accurate-mass detection of all ionisable features; broad polar + non-polar coverage via two chromatographic modes.
  • Hypothesis-free — no prior knowledge of mechanism required
  • Detects known and unknown metabolites
  • Identifies unexpected pathway perturbations and off-target effects
  • HMDB/KEGG pathway enrichment directly applicable
  • Annotation completeness limited by database coverage (~30–60% of detected features annotatable)
  • Relative quantification only unless stable-isotope reference standards added
First-pass MoA characterisation, phenotypic hit triage, novel compound profiling
Targeted Metabolomics PanelMRM or PRM quantification of a pre-defined metabolite set; absolute quantification using stable-isotope internal standards.
  • Highest quantitative precision and accuracy
  • Low missing values; robust across large sample cohorts
  • Appropriate for clinical biomarker monitoring
  • Restricted to pre-selected metabolites — blind to unexpected pathway shifts
  • Not suited for hypothesis-free MoA discovery
Validation of specific MoA hypotheses; pharmacodynamic biomarker quantification
Lipidomics (Untargeted)Lipid-optimised extraction and chromatography with species-level lipid class annotation.
  • Detailed coverage of glycerophospholipids, sphingolipids, and fatty acid mediators
  • Particularly informative for membrane-active compounds and anti-inflammatory MoA
  • Limited coverage of polar/water-soluble metabolites
  • Complements, but does not replace, global untargeted metabolomics
Lipid mediator MoA studies; membrane disruption; eicosanoid profiling. See our cellular lipidomics profiling service.
¹³C Isotope Tracer / FluxomicsStable-isotope-labelled substrates track carbon flux through specific metabolic routes.
  • Quantitative flux measurement through specific pathways (glycolysis, TCA, PPP)
  • Directly measures enzyme activity at the network level
  • Restricted to labelled substrate's connected pathways
  • Requires specific experimental design and labelling substrates in advance
Mechanistic flux validation after untargeted MoA fingerprinting. See our ¹³C fluxomics service for follow-up studies.
NMR-Based MetabolomicsSolution-state NMR quantifies metabolites non-destructively; no chromatographic separation required.
  • Absolute quantification without internal standards for many metabolites
  • Excellent reproducibility; no ionisation bias
  • Lower sensitivity than LC-HRMS; restricted to ~100–200 metabolites reliably quantified
  • Poor coverage of low-abundance signalling metabolites critical for drug MoA
High-abundance metabolite quantification; body fluid profiling where MS sensitivity is sufficient

Instrumentation

ComponentPlatformSpecificationRole in MoA Metabolomics
RP-LC ColumnC18 UHPLC (1.7 µm, 2.1 × 100 mm)12-min gradient, 0.1% FA in water/acetonitrileNon-polar and moderately polar metabolite separation; lipid mediators, fatty acids, aromatic metabolites
HILIC ColumnAmide HILIC UHPLC (1.7 µm, 2.1 × 100 mm)10-min gradient, 10 mM ammonium formate in ACN/waterPolar metabolite separation; amino acids, nucleotides, organic acids, sugars, water-soluble vitamins
HRMSQ Exactive HF (Thermo) or Xevo G3 QToF (Waters)Resolution: 120,000 FWHM (MS1); 30,000 (MS2); mass accuracy:<5 ppmFeature detection, molecular formula assignment, MS2 structural confirmation
Ion ModePositive and Negative ESIAlternating acquisition or separate injections per modeMaximises metabolite detection (acidic species in negative, basic/neutral in positive)
BioinformaticsMZmine / XCMS / MetaboAnalystFeature detection, alignment, HMDB/KEGG annotation, pathway enrichmentTranslates raw feature matrix into annotated, pathway-mapped MoA output

Sample Requirements

Sample TypeMinimum AmountRecommended AmountStorage & TransportKey Notes for Drug Treatment Studies
Cultured Cells (Suspension)> 1 × 10⁶ cells per sample> 1 × 10⁷ cells per sampleSnap-freeze pellet in liquid nitrogen; store at −80°C; ship on dry iceWash 2–3× with pre-chilled PBS before freezing to remove medium metabolites; collect at defined time point post-drug addition; record exact cell count per replicate
Cultured Cells (Adherent)> 1 × 10⁶ cells per sample> 1 × 10⁷ cells per sampleSnap-freeze scraped pellet; −80°C; dry iceUse cold methanol quenching in-dish for metabolomics; scraping recommended over trypsin for untargeted metabolomics to avoid enzymatic metabolite changes
Culture Supernatant (Secretome)> 2 mL per sample> 5 mL per sampleCentrifuge to remove cells; freeze supernatant; −80°C; dry iceUse serum-free or defined medium only; indicate medium formulation as it affects baseline metabolite composition
Animal Tissue (Soft)≥ 30 mg per sample100–200 mg per sampleSnap-freeze in liquid nitrogen immediately post-dissection; −80°C; dry iceFreeze within 30 seconds of dissection; fast animals for ≥ 10 h before sampling to reduce metabolite variability; collect replicates from same anatomical sub-region
Plasma (Drug PK/PD Studies)> 100 µL per sample> 200 µL per sampleHeparin anticoagulant (green cap); centrifuge at 3,000 rpm × 10 min at 4°C; store at −80°C; ship on dry iceCollect at precisely defined time points post-dose; EDTA may interfere with some metabolite classes — indicate if used; avoid haemolysis
Urine200–500 µL per sample500 µL per sampleCentrifuge; −80°C; dry iceCollect midstream at consistent time of day; control diet 24 h pre-collection to reduce confounding metabolite variation
Organoid ModelsDiscuss with technical team≥ 50 organoids per sample−80°C; dry ice; indicate matrix (Matrigel or equivalent) in advanceMatrix-matched controls required; see our organoid metabolomics service for protocol details specific to 3D model systems

Biological replicates: minimum 6 per group recommended for untargeted metabolomics to achieve adequate statistical power for differential feature detection. For projects with fewer than 6 replicates per group, multivariate analysis reliability is reduced — please consult our team before committing to experimental design. Sample handling consistency (extraction timing, quenching protocol, freeze-thaw cycles) is the single largest controllable source of pre-analytical metabolomics variability; we provide a detailed sample collection protocol on request.

Deliverables

  • Raw LC-HRMS data files (mzML and vendor format) for both RP and HILIC acquisitions; QC report including TIC RSD across QC injections
  • Processed feature matrix: aligned peak list with retention time, m/z, adduct assignment, and per-sample intensity values
  • Differential feature results: volcano plot (fold change vs FDR), feature lists stratified by annotation confidence level (MS1 only / MS1+MS2 / MS1+MS2+RT)
  • Annotated metabolite table: HMDB accession, metabolite name, chemical class, pathway class, biosample annotation confidence
  • KEGG pathway enrichment map: ranked pathways by impact score and FDR, colour-coded by direction of perturbation (enriched up vs down)
  • Multivariate analysis plots: PCA scores plot (all samples), OPLS-DA S-plot and permutation test for compound MoA separation experiments
  • MoA interpretation report: written mechanistic summary translating pathway findings into drug mechanism hypotheses, with off-target and toxicity pathway flags
  • Compound comparison matrix (Mode 2): inter-compound metabolic fingerprint similarity scores and mechanism-class cluster dendrogram

Representative Results

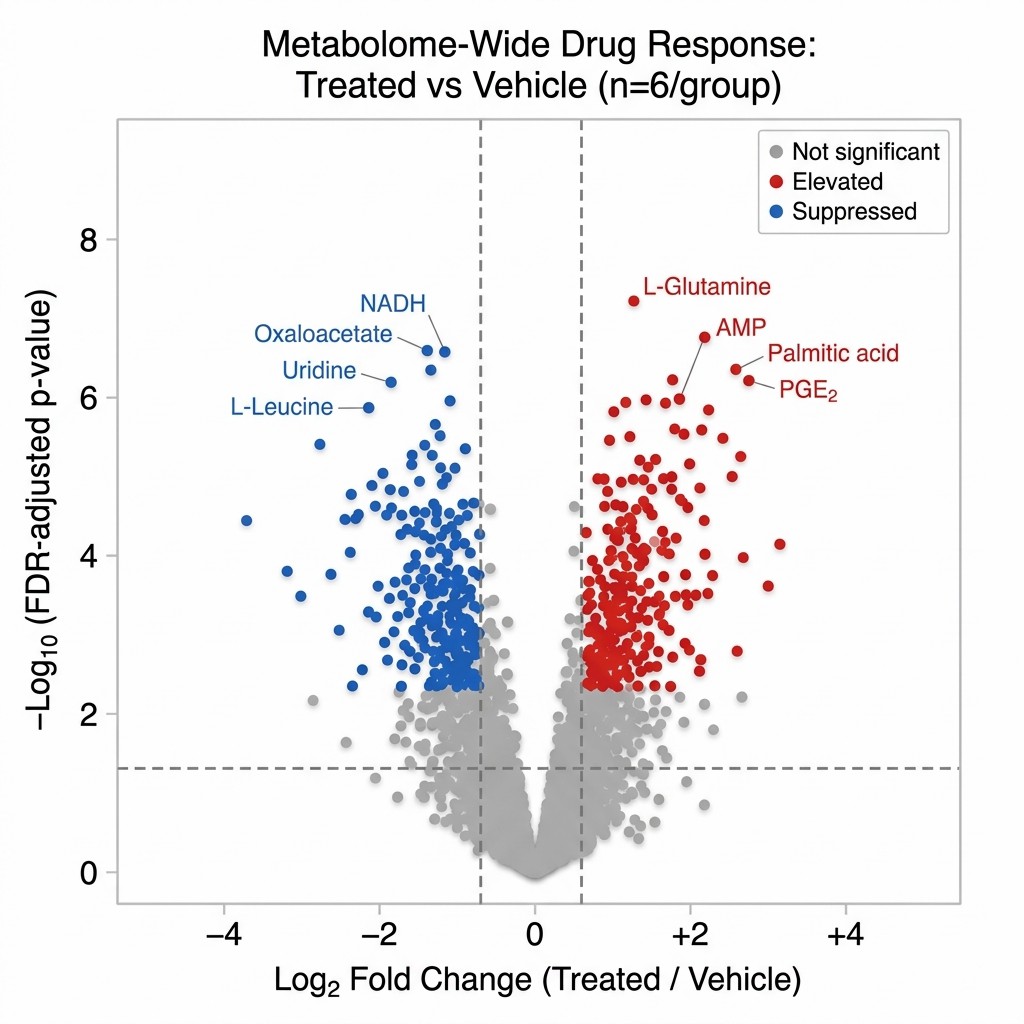
Untargeted metabolomics MoA volcano plot: log2 fold change versus -log10 FDR-adjusted p-value for 3,842 metabolic features comparing drug-treated versus DMSO control cells; significantly elevated features in red, suppressed in blue, annotated with top metabolite names.

Volcano plot: metabolome-wide drug response features

Full-feature volcano plot from RP-LC-HRMS untargeted metabolomics, comparing compound-treated versus DMSO-vehicle control cells (n = 6 per group). Red: significantly elevated features (FC ≥ 1.5, FDR < 0.05); blue: significantly suppressed; grey: unchanged. Top annotated features labelled with HMDB metabolite names.

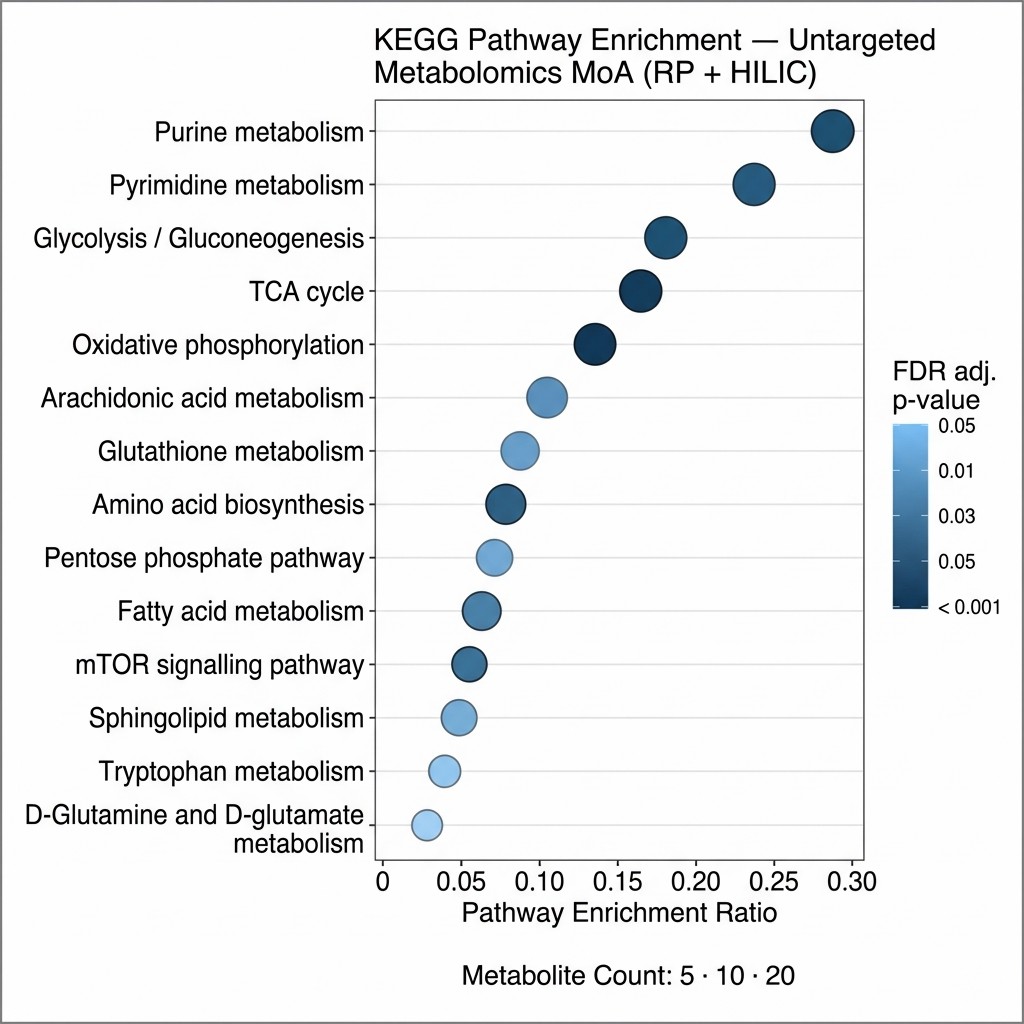
KEGG metabolic pathway enrichment bubble chart from untargeted metabolomics MoA study: y-axis lists enriched KEGG pathways, x-axis shows enrichment ratio, bubble size represents metabolite count, colour gradient represents FDR adjusted p-value.

KEGG pathway enrichment: MoA pathway signature

Pathway enrichment bubble chart derived from significantly changed metabolites (FDR < 0.05). Bubble size: metabolite count per pathway; colour gradient: FDR (dark teal = most significant). Top-ranked pathways by pathway impact score indicate primary MoA pathway involvement, guiding mechanistic hypothesis formation.

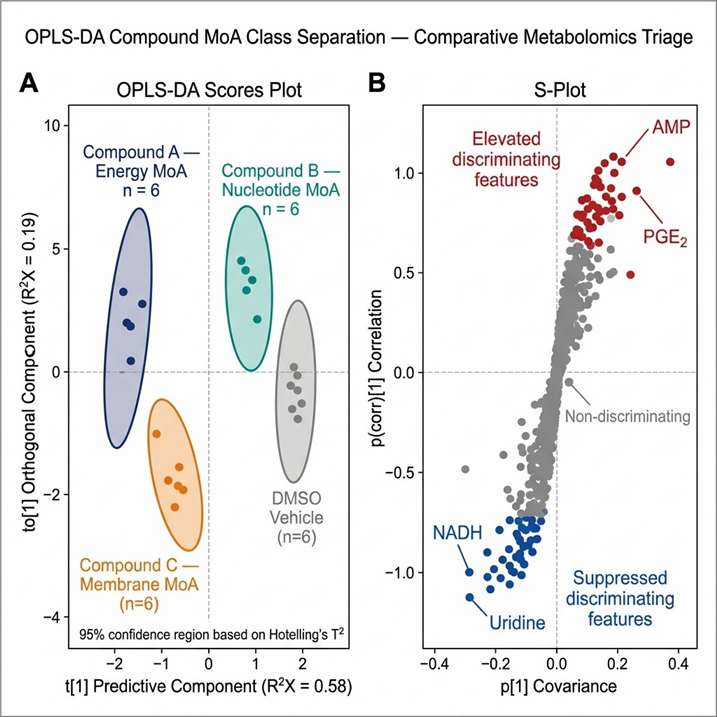
OPLS-DA scores plot and S-plot from comparative compound MoA triage experiment: four compound classes separate clearly in metabolic feature space; S-plot identifies discriminating metabolite features on x-axis loading versus reliability axis.

OPLS-DA compound MoA triage: mechanism-class separation

OPLS-DA scores plot (left) and S-plot (right) from a four-compound comparative MoA experiment. Compounds with shared mechanisms cluster together in metabolic feature space; divergent cluster positions indicate distinct MoA. S-plot identifies the specific metabolite features driving each class separation.

Case Study: Untargeted Metabolomics Decodes Anti-Inflammatory MoA via TLR and Lipid Mediator Pathway Perturbation

Richter H., Gover O., Schwartz B. "Anti-Inflammatory Activity of Black Soldier Fly Oil Associated with Modulation of TLR Signaling: A Metabolomic Approach." International Journal of Molecular Sciences 2023, 24(13), 10634. https://doi.org/10.3390/ijms241310634

Research Question

Black soldier fly larvae (BSFL) oil is a sustainable dietary ingredient rich in medium-chain fatty acids, particularly C12:0 (lauric acid). Its anti-inflammatory activity had been observed in cellular and animal models, but the precise metabolic mechanism — specifically how it modulates Toll-like receptor (TLR) signalling and downstream inflammatory metabolite production — was unknown. Researchers used Creative Proteomics' LC-MS-based metabolomics platform to characterise the eicosanoid and oxylipin metabolic landscape in treated macrophage and colitis models, aiming to connect the lipid treatment to a specific TLR-linked MoA.

Methods

THP-1 and J774A.1 macrophage cell lines were activated with TLR4 (LPS) or TLR2 (Pam3CSK4) agonists and treated with BSFL oil or purified C12:0. An in vivo dextran sulfate sodium (DSS)-induced acute colitis mouse model was used for physiological validation. Creative Proteomics provided LC-MS-based quantitative analysis of eicosanoids and oxylipins — a specialised untargeted-to-targeted metabolomics workflow — capturing lipid mediator changes across treatment conditions. Key endpoints measured included proinflammatory cytokine suppression, mTOR signalling activity, and PPAR pathway activation, all cross-referenced with the LC-MS metabolomic readout.

Key Findings

BSFL oil — but not purified C12:0 alone — suppressed proinflammatory cytokine release in Pam3CSK4-stimulated macrophages (TLR2 activation), demonstrating a MoA distinct from simple lauric acid activity. The metabolomic analysis of eicosanoids and oxylipins identified a lipid mediator signature consistent with modulation of TLR2-linked inflammatory signalling, including perturbation of mTOR-dependent metabolic reprogramming and activation of PPAR-related anti-inflammatory metabolic pathways. In the DSS colitis mouse model, BSFL oil treatment produced measurable protective effects on colon tissue integrity, with the metabolic fingerprint providing mechanistic context for the observed anti-inflammatory phenotype that would not have been accessible from cytokine assays or gene expression alone.

Significance for Untargeted Metabolomics MoA Research

This study illustrates the core value of metabolomics-based MoA characterisation: the activity difference between BSFL oil and its purified major fatty acid (C12:0) was only mechanistically interpretable through the lipid mediator metabolic landscape. The eicosanoid and oxylipin profile revealed TLR2-specific pathway engagement that a protein-level or transcript-level assay alone would not have resolved. The study demonstrates how LC-MS-based metabolomics translates a biological activity phenotype into a specific pathway-level MoA fingerprint — exactly the evidence generation pathway that Creative Proteomics' untargeted metabolomics MoA service is designed to support.

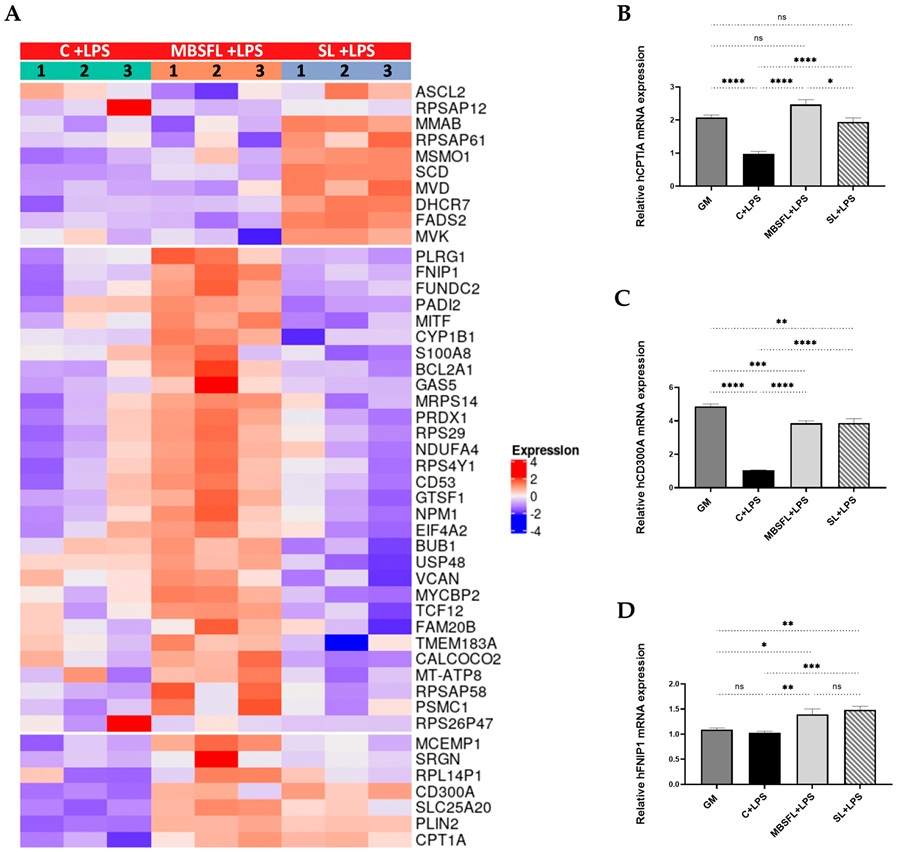
Figure from Richter et al. 2023, IJMS, showing eicosanoid and oxylipin metabolite profile from LC-MS metabolomics analysis of BSFL oil-treated macrophages, illustrating TLR signalling pathway perturbation.

Figure from Richter et al. 2023 (Int. J. Mol. Sci., DOI: 10.3390/ijms241310634). LC-MS metabolomics characterisation of lipid mediator perturbation in BSFL oil-treated macrophages. PMC10341857.

FAQ

Frequently Asked Questions

Q: How does untargeted metabolomics actually reveal a drug's mechanism of action?

Every metabolic enzyme exists within a connected network of substrate–product relationships. When a drug inhibits or activates an enzyme, substrates accumulate and products deplete — generating a characteristic perturbation signature detectable by mass spectrometry. Untargeted LC-HRMS captures this signature across thousands of metabolite features simultaneously. Statistical comparison between treated and control samples identifies which features changed significantly; mapping those features to KEGG or HMDB pathways reveals which biochemical routes were perturbed and in which direction. The result is a metabolic fingerprint that encodes the compound's mechanism, even when the target is not known in advance.

Q: What cell models and sample matrices are compatible with this service?

The service is compatible with a broad range of biological matrices. Cell models include suspension and adherent cell lines, primary cells, co-cultures, and 3D organoid systems. Tissue samples from drug-treated animals — liver, kidney, brain, tumour xenografts — are routinely processed using cryogenic homogenisation. Biofluids including plasma, serum, and urine are accepted for systemic drug exposure metabolomics. For confidence in metabolite identification, we strongly recommend providing biological replicates (minimum 6 per group) and matched vehicle controls prepared under identical conditions. For metabolite ID confirmation in follow-up studies, see our metabolite identification service for MS2-based structural confirmation workflows.

Q: How many metabolites will you identify, and what annotation confidence can I expect?

A typical dual-column RP + HILIC experiment detects 2,000–8,000 features per acquisition mode after filtering; of these, 30–60% can be annotated to a metabolite name at MS1 mass-match level (confidence level 3), 15–30% confirmed by MS2 spectral matching against HMDB or MassBank (confidence level 2), and 5–15% confirmed by MS2 + retention time match against authentic standards (confidence level 1). Annotation rates depend heavily on the biological matrix and organism. We report all annotations with their confidence level explicitly, so you can distinguish robustly identified metabolites from putative annotations — critical for making mechanistic conclusions on firm ground.

Q: Can untargeted metabolomics distinguish between different MoA classes in a compound screen?

Yes — this is one of the strongest established applications of metabolomics in drug discovery. Published antimicrobial and anticancer compound profiling studies have demonstrated that metabolic fingerprints cluster compounds by mechanism class in unsupervised multivariate analysis, with compounds targeting the same pathway grouping together regardless of structural similarity. For our Mode 2 comparative triage service, we use OPLS-DA to visualise and statistically validate separation between MoA classes. The precision of class separation depends on how metabolically distinctive the mechanisms are — cell wall biosynthesis inhibitors, energy metabolism disruptors, and nucleotide biosynthesis blockers typically separate well; compounds acting through protein–protein interaction disruption or non-metabolic targets may show weaker metabolic signal.

Q: What is the difference between using untargeted metabolomics versus proteomics for MoA?

Untargeted metabolomics and proteomics address MoA from complementary molecular dimensions. Metabolomics measures small-molecule intermediates — the direct functional outputs of enzyme activity — and is particularly sensitive to MoA involving metabolic enzymes, lipid mediators, energy pathways, and redox status. Changes are often detectable within 1–4 hours of drug addition. Proteomics measures protein abundance and modification changes, which typically emerge over longer time scales (hours to days) and are most informative for MoA involving transcriptional reprogramming, protein stability, or complex signalling cascades. For studies where the mechanism may operate at either layer, our pharmaco-metabolomics service can be combined with proteomics in a coordinated multi-omics experimental design.

Q: How do I design my drug treatment experiment to get the most from untargeted metabolomics MoA data?

Three design decisions have the greatest impact on data quality and interpretability. First, replicate number: aim for at least 6 biological replicates per group; fewer than 4 compromises multivariate analysis reliability. Second, concentration selection: use concentrations that produce the desired biological effect without inducing non-specific cytotoxicity — we recommend including a viability check alongside metabolomics. Third, timing: collect samples at a time point where the primary MoA effect is expected to be established but secondary stress responses have not dominated — typically 4–12 hours for most cell-based drug studies. Our team can review your experimental design before you begin sample collection and provide a protocol optimised for metabolomics-quality data.

References

  1. Vincent I.M., Ehmann D.E., Mills S.D., Perros M., Barrett M.P. Untargeted metabolomics to ascertain antibiotic modes of action. Antimicrob Agents Chemother. 2016;60(4):2281–2289.
  2. Creek D.J., Anderson J., McConville M.J., Barrett M.P. Metabolomic analysis of antiprotozoal drug mechanisms. Int J Parasitol Drugs Drug Resist. 2012;2:207–213.
  3. Balcke G.U., et al. Advancing anticancer drug discovery: leveraging metabolomics and machine learning for mode of action prediction. Advanced Science. 2024;11:2404085.
  4. Richter H., Gover O., Schwartz B. Anti-inflammatory activity of black soldier fly oil associated with modulation of TLR signaling: a metabolomic approach. Int J Mol Sci. 2023;24(13):10634.

Design your untargeted metabolomics MoA study with the MassTarget™ team

Share your compound, cell model, and research question — our scientists will recommend an acquisition mode, experimental design, and bioinformatics scope matched to your MoA discovery objective.

For Research Use Only (RUO). Not intended for diagnostic, therapeutic, or clinical decision-making purposes. Creative Proteomics services are designed to support preclinical research, drug discovery, and mechanism of action studies only.

Online Inquiry

Please submit a detailed description of your project. We will provide you with a customized project plan to meet your research requests. You can also send emails directly to for inquiries.

* Email
Phone
* Service & Products of Interest
Services Required and Project Description