

Principles of DESI Ionization
Desorption electrospray ionization (DESI) is an ambient ionization technique — one of the key platforms in the spatial metabolomics by mass spectrometry imaging landscape — that generates ions directly from a sample surface under atmospheric pressure: no vacuum, no matrix, no laser. The core mechanism is elegantly simple: a pneumatically assisted electrospray of charged solvent microdroplets is directed at a tissue section, where the droplets form a transient liquid film that dissolves analytes from the surface. Subsequent droplet impacts splash secondary droplets containing dissolved analyte into the gas phase, which are then drawn into the mass spectrometer inlet for analysis.
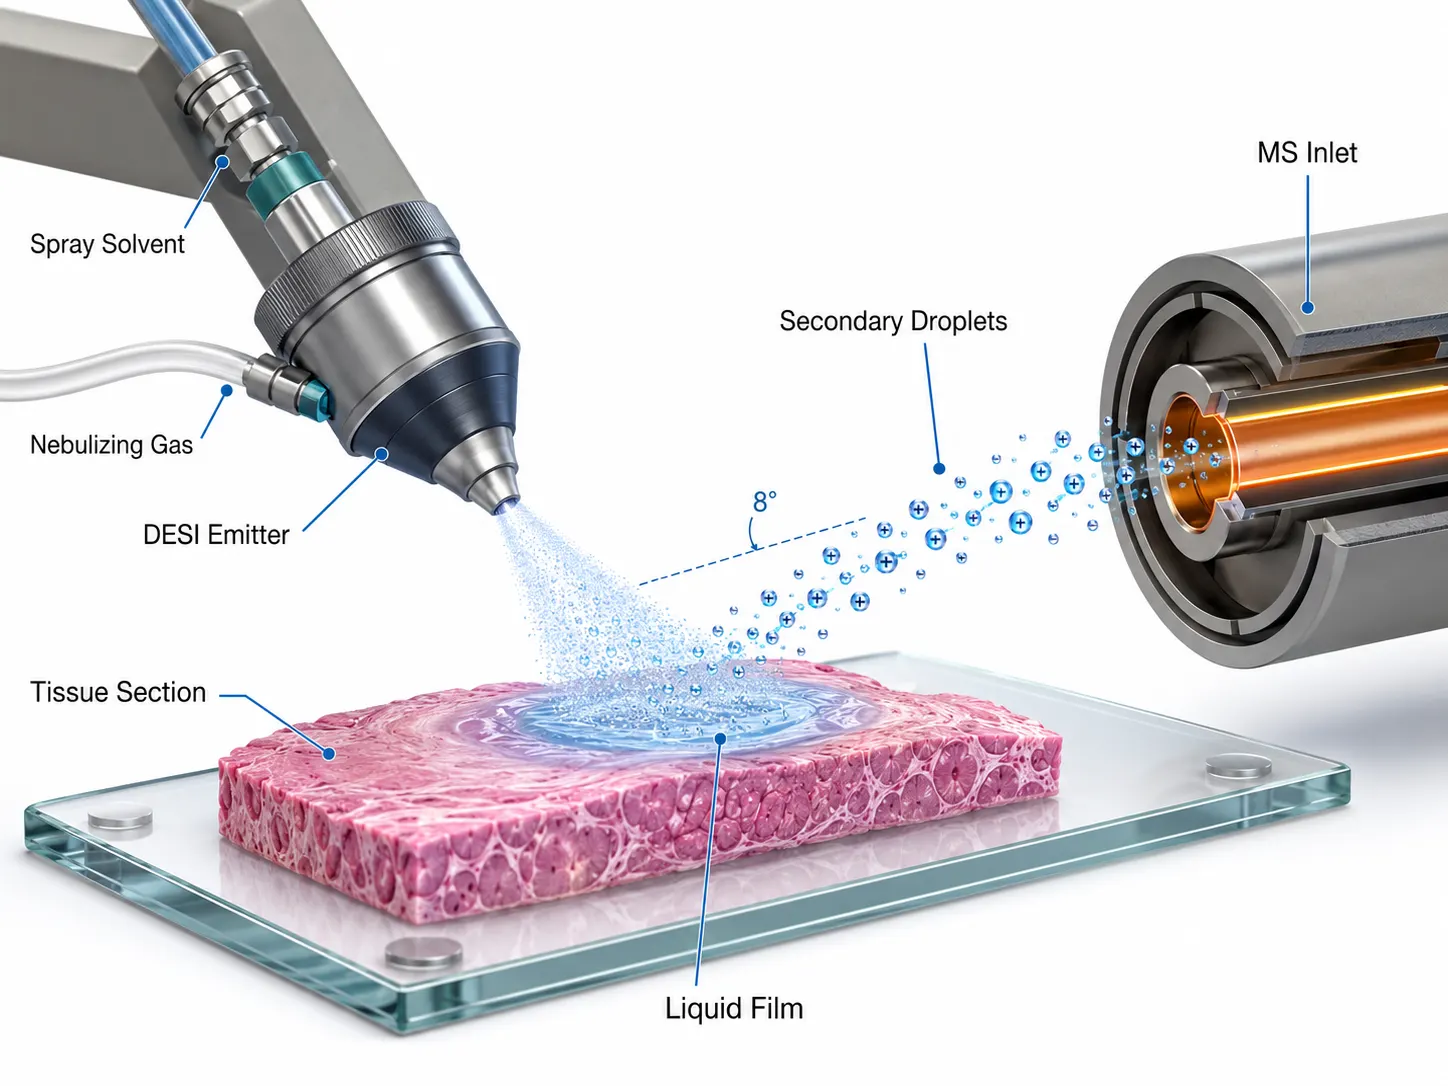 Figure 1: DESI Ionization Mechanism — 3D Cutaway Illustration. A 3D cutaway rendering of the DESI ionization process: a pneumatically assisted electrospray emitter (left) directs a stream of charged methanol/water microdroplets at ~55° incidence onto a tissue section mounted on a glass slide. The impacting droplets form a transient liquid film that dissolves analytes from the tissue surface within milliseconds. Subsequent droplet impacts splash secondary analyte-containing droplets toward the mass spectrometer inlet (right) at a ~5-10° collection angle. Key geometric parameters — sprayer angle, collection angle, tip-to-surface distance, and MS inlet distance — are labeled with callouts, emphasizing the precision alignment required for optimal signal.
DESI vs Conventional ESI: Ambient Ionization Fundamentals
Conventional electrospray ionization (ESI) requires the analyte to be in solution and pumped through a capillary — it is fundamentally a solution-phase technique. DESI turns this inside out: the sample stays on its native surface, and the solvent comes to the sample.
The key difference lies in the droplet pick-up mechanism. In DESI, a high-velocity stream of charged solvent droplets (typically methanol/water mixtures at 2-5 μL/min) strikes the sample surface at an angle of approximately 50-60 degrees. Upon impact, the droplets wet a small area of the surface (the "desorption spot"), dissolving soluble analytes within milliseconds. The momentum of incoming droplets then ejects analyte-containing secondary droplets toward the MS inlet at a collection angle of roughly 5-10 degrees relative to the surface. This geometry — sprayer angle, collection angle, tip-to-surface distance, and MS inlet distance — must be precisely aligned, as small deviations dramatically affect signal intensity.
The absence of a matrix is DESI's defining advantage. Unlike MALDI, which embeds analytes in a crystalline matrix that can cause ion suppression, adduct formation, and spatial delocalization, DESI interrogates the tissue in its native chemical state. This makes DESI particularly suitable for detecting labile metabolites, intact lipids, and drug compounds — the same analyte classes targeted by untargeted metabolomics and lipidomics workflows — that would be obscured or degraded by matrix application.
Solvent Composition Effects on Analyte Extraction and Ionization
Solvent choice is the single most powerful experimental lever in a DESI-MSI experiment. The spray solvent must simultaneously extract analytes from the tissue surface and promote their ionization — two functions that place conflicting demands on solvent properties.
Methanol/water (typically 95:5 to 50:50 v/v) is the workhorse solvent system for lipid imaging. Methanol provides excellent wetting and lipid solubility, while a small water fraction enhances proton transfer for positive-ion mode detection. For polar metabolites — amino acids, organic acids, nucleotides — higher water content (up to 80%) improves extraction efficiency but can cause analyte delocalization if the liquid film becomes too thick.
Recent advances in additive-enhanced solvents have expanded DESI's analytical range considerably. Doping the spray solvent with silver ions (Ag+) at micromolar concentrations enables ionization of nonpolar species like cholesterol and carotenoids through cation adduction. Ammonium fluoride (NH4F) doping in negative-ion mode dramatically improves detection of eicosanoids and specialized pro-resolving mediators (SPMs), lipid classes that are otherwise difficult to ionize. Reactive solvent additives — such as betaine aldehyde for cholesterol derivatization or Girard's T reagent for carbonyl-containing metabolites — enable on-surface chemical reactions during the desorption process, effectively performing derivatization inside the millisecond-timescale liquid film.
The practical implication is that solvent optimization should be the first variable investigated when developing a new DESI-MSI method. A systematic solvent screen (methanol/water ratio, additive type and concentration, flow rate) typically takes 1-2 days but can yield order-of-magnitude improvements in signal for specific analyte classes.
Spatial Resolution Determinants in DESI-MSI
Spatial resolution in DESI is governed by three interdependent parameters: spray spot size, scan speed, and step size. The spray spot — the area of the tissue wetted by the solvent plume — defines the theoretical limit of resolution. Standard DESI sprayers produce spots of 100-200 μm diameter, though careful optimization of nebulizing gas flow, sprayer-to-surface distance, and solvent flow rate can reduce this to approximately 50 μm.
The relationship between scan speed and resolution is a practical trade-off. To achieve a given pixel size, the stage must move one pixel width per acquisition scan. At 50 μm pixel size with a typical 1-second scan time, the stage moves at 50 μm/s — meaning a 1 cm² tissue section requires roughly 11 hours of acquisition. Doubling the pixel size to 100 μm reduces acquisition time to approximately 2.8 hours for the same area. This quadratic scaling means that spatial resolution decisions must account for practical instrument time constraints.
Step size (the distance between adjacent line scans) must match the spray spot size in the y-dimension to avoid either oversampling (wasting time) or undersampling (leaving gaps). Modern DESI software platforms handle this automatically once pixel dimensions are specified.
DESI Variants and Their Niche Applications
The DESI principle has spawned several variants optimized for different resolution regimes and sample formats. Selecting the right variant for a given research question requires understanding the trade-offs each represents.
Standard DESI (50-200 μm): Tissue-Level Metabolomics and Lipidomics
Standard DESI using a conventional electrospray emitter remains the most widely deployed variant and the default choice for tissue-level metabolomics and lipidomics, offering complementary molecular coverage to established LC-MS/MS untargeted metabolomics pipelines. Its 100-200 μm spatial resolution matches the scale of anatomical substructures in most tissues — cortical layers in brain, tumor vs. stromal regions, white vs. gray matter. Standard DESI operates reliably for hours of continuous acquisition, making it suitable for whole-organ imaging at moderate resolution.
Key specifications: 2-5 μL/min solvent flow, 100-200 μm spot size, 100-200 μm/s scan speed, methanol/water spray solvent. Typical applications include tumor margin assessment, whole-body drug distribution, and comparative tissue lipidomics.
Nano-DESI (<50 μm): High-Resolution Liquid Extraction-Based Imaging
Nanospray desorption electrospray ionization (nano-DESI) replaces the pneumatically assisted spray of standard DESI with a liquid bridge formed between two fused-silica capillaries positioned in a "V" configuration above the sample surface. The primary capillary delivers solvent to the surface, forming a liquid microjunction that extracts analytes; the secondary capillary continuously aspirates the dissolved analyte solution and sprays it into the MS inlet via a nano-electrospray emitter.
This liquid extraction geometry provides several advantages. First, the extraction area is defined by the capillary inner diameter and the gap between capillaries and surface — typical nano-DESI probes achieve 20-50 μm spatial resolution. Second, the continuous liquid bridge provides more reproducible extraction than the stochastic droplet impacts of standard DESI, resulting in better quantification — a critical consideration for targeted metabolomics applications where precise concentration measurements are required. Third, nano-DESI can sample from the same spot repeatedly, enabling depth profiling and signal averaging.
The trade-off is speed: nano-DESI operates at 5-50 μm/s scan speeds, making whole-tissue imaging impractical. It is best suited for region-of-interest analysis where high spatial resolution or isomer selectivity (via MRM coupling) is required.
AFA-DESI, Flow-Probe DESI, and TLC-DESI: Specialized Variants
Air flow-assisted DESI (AFA-DESI) introduces a coaxial high-velocity gas stream around the solvent spray to confine the desorption area and improve ion transmission. This achieves better spatial resolution than standard DESI while maintaining higher throughput than nano-DESI. AFA-DESI is particularly effective for whole-body drug imaging where resolution and speed must be balanced.
Flow-probe DESI — also termed liquid microjunction surface sampling probe (LMJ-SSP) — is conceptually similar to nano-DESI but uses a coaxial sheath-flow geometry. It has found niche applications in sampling from irregular surfaces and non-planar samples where standard DESI geometries fail.
TLC-DESI couples thin-layer chromatography plates directly to DESI-MS analysis, enabling rapid separation and identification of complex mixtures. While not an imaging technique per se, it provides a useful bridge between chromatographic separation and ambient MS.
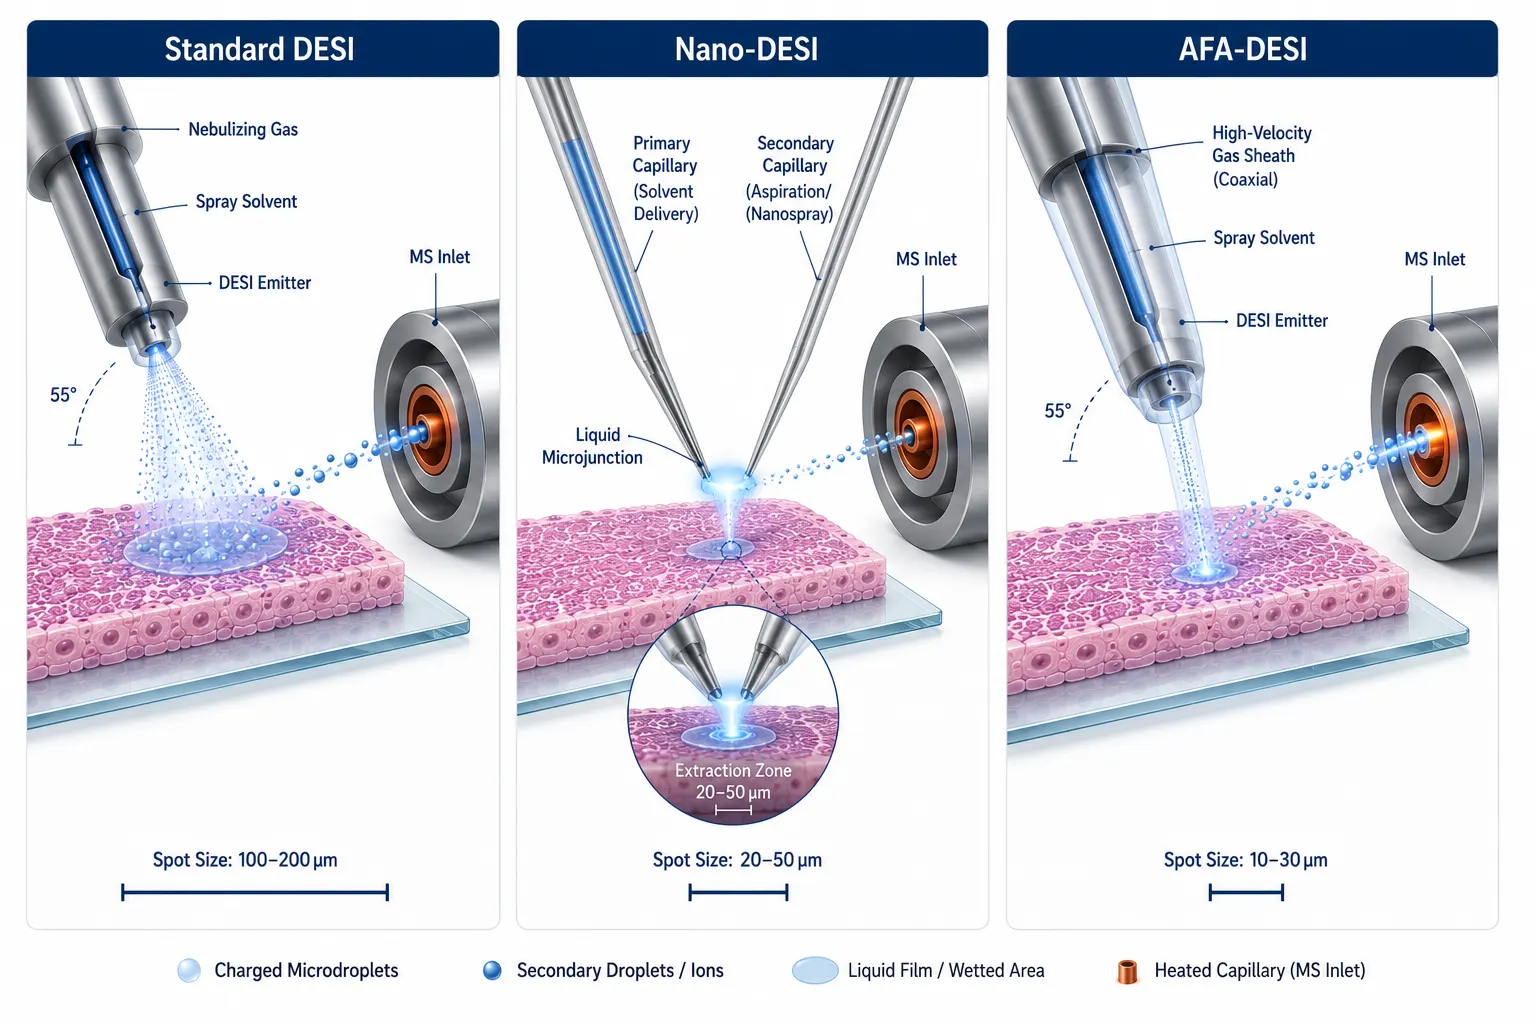 Figure 2: DESI Variants Comparison — Standard vs Nano-DESI vs AFA-DESI. Side-by-side schematic comparison of the three major DESI variants: (left) Standard DESI with a pneumatically assisted electrospray producing a 100-200 μm desorption spot — the workhorse for whole-tissue lipidomics; (center) Nano-DESI with a V-configuration dual-capillary liquid microjunction achieving 20-50 μm spatial resolution — enabling high-resolution and isomer-selective imaging; (right) AFA-DESI with a coaxial high-velocity gas stream confining the desorption area for improved resolution at higher throughput. Each panel displays the spray geometry, spot size, typical scan speed, and optimal application domain.
Decision Matrix: Which DESI Variant for Which Research Question
| Research Question | Recommended Variant | Typical Resolution | Key Advantage |
|---|---|---|---|
| Whole-tissue lipid profiling | Standard DESI | 100-200 μm | Throughput, robustness |
| Tumor margin assessment | Standard DESI | 100-200 μm | Speed, translational research compatibility |
| Sub-region lipidomics at high resolution | Nano-DESI | 20-50 μm | Spatial fidelity |
| Isomer-specific lipid imaging | Nano-DESI + MRM | 50-100 μm | Chemical specificity |
| Whole-body drug imaging | AFA-DESI | 100-200 μm | Throughput + sensitivity |
| Non-planar sample analysis | Flow-probe DESI | 100-200 μm | Geometry flexibility |
| TLC-resolved mixture ID | TLC-DESI | Spot-scale | Separation + MS |
DESI + Spatial Transcriptomics: The 2025 Breakthrough
The single most significant advance in the DESI-MSI field is the 2025 demonstration by Godfrey, Eberlin, and colleagues that DESI-MSI can be performed directly on a tissue section that is subsequently processed for 10x Genomics Visium spatial transcriptomics — on the same section. This is not adjacent-section analysis subject to section-to-section variability; it is genuine same-section multi-omics.
Workflow: DESI-MSI First, Then H&E, Then Visium on the Same Section
The workflow proceeds as follows: a 5-7 μm fresh-frozen tissue section is mounted on a standard Visium slide (which contains fiducial markers for spatial alignment). DESI-MSI is performed first at 100 μm spatial resolution using 100% methanol as the spray solvent. Methanol is the critical choice here — it is already the fixation reagent used in the first step of the standard Visium methanol fixation protocol, so DESI-MSI with methanol functions as both the molecular imaging step and the fixation step simultaneously.
After DESI-MSI acquisition, the slide proceeds directly to the standard Visium protocol: H&E staining, imaging, permeabilization, cDNA synthesis, library preparation, and sequencing. The fiducial markers on the Visium slide enable computational co-registration of the DESI-MSI metabolite map with the Visium gene expression map at single-spot (55 μm or 100 μm) resolution.
RNA Integrity Preserved: RIN 8.6-9.5 After DESI
The most pressing question when this workflow was first proposed was whether the DESI solvent spray would degrade RNA. The answer, demonstrated across multiple tissue types (mouse brain, human breast cancer, human lung cancer), is a decisive no. DESI-imaged tissue sections showed RNA integrity numbers (RIN) of 8.6-9.5, compared to 9.0-9.9 for unimaged controls — a drop of only approximately 0.4 RIN units. This minor decrease was attributed to ambient temperature exposure during DESI acquisition (30-60 minutes), not the solvent spray itself. For context, Visium requires RIN ≥ 4 for library preparation, so a RIN of 8.6 is far above the quality threshold.
Transcriptomic Data Integrity: Sequencing Correlation >0.995 vs. Standard Visium
Critically, DESI imaging does not perturb the transcriptomic readout. When DESI+ST sections were compared against standard ST on adjacent serial sections from the same tissue block, the correlation coefficient for UMI counts per gene exceeded 0.995 for both breast and lung cancer specimens. UMAP clustering revealed identical spatial domains between workflows, confirming that DESI does not introduce spatial bias in gene expression. The distributions of UMIs per spot and genes per spot were virtually superimposable between DESI+ST and standard ST.
Multi-Omic Discovery: 6,075 Transcript-Metabolite Correlations
The power of same-section multi-omics lies in the ability to correlate metabolite abundance with gene expression at matched spatial locations — without the confounder of section-to-section variability. Godfrey et al. identified 6,075 transcript-metabolite correlations (|r| > 0.5) across 980 mRNA transcripts and 133 metabolites in breast cancer tissue, with 103 high-confidence correlations at |r| > 0.7.
Among the most biologically informative findings: glycerophosphoethanolamine (GPEA) was positively correlated with XBP1 expression (r = 0.82), a transcription factor known to drive lipid biosynthesis in breast cancer; GPEA also correlated with FOXA1 (r = 0.72), a pioneer transcription factor implicated in lipid metabolism reprogramming; and phosphatidylinositol PI(18:0_18:1) correlated with CXCL14 (r = 0.62), linking membrane lipid remodeling to immune signaling in the tumor microenvironment.
Practical Considerations for Implementing DESI+ST Workflows
Investigators seeking to adopt this workflow should note several practical requirements. First, 100% methanol must be used as the DESI spray solvent — other solvent compositions have not been validated for RNA preservation and may cause degradation. Second, DESI acquisition time should be minimized where possible; while 30-60 minutes of ambient exposure is tolerable, extended acquisitions (>2 hours) may compromise RNA quality. Third, the Visium slide must be desiccated and stored at -80°C immediately after DESI acquisition if the Visium protocol cannot proceed on the same day. Fourth, spatial co-registration requires the fiducial markers on the Visium capture area to be clearly visible in post-DESI brightfield imaging; excessive tissue damage from the spray must be avoided. Fifth, the methanol fixation step of the standard Visium protocol can be omitted, as DESI has already performed this function.
This same-section approach is not achievable with MALDI-MSI, which requires matrix deposition and high-vacuum conditions that are incompatible with RNA preservation. For researchers pursuing single-cell resolution in spatial metabolomics, our guide on single-cell spatial metabolomics covers platforms including t-MALDI-2, NanoSIMS, and TEMI tissue expansion that extend MSI to subcellular resolution. DESI's ambient, matrix-free operation is the enabling feature that makes same-section spatial multi-omics possible, positioning DESI-MSI as a natural front-end for MS-based Spatial Proteomics Service workflows and integrated multi-omics studies.
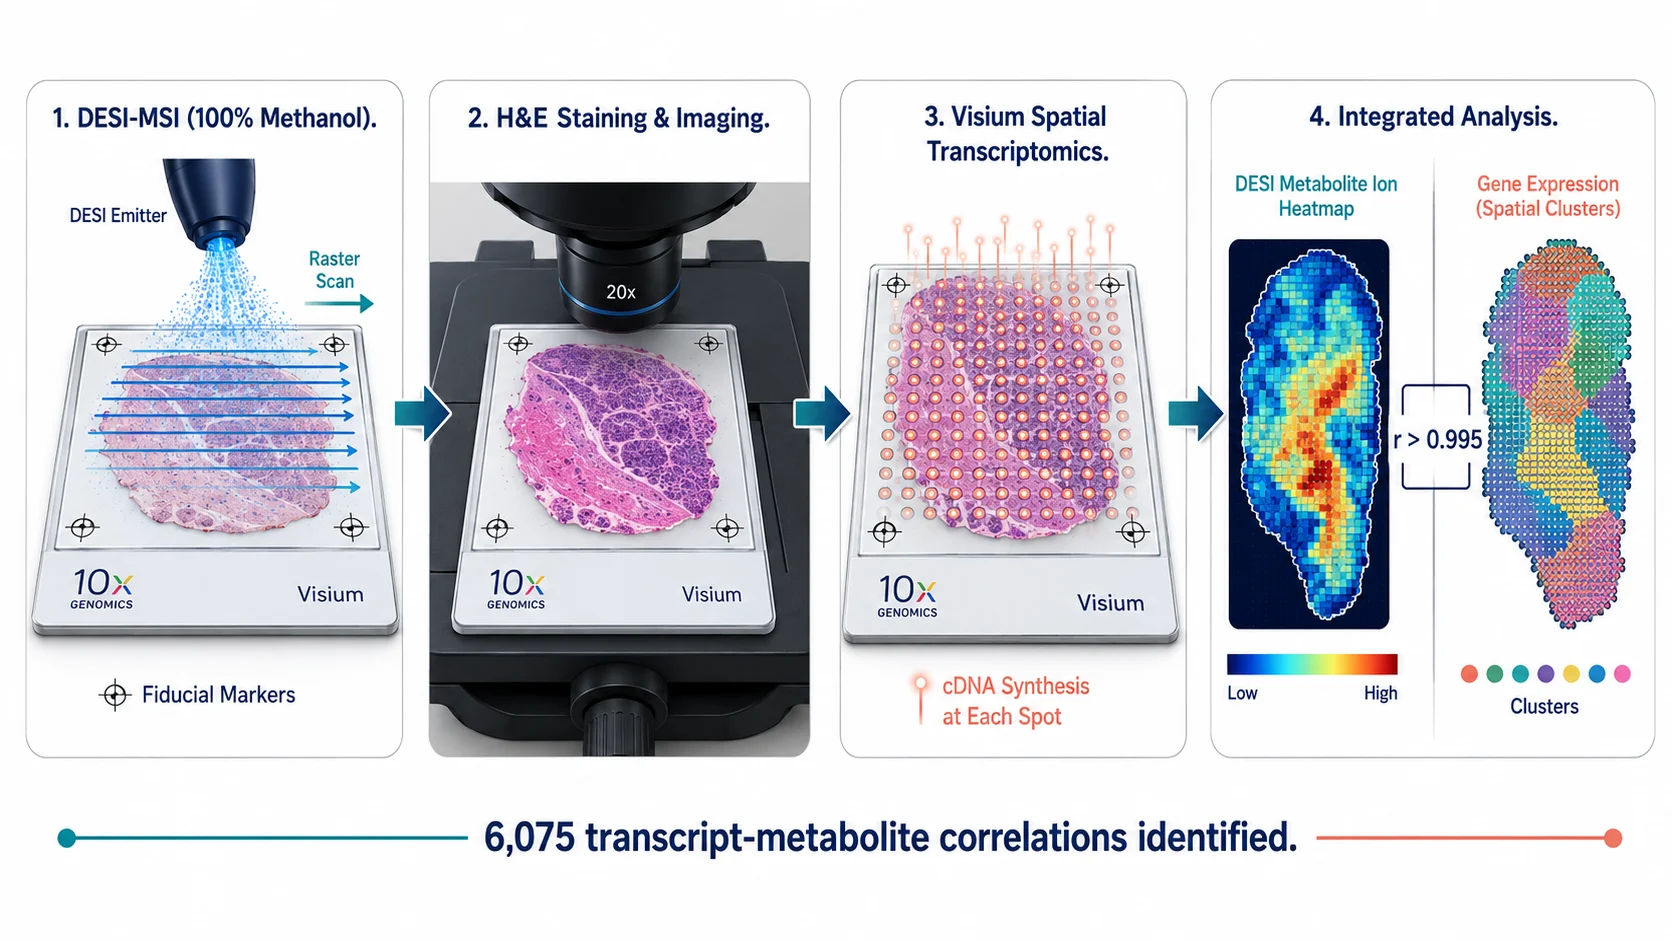 Figure 3: DESI + Visium Same-Section Multi-Omics Workflow. Horizontal workflow diagram of the Godfrey, Eberlin et al. (2025) same-section protocol: (1) fresh-frozen tissue section mounted on a Visium slide with fiducial markers; (2) DESI-MSI acquisition at 100 μm resolution using 100% methanol as spray solvent — simultaneously serving as the fixation step; (3) H&E staining and brightfield imaging; (4) standard Visium spatial transcriptomics protocol (permeabilization, cDNA synthesis, library preparation, sequencing); (5) computational co-registration of DESI metabolite maps with Visium gene expression spots using slide fiducial markers. An inset data panel shows the key QC metrics: RIN 8.6-9.5 post-DESI, sequencing correlation >0.995 vs. standard Visium, and 6,075 transcript-metabolite correlations identified.
Isomer-Selective DESI Imaging (iMSI)
The Isomer Challenge in Conventional MSI
A fundamental limitation of conventional MSI is that mass spectrometers separate ions by mass-to-charge ratio (m/z) — they cannot distinguish between structural isomers that share the same molecular formula. In lipid biology, isomerism is pervasive: the position of a single double bond in a fatty acyl chain (e.g., oleic acid vs. cis-vaccenic acid, both C18:1), the sn-1 vs. sn-2 substitution position on the glycerol backbone, or the stereochemistry of a hydroxyl group can determine a lipid's biological function. Conventional DESI-MSI, even on a high-resolution mass spectrometer capable of resolving sub-ppm mass differences, sees all isomers of a given m/z as a single signal — producing an image that conflates functionally distinct molecular species.
Nano-DESI + MRM for Targeted Isomer Imaging
Nano-DESI MSI coupled with multiple reaction monitoring (MRM) on a triple quadrupole mass spectrometer provides one solution to the isomer problem. MRM isolates a precursor ion, fragments it via collision-induced dissociation (CID), and monitors one or more structure-specific product ions — a combination called a "transition." Because different isomers produce different fragmentation patterns, MRM transitions can be designed to be isomer-specific.
Amer, Laskin, and colleagues at Purdue University have pioneered this approach, termed isomer-selective MSI (iMSI). In a representative application, they designed MRM transitions to image individual plasmalogen species in mouse brain tissue, resolving 38 plasmalogen species — some differing by only 0.1 millidalton in exact mass and several absent from the LIPID MAPS database. This level of chemical specificity would require >8 million mass resolving power on MS1 alone, far beyond any commercial instrument. MRM-based iMSI achieves it through gas-phase chemistry rather than mass resolution.
Photoinitiated Derivatization and TIMS Coupling
Beyond MRM, two complementary strategies expand the scope of isomer-selective DESI imaging. Photoinitiated derivatization uses UV light to trigger specific chemical reactions on carbon-carbon double bonds, producing diagnostic mass shifts that report double-bond position. When incorporated into the DESI spray solvent, photoreactive compounds react with unsaturated lipids during the millisecond desorption event, enabling double-bond positional isomer imaging directly from tissue.
Trapped ion mobility spectrometry (TIMS) provides an orthogonal dimension of gas-phase separation. TIMS separates ions based on their collision cross-section (CCS) — a measure of molecular shape — before mass analysis. Lipid isomers that co-isolate at the same m/z often have measurably different CCS values due to differences in double-bond geometry or acyl chain branching. Coupling nano-DESI with TIMS-MS achieves ion mobility resolving power >250, sufficient to separate many lipid isomer classes. The combination of TIMS (shape-based separation) with MRM (fragment-based identification) and photoinitiated derivatization (bond-position labeling) represents the current state of the art for isomer-resolved spatial lipidomics.
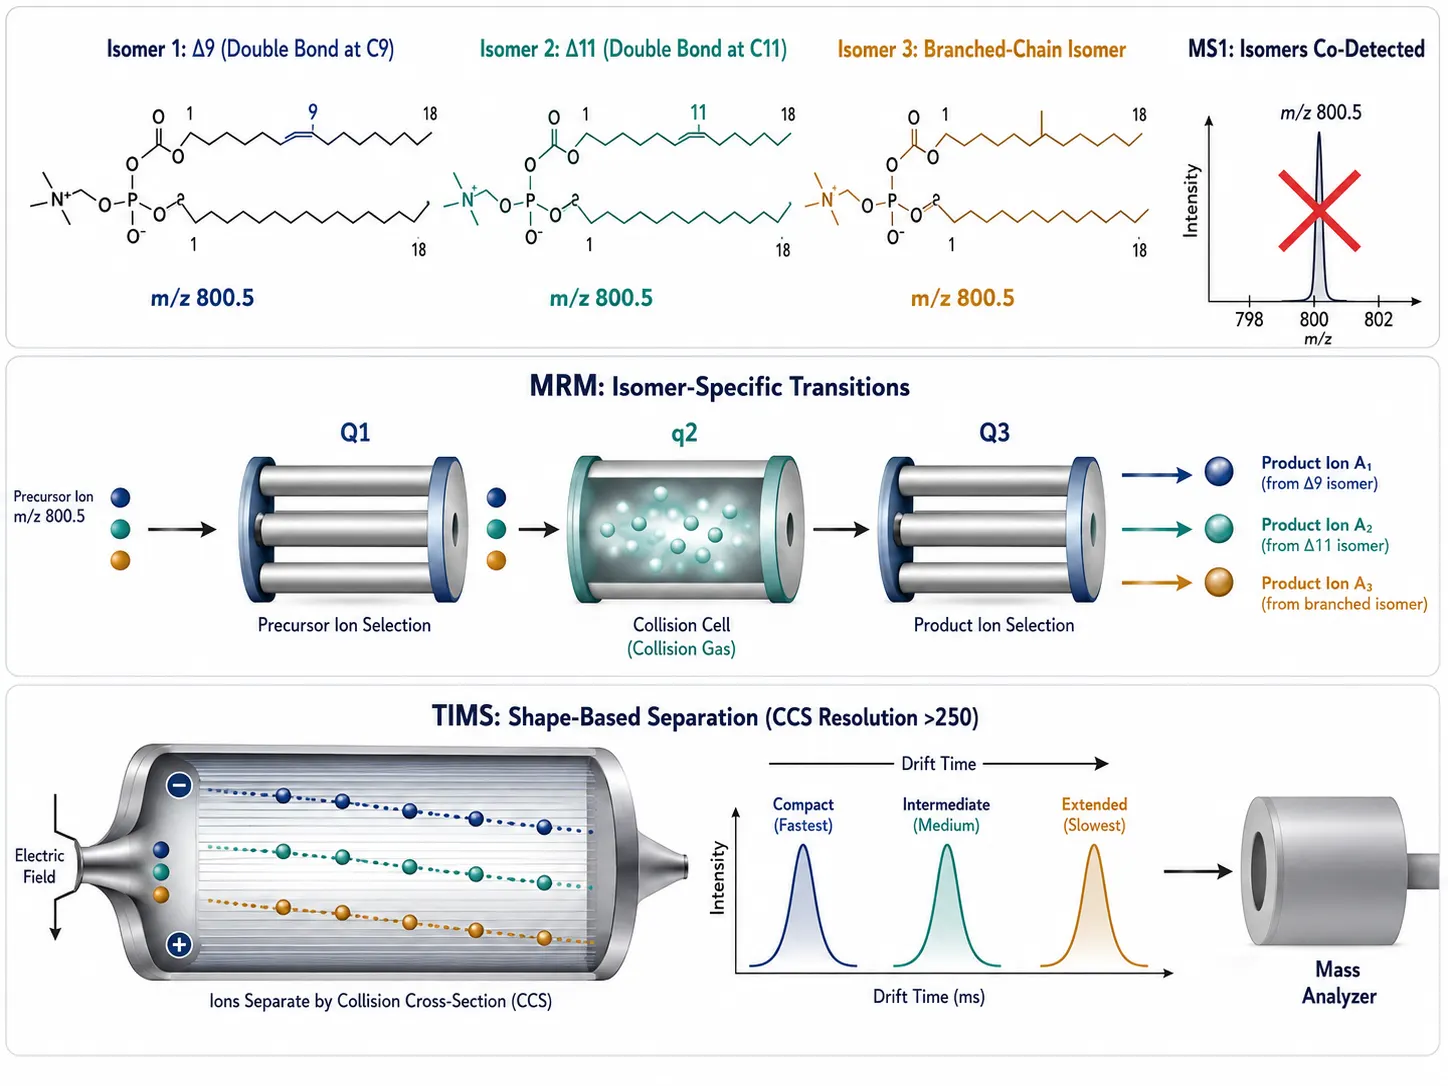 Figure 4: Isomer-Selective MSI (iMSI) Concept — MRM + TIMS for Lipid Isomers. Three-panel conceptual diagram illustrating the multi-pronged approach to resolving lipid isomers in DESI-MSI: (top) Nano-DESI + MRM on a triple quadrupole — precursor ion isolation, collision-induced dissociation, and monitoring of structure-specific product ion transitions that distinguish isomers by their fragmentation patterns; (middle) TIMS — trapped ion mobility spectrometry separating ions by collision cross-section (CCS) before mass analysis, with a schematic showing two lipid isomers with identical m/z but different CCS values traversing the mobility cell at different drift times; (bottom) photoinitiated derivatization — UV-triggered reaction at carbon-carbon double bonds producing diagnostic mass shifts that report double-bond position directly from tissue during the millisecond desorption event.
DESI Data Acquisition and Analysis
High-Throughput DESI: Above 2 Samples per Second in 96-Well Format
While DESI-MSI is most commonly performed on tissue sections, the technique also supports high-throughput analysis of samples arrayed on planar surfaces. In this format, samples (tissue extracts, biofluids, cell lysates) are spotted onto a 96-well grid on a glass slide or PTFE-coated surface, and DESI-MS rapidly samples each spot in sequence. Modern implementations achieve sampling rates exceeding 2 spots per second, with detection limits in the low nanogram range. This throughput makes DESI competitive with conventional LC-MS for screening applications where chromatographic separation is not required — such as reaction monitoring, phenotype screening, and rapid quality control.
Software Platforms and Histology Co-Registration
After DESI-MSI acquisition, raw data must be converted into spatially resolved ion images that can be overlaid with histology. Open-source platforms including MSiReader, Cardinal, and SCiLS Lab provide comprehensive DESI data analysis workflows: baseline correction, peak picking, normalization (TIC, RMS, or internal standard-based), and image generation. For researchers requiring specialized data processing beyond these platforms, bioinformatics for metabolomics services can provide custom pipeline development including spatial statistics, pathway enrichment, and multi-omic integration. For DESI+Visium integration, dedicated software such as Aspect Analytics' Weave platform enables co-registration of DESI metabolite images with Visium spatial gene expression data using the Visium slide fiducial markers as spatial anchors.
A key practical consideration: DESI generates rectangular pixels (determined by scan speed in x and step size in y), while histology images are continuous. Co-registration requires interpolation of MSI data onto the histological coordinate system, and the choice of interpolation algorithm (nearest neighbor vs. bilinear vs. thin-plate spline) can affect apparent spatial correlations. Nearest-neighbor interpolation is the most conservative choice for preserving quantitative accuracy, while thin-plate splines produce visually smoother overlays at the cost of potential quantitative distortion.
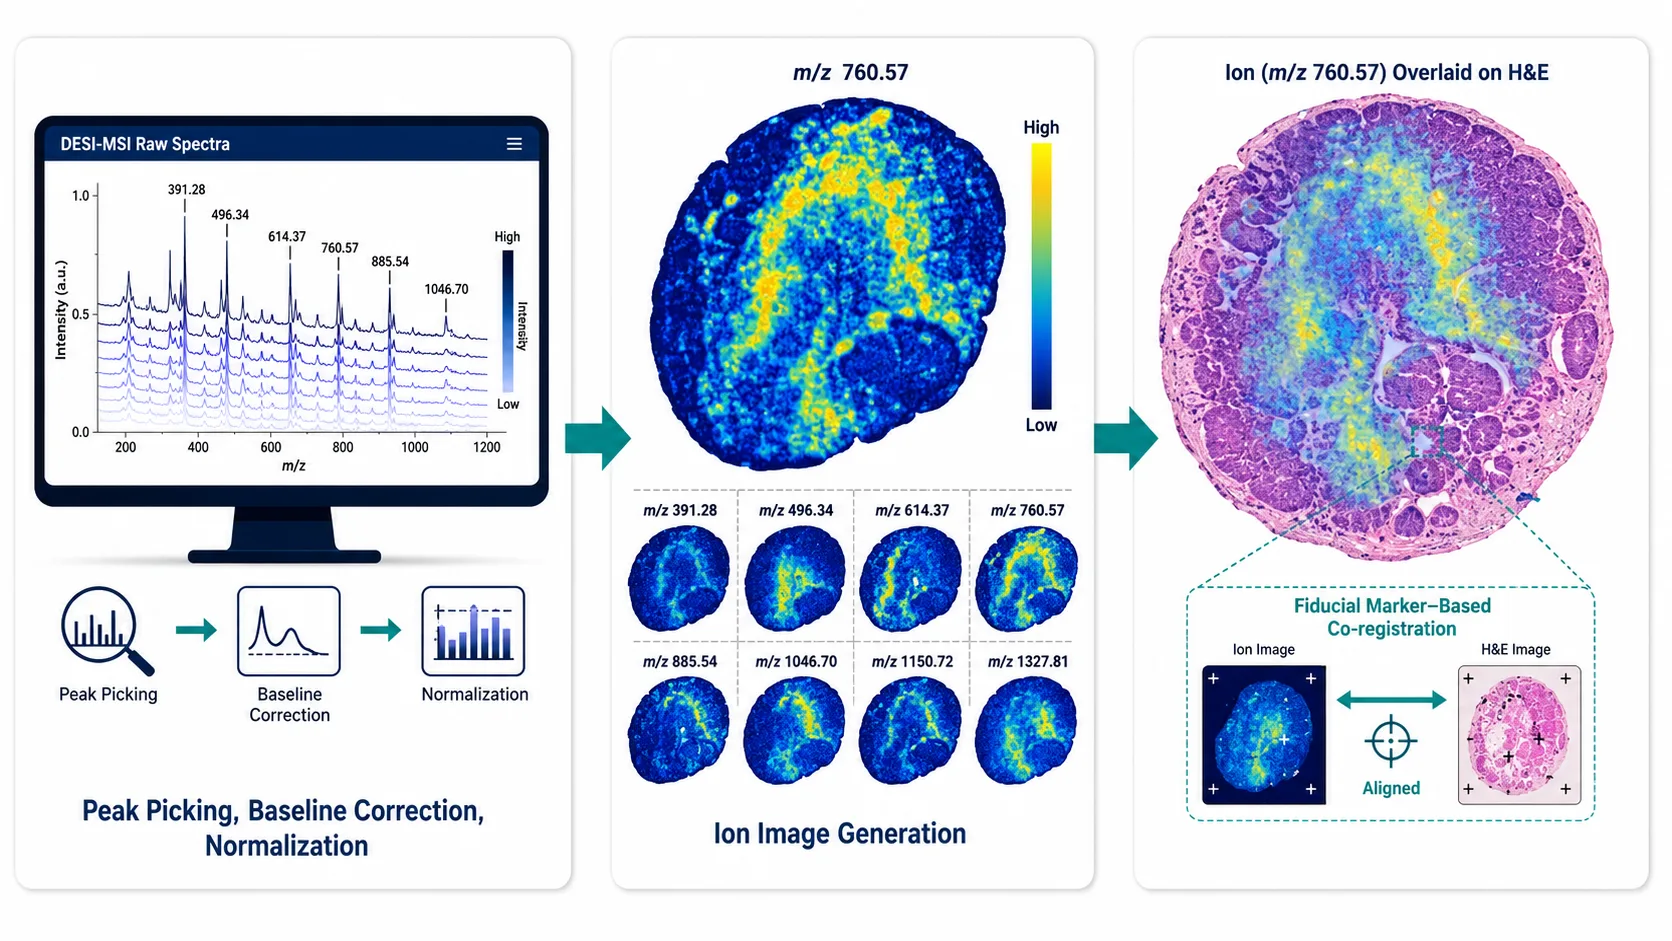 Figure 5: DESI Data Analysis Pipeline with Histology Co-Registration. Five-stage horizontal workflow: (1) Raw DESI-MSI acquisition generating a 3D data cube (x, y, m/z, intensity) with rectangular pixels; (2) preprocessing — baseline correction, peak picking, normalization (TIC/RMS/internal standard); (3) ion image generation for individual m/z features rendered as spatial heatmaps; (4) histology co-registration — computational overlay of MSI ion images onto the H&E-stained tissue section using interpolation (nearest-neighbor for quantitative accuracy, thin-plate spline for visual smoothness); (5) biological interpretation with annotated tissue regions. Software platforms (MSiReader, Cardinal, SCiLS Lab, Weave) are listed beneath their respective pipeline stages.
Key DESI Applications
Intraoperative Cancer Margin Assessment
The most clinically advanced application of DESI-MSI is intraoperative surgical margin assessment. During cancer resection, surgeons face a fundamental dilemma: remove too little tissue and leave residual disease; remove too much and sacrifice healthy function. Frozen-section histopathology — the current gold standard for intraoperative margin guidance — requires 20-30 minutes per sample, samples only a small fraction of the resection surface, and depends on subjective histomorphological interpretation.
DESI-MSI addresses these limitations by providing objective, molecular-level tissue classification in near-real time. The workflow: a small tissue smear or touch imprint is prepared from the resection margin, analyzed by DESI-MS for 1-3 minutes, and the resulting mass spectrum is classified as "tumor" or "non-tumor" by a pre-trained statistical model (typically PCA-LDA or a random forest classifier). The molecular basis for classification lies in the well-documented metabolic reprogramming of cancer cells — elevated phospholipids, altered fatty acid profiles, depletion of specific small metabolites — that produces a diagnostic mass spectral signature.
In external research settings, validation is advancing rapidly. A prospective trial at Mayo Clinic (NCT06387979) led by Dr. Alfredo Quiñones-Hinojosa is evaluating DESI-MS for intraoperative molecular diagnosis of brain cancer in 285 patients, with primary completion expected in October 2026. The trial monitors N-acetylaspartate (NAA) depletion and 2-hydroxyglutarate (2HG) accumulation — the latter a direct metabolic marker of IDH-mutant gliomas. Earlier studies have demonstrated 94-97% diagnostic accuracy for DESI-MS discrimination of tumor vs. non-tumor tissue across brain, breast, gastric, pancreatic, and head and neck cancers.
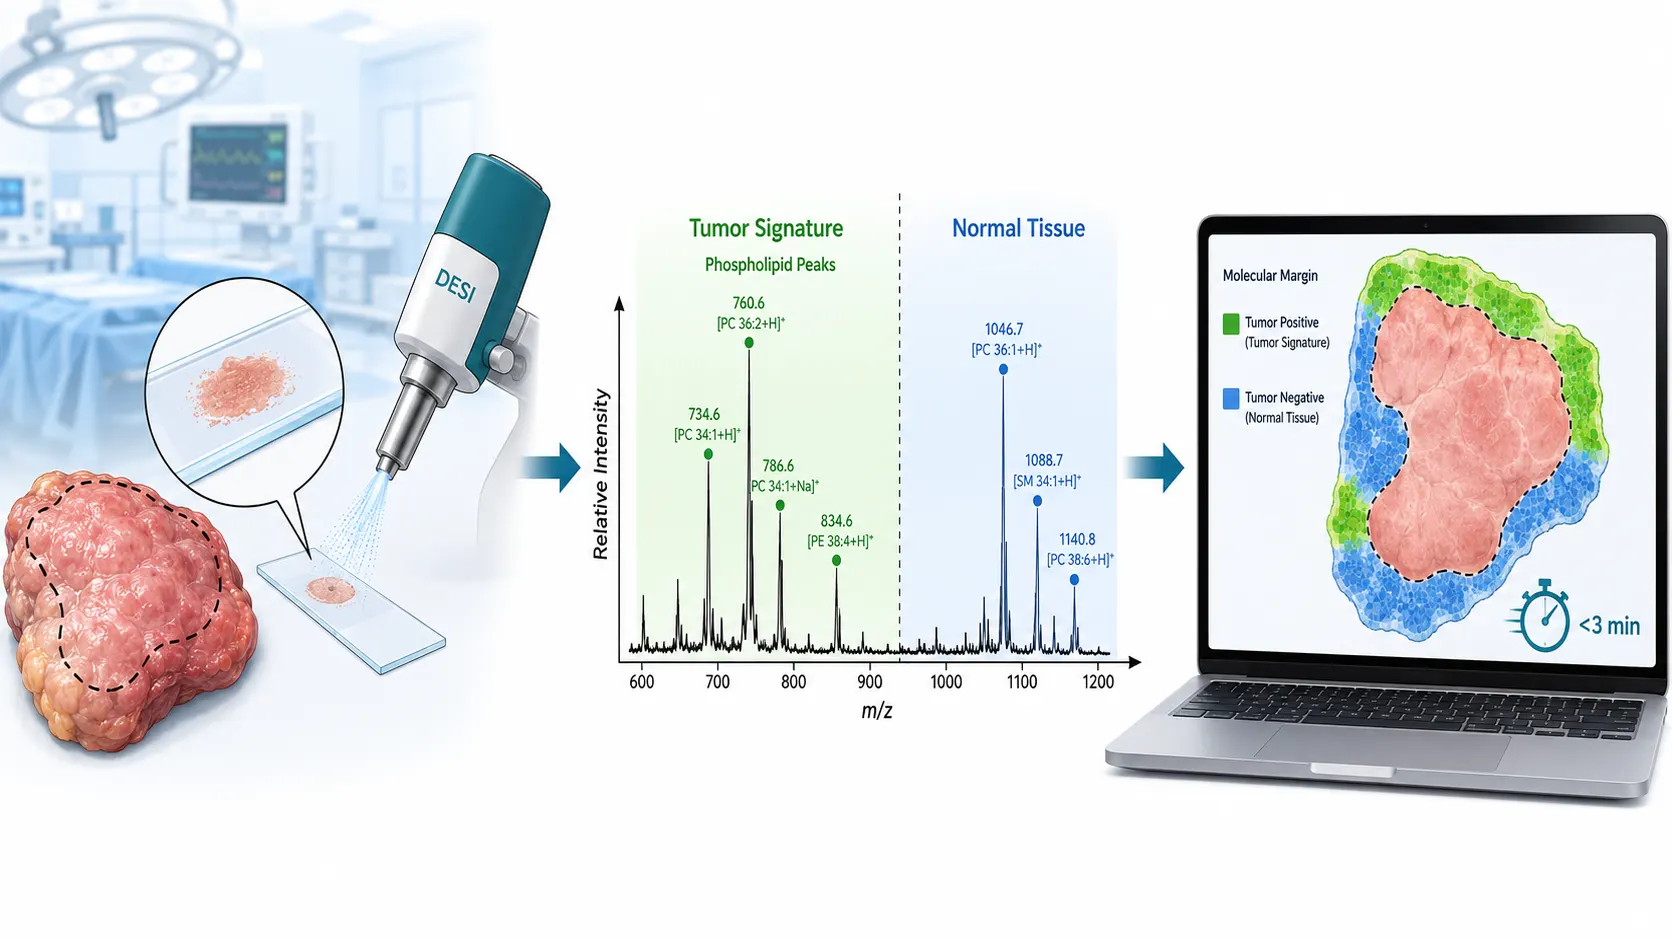 Figure 6: DESI-MSI for Intraoperative Cancer Margin Assessment. Schematic of the intraoperative DESI-MS workflow: (left) surgeon resects tumor and prepares a tissue smear from the resection margin; (center) DESI-MS analyzes the smear in 1-3 minutes, generating a diagnostic mass spectrum with characteristic tumor-associated lipid profiles (elevated phospholipids, altered fatty acid profiles); (right) a pre-trained PCA-LDA or random forest classifier outputs a "tumor" vs. "non-tumor" classification displayed on-screen in near-real time. An inset shows representative spectra comparing NAA depletion and 2HG accumulation in IDH-mutant glioma — the metabolic markers being evaluated in the ongoing Mayo Clinic trial (NCT06387979, n=285). Diagnostic accuracy rates of 94-97% from published studies across brain, breast, and pancreatic cancers are summarized in a callout.
Neuropathology and Brain Lipid Mapping
Brain tissue is exceptionally lipid-rich — lipids constitute approximately 50% of the brain's dry weight — making it an ideal target for DESI-MSI's lipid-detection strengths. DESI has been used to map regional lipid distributions across brain substructures (cortex, hippocampus, striatum, cerebellum, white matter tracts) with lipid-class specificity. In neurodegenerative disease research, nano-DESI MSI has revealed phospholipid accumulation within and around amyloid-beta plaques in Alzheimer's disease mouse models, implicating local membrane remodeling in plaque pathology — a finding that complements MALDI-imaging lipidomics studies of the same tissue regions. In the Scn2a-deficient mouse model of epilepsy and autism, nano-DESI profiling identified region-specific alterations in ether-linked phosphatidylethanolamines, linking lipid metabolism to neuronal excitability.
Drug Distribution Without Matrix Interference
A unique strength of DESI-MSI for pharmaceutical applications is its ability to image drug compounds without the confounding effects of an organic matrix. In MALDI-MSI, the matrix produces abundant low-mass ions (m/z < 500) that can obscure small-molecule drug signals. DESI's matrix-free operation eliminates this interference, making it the preferred ionization technique for imaging small-molecule drugs (most of which fall below m/z 500) and their metabolites directly from tissue sections. For comprehensive characterization, DESI imaging data can be correlated with LC-MS/MS untargeted metabolomics performed on tissue extracts from adjacent sections, combining spatial localization with quantitative accuracy. This capability is routinely applied in preclinical drug development to assess tumor penetration, blood-brain barrier crossing, and tissue-specific accumulation — all without the need for radiolabeling — as detailed in our guide on spatial drug distribution by mass spectrometry imaging.
Plant and Natural Product Imaging
DESI-MSI has found extensive use in plant biology, where the absence of a matrix is particularly valuable for detecting labile secondary metabolites. DESI can map the spatial distribution of alkaloids, flavonoids, terpenoids, and other specialized metabolites across plant tissues (leaves, roots, stems, seeds), revealing tissue-specific and cell-type-specific accumulation patterns. TLC-DESI coupling provides a rapid workflow for natural product discovery: TLC separates crude plant extracts, and DESI-MS directly interrogates each TLC band for molecular identification without the need for compound isolation.
DESI vs. MALDI: Choosing the Right Ionization Approach
Head-to-Head Comparison
A 2025 study by Slijkhuis and colleagues at Erasmus MC provided the most systematic head-to-head comparison of DESI and MALDI mass spectrometry imaging for tissue lipid imaging, using the same human atherosclerotic plaque sections on the same SYNAPT XS mass spectrometer. Their findings clarify the complementarity of the two techniques.
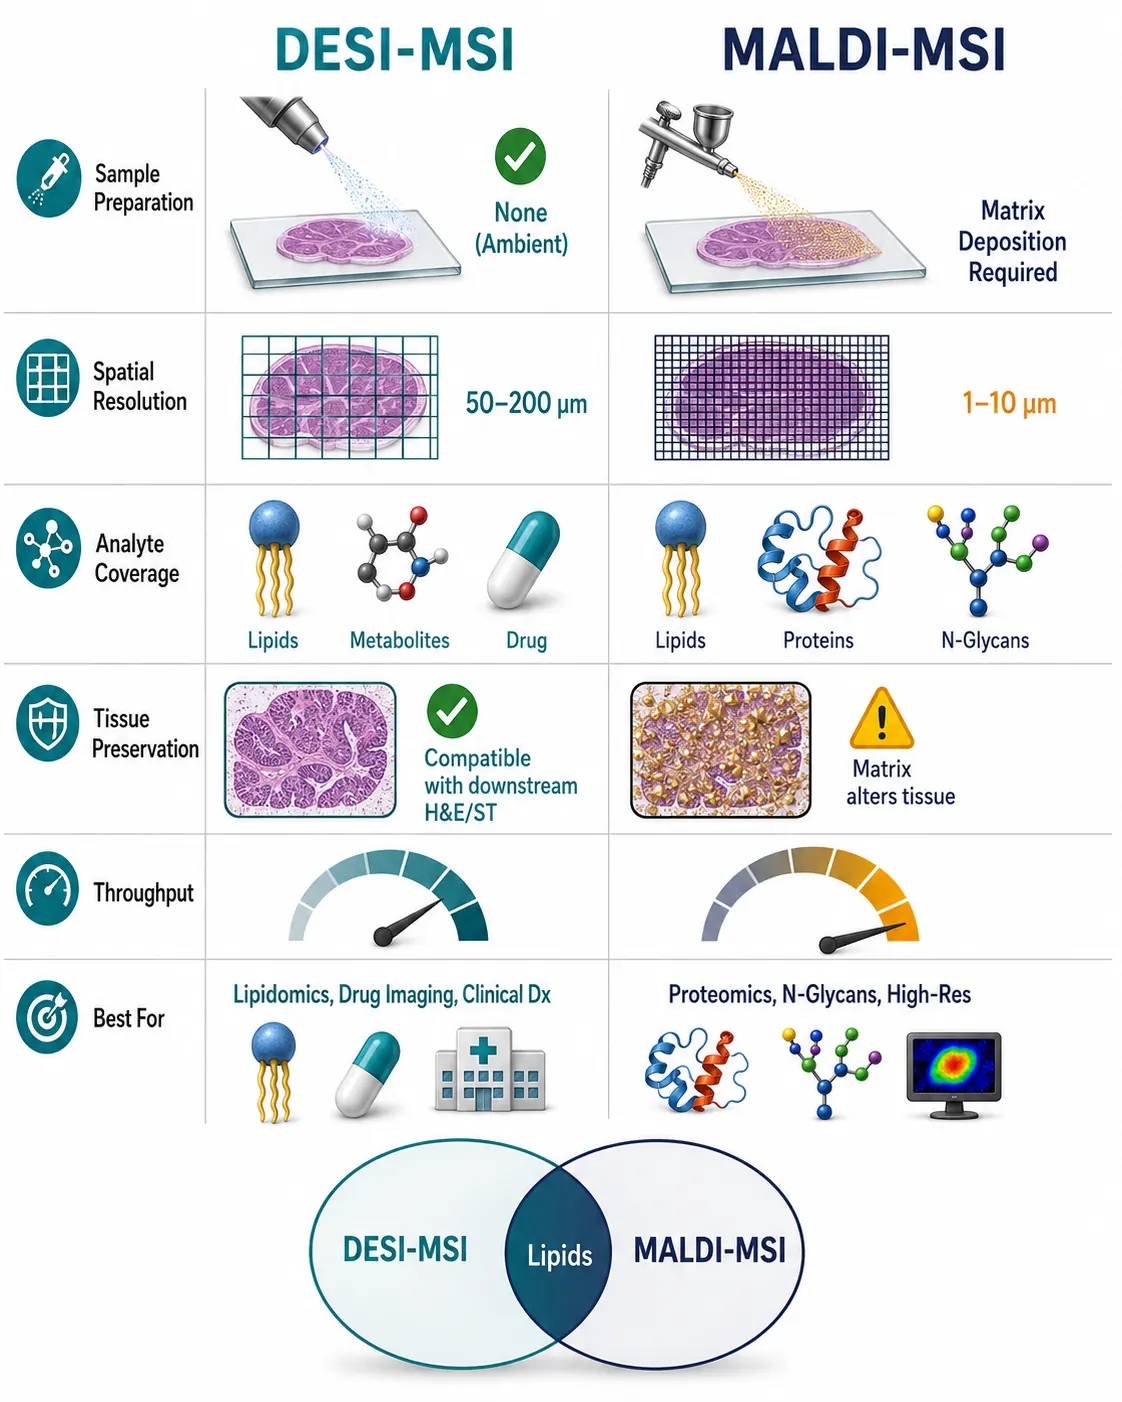 Figure 7: DESI vs MALDI Comparison Matrix — Head-to-Head Infographic. A head-to-head radar chart and side-by-side comparison of DESI-MSI and MALDI-MSI across six dimensions: spatial resolution (MALDI: 5-50 μm; DESI: 50-200 μm), molecular coverage (MALDI: lipids + proteins + N-glycans; DESI: lipids + metabolites + small drugs), sample integrity (DESI wins — ambient, no matrix, same-section omics compatible), matrix interference (DESI wins — no low-mass matrix peaks), throughput (MALDI wins — 10 kHz lasers), and quantitative accuracy (comparable with proper calibration). The Slijkhuis et al. (2025) head-to-head atherosclerotic plaque data is summarized: DESI showed higher ion counts for most lipid classes and sharper images; MALDI detected more ceramide and hexosylceramide species via in-source dehydration. A "Choose DESI When / Choose MALDI When" decision summary anchors the bottom of the infographic.
In positive ion mode, DESI-MSI exhibited higher ion counts for most lipid classes and produced visibly sharper images with better tissue feature delineation. MALDI-MSI detected more ceramide and hexosylceramide species due to efficient in-source dehydration of these lipid classes, which generates the diagnostic dehydrated ion. DESI, operating under gentler ionization conditions, showed reduced fragmentation and consequently higher sensitivity for cholesteryl esters and triacylglycerides — lipid classes that readily fragment during MALDI.
The fundamental trade-off: MALDI, assisted by the energy-absorbing matrix, desorbs and ionizes a broader range of molecular classes including proteins, peptides, and N-glycans. DESI, lacking a matrix, is restricted to molecules that can be extracted from the tissue surface by the spray solvent — predominantly lipids, metabolites, and small drugs. But within this detection space, DESI often provides superior sensitivity and image quality because there is no matrix to compete for charge or obscure tissue features.
When DESI Wins; When MALDI Wins
Choose DESI when:
- The analyte class is lipids, metabolites, or small-molecule drugs
- Matrix interference would obscure the analytical signal (especially for low-m/z drugs)
- Sample integrity must be preserved for downstream analysis (same-section transcriptomics, H&E, IHC)
- Ambient or near-physiological conditions are required (live-cell analysis, clinical intraoperative use)
- The sample is incompatible with matrix application (irregular surfaces, precious archival specimens)
- Reduced in-source fragmentation of labile lipids is critical
Choose MALDI when:
- The target analytes are proteins, peptides, or N-glycans
- Subcellular spatial resolution (<10 μm) is required
- Ceramide or sphingolipid-focused profiling is the primary goal
- Higher throughput is needed for large cohort studies
- The sample is already prepared in a MALDI-compatible format (matrix-coated slides, tissue microarrays)
In many advanced spatial biology workflows, DESI and MALDI are not competitors but complementary tools used on adjacent sections from the same tissue block to maximize molecular coverage — DESI for lipids and metabolites, MALDI for proteins and N-glycans.
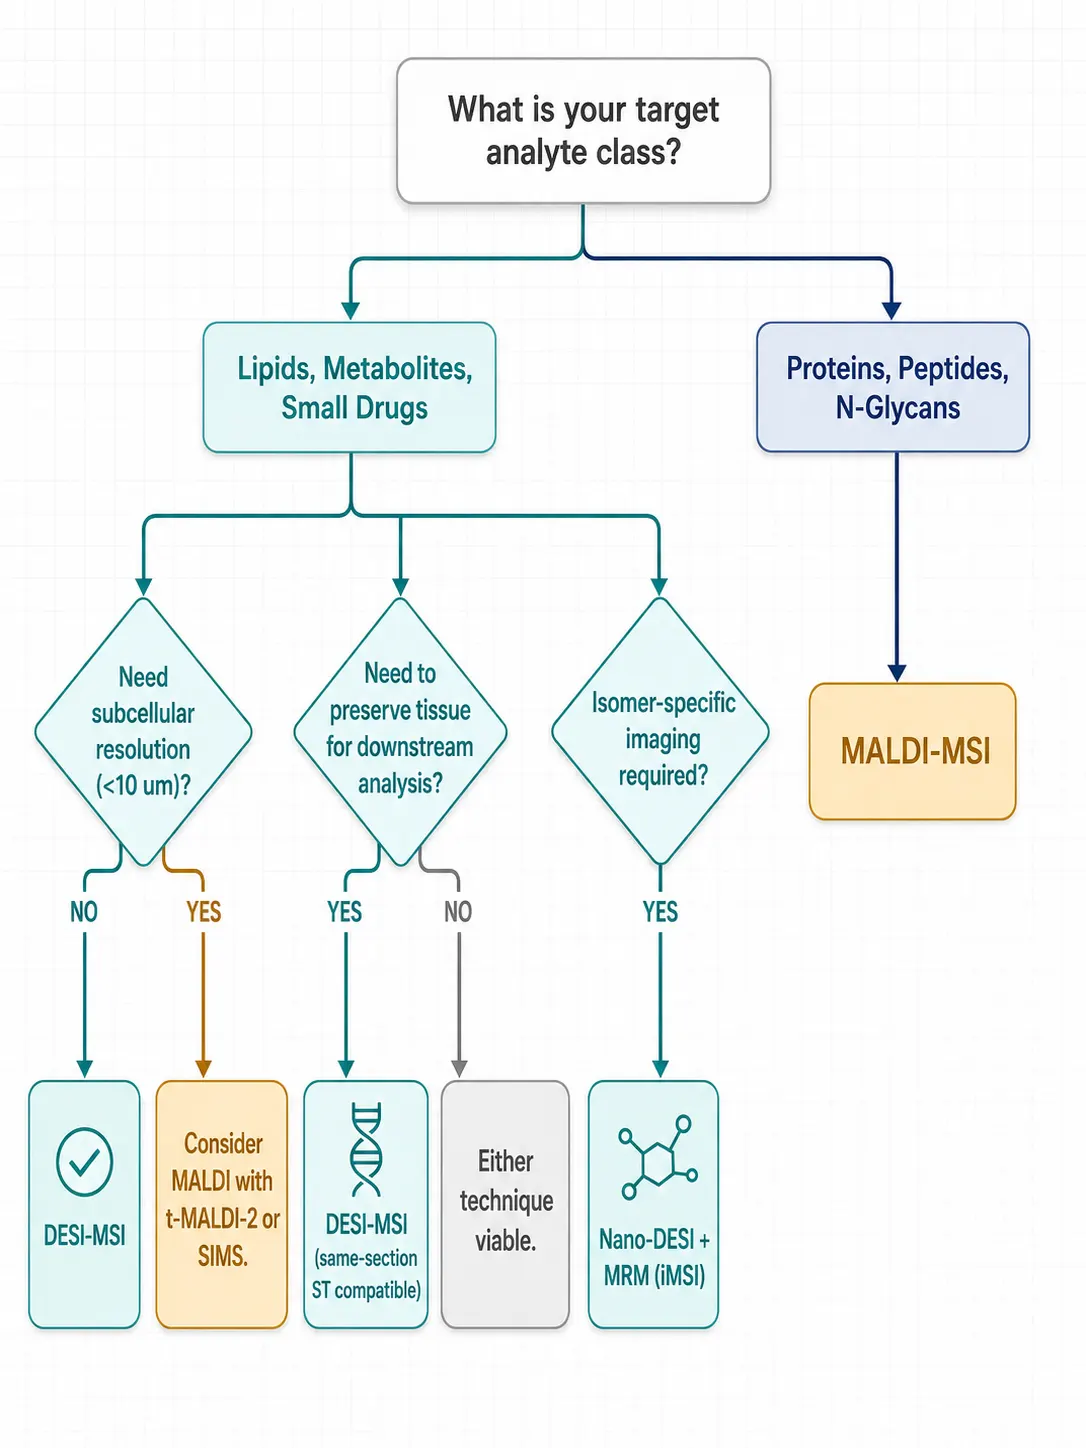 Figure 8: Decision Flowchart — DESI or MALDI for Your Research Question. A branching decision tree that operationalizes the DESI vs. MALDI selection logic. Starting from the research question, the first branch separates by analyte class (lipids/metabolites/drugs → DESI path; proteins/peptides/N-glycans → MALDI path). For the DESI path, secondary branches guide variant selection: whole-tissue survey or clinical throughput → standard DESI; sub-50 μm resolution or isomer selectivity → nano-DESI; whole-body drug imaging → AFA-DESI. For the MALDI path, secondary branches address resolution requirements (<10 μm → t-MALDI-2), matrix selection (lipid-focused → DHB; polar metabolites → CHCA or 9-AA), and throughput needs. Terminal nodes include practical notes on sample preparation, downstream compatibility, and acquisition time estimates.
Troubleshooting Common DESI-MSI Issues
Low Signal or No Signal: Check the basic alignment first — sprayer position, collection angle, and MS inlet distance are sensitive parameters that drift over time. Verify that the spray is stable (visible as a symmetrical spray plume on the surface). If alignment is correct, optimize solvent composition: increase organic content for lipids, increase aqueous content for polar metabolites, and consider additive doping (Ag+, NH4F, betaine aldehyde) for recalcitrant analyte classes. Ensure the tissue section is adequately desiccated; residual water can suppress ionization.
Analyte Delocalization: The most common image quality problem in DESI-MSI is analyte delocalization — the spreading of soluble analytes beyond their native tissue location by the solvent film. Reduce the solvent flow rate (lower flow = smaller liquid film), increase the organic fraction of the spray solvent (reduces surface tension and lateral spreading), and increase scan speed (less solvent per unit area). If delocalization persists, switch to nano-DESI, where the liquid microjunction confines extraction to a smaller area.
Spray Instability and Signal Fluctuation: Erratic spray causes streaky images and fluctuating ion signals. Common causes: partially clogged sprayer emitter (flush or replace), inconsistent nebulizing gas pressure (check regulator), or uneven tissue surface (ensure tissue is flat and fully adhered to the slide). A short spray stabilization period (5-10 minutes) before starting acquisition allows flow rates and spray geometry to equilibrate.
Poor Image Resolution: Ensure the step size between adjacent line scans matches the spray spot diameter. If image features appear blurred in the scan direction (x-axis), increase scan speed relative to acquisition rate. If blurring appears perpendicular to scan direction (y-axis), reduce step size or reduce spray spot diameter through gas flow optimization.
All DESI mass spectrometry imaging metabolomics services described in this article are provided for Research Use Only (RUO). These workflows are not intended for diagnostic, therapeutic, or clinical decision-making purposes.
FAQ
Q: What is the main advantage of DESI-MSI over MALDI-MSI?
A: DESI requires no matrix, operates under ambient conditions, and preserves tissue integrity for downstream analysis including H&E staining, immunohistochemistry, and even spatial transcriptomics on the same section. It provides gentler ionization with less fragmentation, particularly benefiting intact lipid and drug detection.
Q: Can DESI-MSI achieve single-cell resolution?
A: Standard DESI cannot — its practical resolution floor is approximately 50 μm. However, nano-DESI can achieve 20-50 μm resolution suitable for larger cell types, and ultralow-flow-rate DESI (u-DESI) has demonstrated single-islet resolution in pancreas. For true single-cell MSI (<10 μm), MALDI with t-MALDI-2 post-ionization and SIMS are more appropriate technologies.
Q: Does DESI damage the tissue? Can I do H&E after DESI?
A: DESI causes minimal tissue damage — the methanol spray effectively functions as a fixation step. H&E staining after DESI-MSI produces histology of diagnostic quality, and RNA extracted from DESI-imaged tissue retains RIN values of 8.6-9.5, sufficient for spatial transcriptomics.
Q: What types of molecules can DESI-MSI detect?
A: DESI excels at detecting lipids (phospholipids, glycerolipids, sphingolipids, cholesteryl esters, fatty acids), small metabolites (amino acids, organic acids, nucleotides, sugars), and small-molecule drugs and their metabolites. It is less effective for proteins above approximately 15 kDa and cannot detect N-glycans released from proteins.
Q: How do I choose between nano-DESI and standard DESI?
A: Choose nano-DESI when spatial resolution below 50 μm is needed or when coupling with MRM for isomer-selective imaging. Choose standard DESI for whole-tissue survey imaging, clinical applications requiring throughput, and when the target spatial resolution of 100-200 μm is acceptable.
Q: Can DESI-MSI be quantitative?
A: DESI is inherently less quantitative than LC-MS due to variable extraction efficiency across different tissue types and the absence of chromatographic separation. However, relative quantification (comparing the same analyte across tissue regions within a single experiment) is robust. Absolute quantification requires mimetic tissue models with known analyte concentrations or on-tissue internal standard deposition — approaches adapted from quantitative mass spectrometry imaging calibration strategies.
References:
- Godfrey TM, Shanneik Y, Zhang W, Tran T, Verbeeck N, Patterson NH, Jackobs FE, Nagi C, Ramineni M, Eberlin LS. Integrating Ambient Ionization Mass Spectrometry Imaging and Spatial Transcriptomics on the Same Cancer Tissues to Identify RNA-Metabolite Correlations. Angew Chem Int Ed. 2025;64(24):e202502028. doi:10.1002/anie.202502028
- Amer S, Jiang LX, Iqfath M, Weigand MR, Laskin J. Isomer-Selective Mass Spectrometry Imaging Using Nanospray Desorption Electrospray Ionization (Nano-DESI). Acc Chem Res. 2025;58(21):3281-3293. doi:10.1021/acs.accounts.5c00532
- Wang Y, Wang H, Zhang S, Xi Y, Zhang Z. Desorption Electrospray Ionization Mass Spectrometry Imaging: Principles, Advancements, and Multidisciplinary Applications. J Mass Spectrom. 2026;61(1):e70004. doi:10.1002/jms.70004
- Liu H, Huang S, Yang L, He Y, Jing Y, Xie Y, Hu B, Li Z, Bi H, Li Z. The Application of Desorption Electrospray Ionization Mass Spectrometry and Mass Spectrometry Imaging in Metabolomics, Lipidomics and Proteomics Analysis. Talanta. 2026;297:128611. doi:10.1016/j.talanta.2025.128611
- Slijkhuis N, Towers M, Claude E, van Soest G. MALDI versus DESI Mass Spectrometry Imaging of Lipids in Atherosclerotic Plaque. Rapid Commun Mass Spectrom. 2025;39(1):e9927. doi:10.1002/rcm.9927
- Shahi M, Cooks RG. Ambient Ionization Mass Spectrometry in Brain Cancer Diagnosis. J Mass Spectrom Adv Clin Lab. 2025;38:37-49. doi:10.1016/j.jmsacl.2025.10.002
- Onulov R, Georgescu M, Flangea C, Chirita-Emandi A, Serb AF. Intraoperative Mass Spectrometry in Oncology: Technologies, Clinical Applications, and Challenges. Molecules. 2026;31(8):1287. doi:10.3390/molecules31081287
- Omari KW. Desorption Electrospray Ionization Mass Spectrometry: Advances in Instrumentation, High-Throughput Analysis, and Imaging Applications. Anal Methods. 2025;17(42):8517-8532. doi:10.1039/d5ay01323b
- Zhang T, Amer S, Laskin J. Tandem Mass Spectrometry Imaging of Low-Abundance Ether Phospholipids Guided by Bulk Lipidomics Analysis. Anal Chem. 2026;98(15):6238-6247. doi:10.1021/acs.analchem.6c01209
- Yang M, Tang X, Iqfath M, Hernly E, Unsihuay D, Manchanda P, Sharma K, Qu Z, Hu H, Beveridge C, Chopra G, Laskin J. Multimodal Nano-DESI Mass Spectrometry Imaging Reveals Phospholipids Accumulation in and around Amyloid Plaques in Alzheimer's Disease. ACS Chem Neurosci. 2025;16(16):3127-3137. doi:10.1021/acschemneuro.5c00144
















