

The Resolution Revolution
Spatial metabolomics has crossed a critical threshold. Five years ago, "high spatial resolution" in mass spectrometry imaging (MSI) meant 50-100 μm — enough to resolve tissue regions but far too coarse to distinguish individual cells. Today, multiple independent platforms routinely achieve subcellular resolution: NanoSIMS at 50 nm, transmission-mode MALDI-2 at 600 nm, single-mode fiber-relay LDI at 800 nm, and tissue-expansion MSI (TEMI) that physically enlarges specimens to bypass optical limits. The field has entered the single-cell era.
Why does this matter? Bulk metabolomics — homogenizing a tissue and measuring average metabolite levels — erases the very heterogeneity that drives biological function. A tumor is not a uniform bag of metabolites; it is a mosaic of metabolically distinct clones, infiltrating immune cells with rewired lipid metabolism, and stromal cells exchanging nutrients with their neighbors. Single-cell spatial metabolomics reveals this hidden architecture: which specific cells are synthesizing fatty acids, how drug-induced apoptosis remodels the lipidome cell by cell, and where metabolic crosstalk occurs between tumor cells and astrocytes at the invasion margin.
This article surveys the MSI platforms that have broken the single-cell resolution barrier, the emerging methods for same-section multi-modal integration (MALDI + spatial transcriptomics on one tissue slice), dynamic isotope tracing at the single-cell level, and a practical framework for selecting the right platform for a given biological question. For readers seeking broader context on MSI ionization principles and standard-resolution applications, our spatial metabolomics guide and MALDI imaging workflow resource cover the fundamentals.
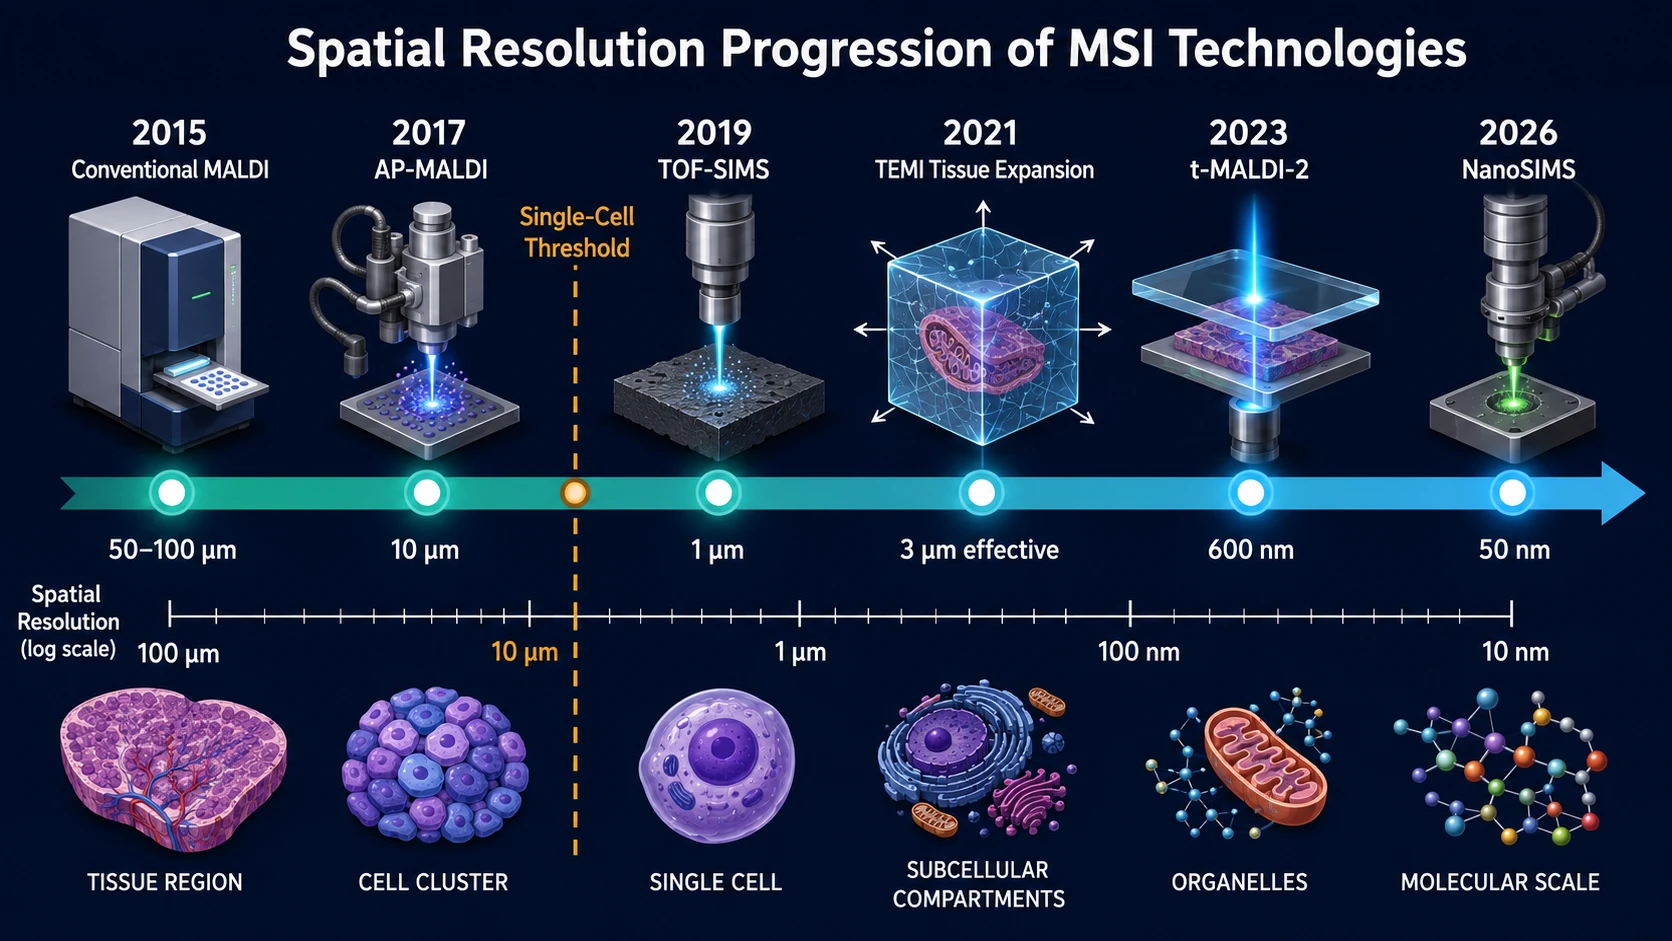 Figure 1: The Single-Cell Resolution Revolution in MSI — From Bulk Tissue to Subcellular Imaging. Conceptual timeline infographic showing the progression of spatial metabolomics resolution from bulk LC-MS tissue homogenates (mm scale, no spatial information) through conventional MALDI-MSI (~50 μm, tissue-region level) to the current single-cell era: t-MALDI-2 (600 nm), NanoSIMS (50 nm), fiber-relay LDI (800 nm), and TEMI (~3 μm effective). Each resolution milestone is annotated with the year of first demonstration and representative biological structures resolvable at that scale.
MSI Platforms at the Resolution Frontier
The single-cell MSI landscape spans five major platform categories, each occupying a distinct niche in the resolution-versus-molecular-coverage trade space (Figure 2).
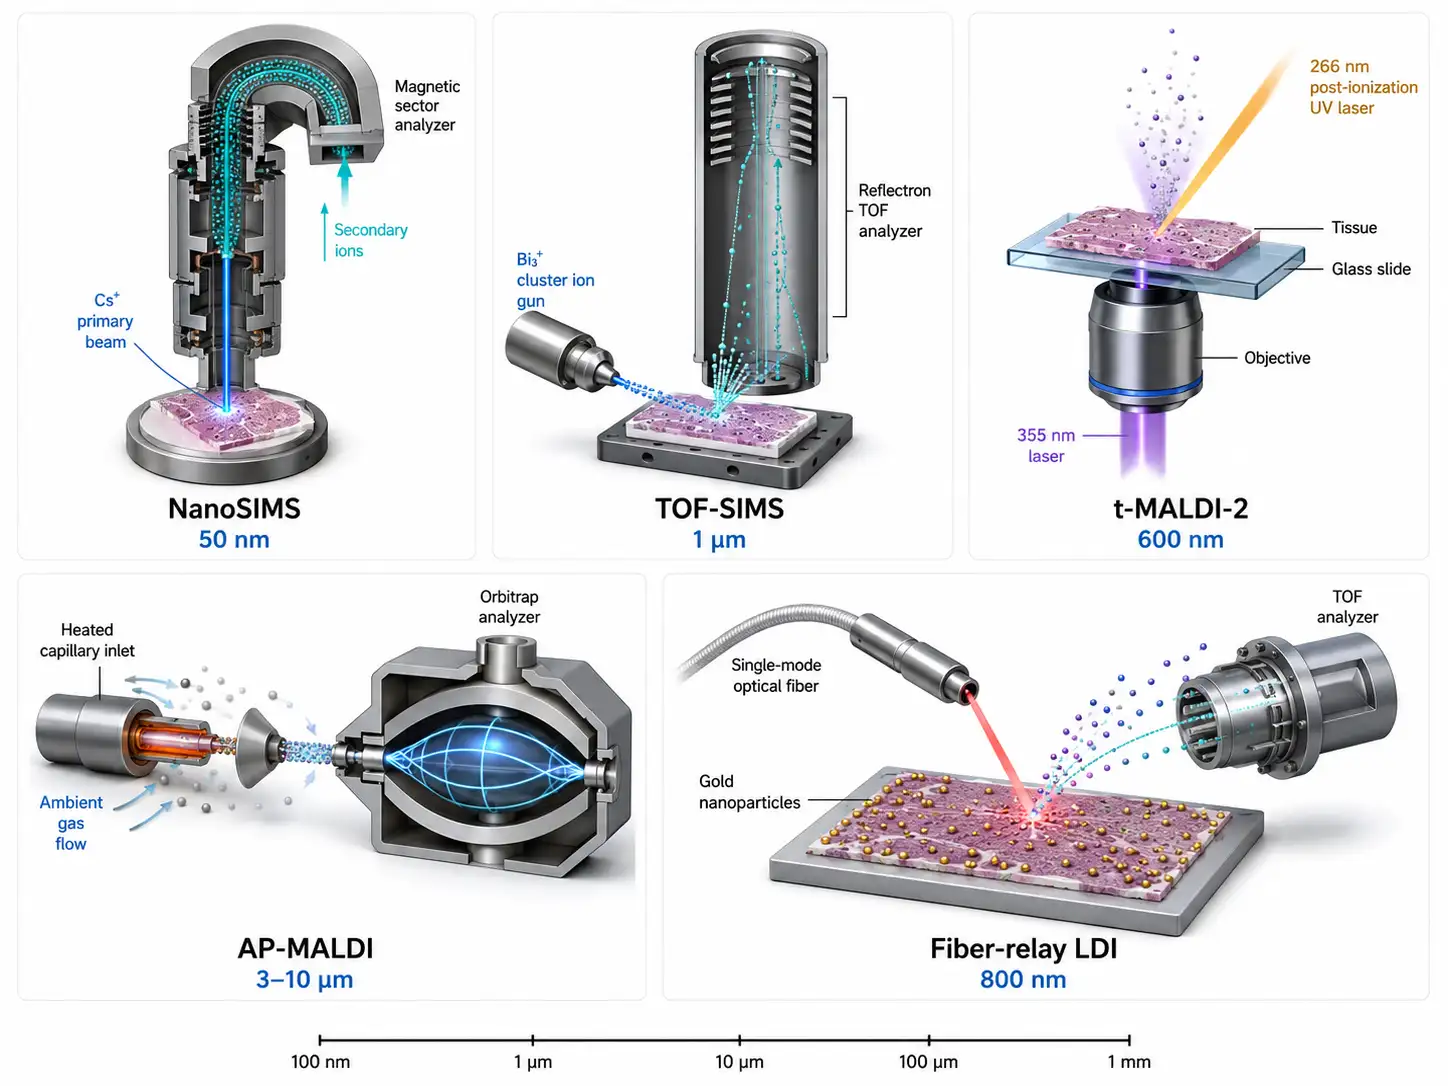 Figure 2: Five MSI Platforms at the Single-Cell Frontier — Instrument Schematics and Resolution Comparison. Side-by-side schematic comparison of the five major single-cell MSI platforms: NanoSIMS (Cs⁺/O⁻ primary ion beam, magnetic sector), TOF-SIMS/3D OrbiSIMS (pulsed Bi₃⁺ beam + Orbitrap), t-MALDI-2 (transmission-geometry 355 nm laser + 266 nm post-ionization), AP-MALDI-Orbitrap (ambient-pressure 213 nm laser), and fiber-relay LDI (single-mode fiber with image-relay optics). Each panel shows the ion source geometry, detector configuration, and a zoomed-in view of the ablation crater/desorption spot with characteristic pixel dimensions labeled. A horizontal scale bar beneath each platform displays the achievable resolution range in nanometers.
NanoSIMS: The Gold Standard for Subcellular Elemental and Isotope Imaging
NanoSIMS (Nanoscale Secondary Ion Mass Spectrometry) achieves the highest spatial resolution of any MSI technique — approximately 50 nm — by focusing a primary ion beam (commonly Cs⁺ or O⁻) onto the sample surface and collecting secondary ions through a double-focusing magnetic sector analyzer. Unlike laser-based methods, NanoSIMS detects atomic and small molecular ions rather than intact biomolecules, making it uniquely suited for stable isotope imaging. Typical applications map ¹³C, ¹⁵N, ¹⁸O, and ²H incorporation into subcellular structures following isotope-labeled nutrient administration.
The key trade-off is molecular specificity. NanoSIMS cannot identify metabolites by mass — it detects only elemental composition at specific m/z channels. For comprehensive metabolomic profiling, NanoSIMS is therefore paired with complementary techniques. Its throughput is also inherently low; a single high-resolution field of view may require hours of acquisition.
TOF-SIMS and 3D OrbiSIMS: Molecular Depth at ~1 μm
Time-of-Flight SIMS (TOF-SIMS) relaxes spatial resolution to approximately 1 μm while dramatically expanding molecular coverage. By using pulsed primary ion beams (Bi₃⁺, Au₃⁺, or Arₙ⁺ gas cluster ion beams — GCIBs), TOF-SIMS generates intact molecular ions from lipids, small metabolites, and fragment ions from larger biomolecules. The ToF analyzer provides high mass resolution and a theoretically unlimited mass range, though sensitivity declines sharply above m/z 1,000.
The 3D OrbiSIMS — a hybrid instrument coupling a ToF-SIMS source with an Orbitrap mass analyzer — represents the current state of the art in SIMS-based metabolomics. The Orbitrap analyzer delivers mass resolving power exceeding 240,000 at m/z 200, enabling confident molecular formula assignment from subcellular volumes. GCIBs permit depth profiling: sequential sputtering removes material layer by layer, reconstructing 3D molecular distributions within single cells. A 2025 Chinese Chemical Letters review identified 3D OrbiSIMS as the most promising SIMS platform for label-free single-cell metabolomics, though noted that sensitivity for low-abundance metabolites remains a limiting factor.
Transmission-Mode MALDI-2: The 600 nm Breakthrough
The most significant hardware advance in laser-based single-cell MSI comes from the University of Münster's t-MALDI-2 platform, published in Nature Communications in October 2025. Conventional MALDI focuses the desorption laser onto the sample surface from above (reflection geometry), with the laser spot size — typically 5-20 μm — setting the hard limit on spatial resolution. Transmission-mode MALDI (t-MALDI) inverts this geometry: a 355 nm laser is focused through a high-numerical-aperture objective (50×/NA0.7) onto the back side of the sample mounted on a transparent glass slide. The resulting ablation craters measure approximately 1 μm, and post-ionization with a second 266 nm laser (MALDI-2) boosts ion yield by one to two orders of magnitude.
The Münster team demonstrated 1 × 1 μm² pixel size in mouse cerebellum, resolving lipid distributions across individual Purkinje cell layers and detecting ~82% of the known cerebellar lipidome. In a 4T1 mammary carcinoma model, single-cell lipid profiling of ~63,000 cells across seven tissue regions identified eight metabolically distinct neutrophil subtypes linked to hypoxic zones and adipose regions. Critically, the platform integrates bright-field and fluorescence microscopy in-source on a shared optical path and coordinate system, achieving<1 μm alignment error between molecular and morphological data. This inherent co-registration removes a major pain point in single-cell MSI — manually matching MSI pixels to histology images — and makes t-MALDI-2 the closest thing to a turnkey single-cell spatial metabolomics platform available today. For labs without access to custom t-MALDI-2 instrumentation, Creative Proteomics' MALDI-Imaging Lipidomics service provides high-spatial-resolution lipid mapping using state-of-the-art MALDI-TOF/Orbitrap platforms with complementary histological co-registration.
AP-MALDI-MSI at Ambient Pressure: Preserving the Volatile Metabolome
Atmospheric-pressure MALDI (AP-MALDI) operates under ambient conditions rather than vacuum, preserving volatile metabolites — short-chain fatty acids, volatile organic acids, and small polar compounds — that would sublime or evaporate in a conventional vacuum MALDI source. The AP-SMALDI 10 Orbitrap (TransMIT GmbH / Thermo Fisher) achieves<5 μm lateral resolution with <2 ppm mass accuracy, while custom 213 nm AP-MALDI systems have demonstrated 3 μm resolution in mouse brain tissue.
In a 2026 Analytical Chemistry study, Kontrimaite and colleagues at the University of Nottingham applied AP-MALDI-Orbitrap MSI at 10 μm resolution to a patient-derived glioblastoma co-culture model. Cell-type-specific fluorescence labeling (eGFP + CellTrace Violet) was integrated with MSI to disentangle metabolite profiles of GBM cells from co-cultured human cortical astrocytes. The study revealed that GBM-astrocyte interaction triggers reciprocal remodeling in nucleotide metabolism, phospholipid and sphingolipid turnover, and tryptophan/tyrosine pathways — metabolic crosstalk invisible to any single-modality assay.
Single-Mode Fiber Image-Relay LDI: 800 nm via Optical Engineering
The newest entry to the resolution frontier comes from the Dalian Institute of Chemical Physics, published in JACS in March 2026. Instead of tightening the laser focus through conventional optics, the team exploited the mode-filtering properties of single-mode optical fibers combined with a custom image-relay system to construct a laser desorption/ionization source that achieves ~800 nm spatial resolution. The working distance exceeds 25 mm (orders of magnitude larger than near-field approaches), which minimizes probe contamination and makes the system practical for routine use. Coupled with a reflectron TOF mass analyzer delivering mass resolving power >10,000, the system mapped lipid heterogeneity in HeLa and HepG2 cells during drug-induced apoptosis with a detection limit of ~700 attomoles absolute.
The biological payoff was striking. Emodin-induced apoptosis produced a progressive, network-mediated lipid remodeling signature — distinct from the acute membrane collapse seen with UV treatment — and drug-specific single-cell lipid fingerprints were constructed for multidrug exposure models. Single-cell analysis further revealed triglyceride enrichment specifically in mitotic cells, demonstrating that metabolic state varies with cell-cycle phase even within a clonal population.
Tissue-Expansion MSI (TEMI): Bypassing Optics with Chemistry
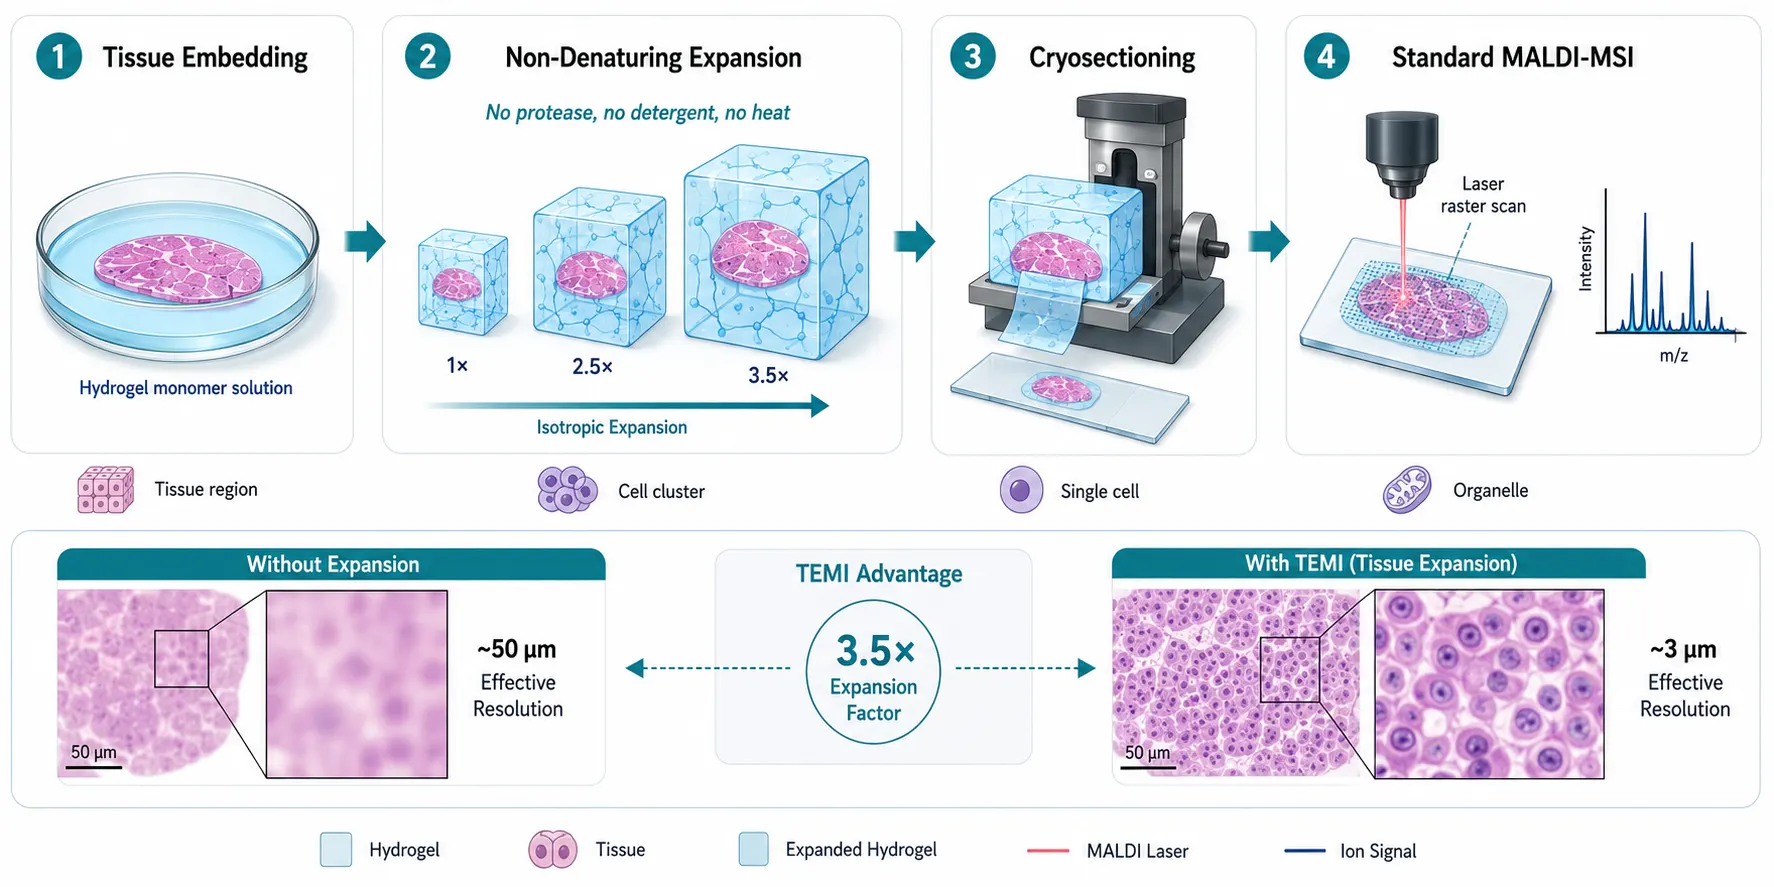 Figure 3: TEMI Workflow — Tissue Expansion Mass Spectrometry Imaging Protocol. Six-stage horizontal workflow diagram of the TEMI protocol: (1) tissue section mounted on a slide, (2) hydrogel monomer infiltration and polymerization without protease digestion, (3) isotropic expansion by 2.5× to 10× via solvent exchange, (4) expanded tissue anchored to hydrogel via primary amine linkages preserving lipids, metabolites, peptides, and N-glycans in their native spatial relationships, (5) standard MALDI-MSI acquisition at conventional laser raster, and (6) computational shrinkage back to original tissue coordinates. An inset shows the effective resolution gain: a 10 μm laser spot on 3.5× expanded tissue yields ~2.9 μm effective resolution — entering single-cell territory without hardware upgrades.
If improving laser optics feels like an asymptotically expensive engineering problem, TEMI — tissue-expansion mass spectrometry imaging — offers an orthogonal solution: physically enlarge the tissue. Published in Nature Methods in April 2025 by Zhang, Li, and colleagues (HHMI Janelia / Baylor College of Medicine / UW-Madison), TEMI embeds tissue in a high-monomer, high-toughness hydrogel and expands it isotropically by 2.5× to 10× (depending on rounds of gelation) without protease digestion, detergents, or heat. This non-denaturing chemistry preserves lipids, metabolites, peptides, and N-glycans in their native spatial relationships, anchored to the hydrogel via primary amine linkages.
The practical impact is immediate. A standard 10 μm laser raster on a 3.5× expanded tissue yields an effective resolution of ~2.9 μm — well into single-cell territory — without upgrading the mass spectrometer. In mouse cerebellum, individual Purkinje cells became clearly distinguishable, and 187 metabolite features plus 57 peptide features were detected with cell-layer-specific spatial organization. In murine melanoma, TEMI revealed 21 metabolically distinct spatial regions, compared to only 3 in unexpanded controls — unmasking tumor heterogeneity that conventional MSI simply could not see (Figure 3).
TEMI's principal limitation is that small, freely water-soluble molecules may partially diffuse or be lost during the expansion steps, and the amine-based anchoring chemistry may modify amine-containing metabolites. Nonetheless, its accessibility — it is far less expensive than purchasing a NanoSIMS or custom t-MALDI-2 — positions TEMI as the most democratizing single-cell MSI technology of this decade.
Multi-Modal Single-Cell Integration: One Section, Two Molecular Worlds
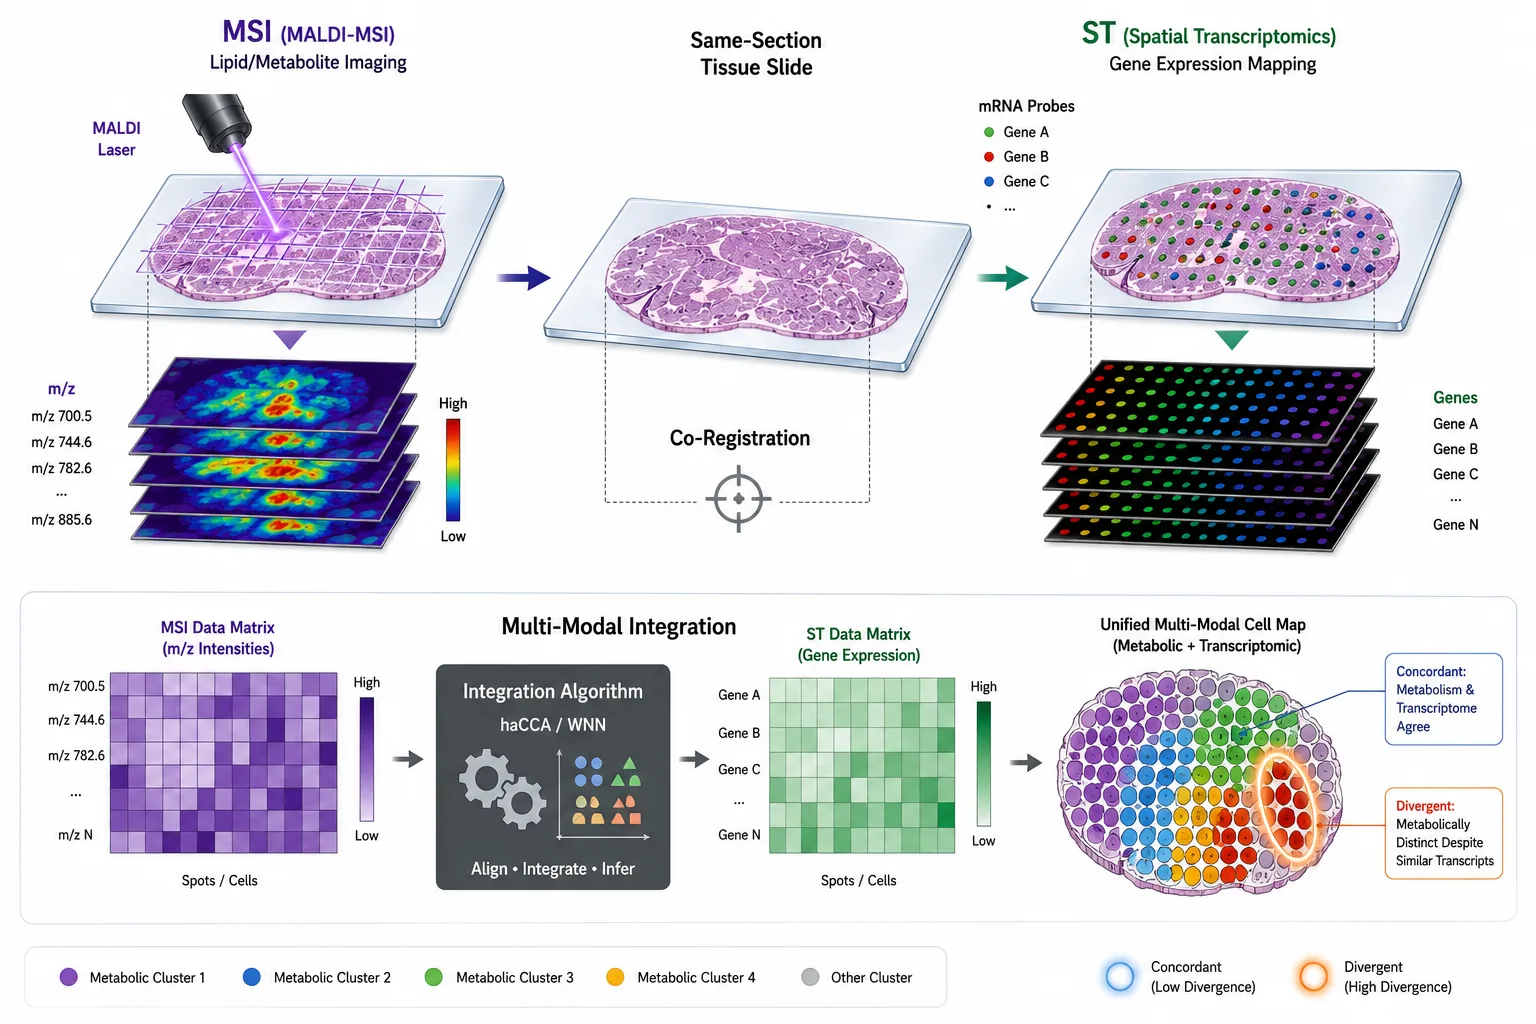 Figure 4: Same-Section MALDI-MSI + Spatial Transcriptomics Integration Workflow. Horizontal workflow showing the sequential same-section protocol: (1) tissue section mounted on ITO-coated conductive slide, (2) MALDI-MSI acquisition at 5 μm pixel size — laser ablation spots serve as intrinsic fiducial markers, (3) Xenium fluorescent probe-based spatial transcriptomics on the same section using MALDI ablation spots for image co-registration via the ESCDAT MATLAB toolbox, (4) Seurat v5 WNN integration merging per-cell MALDI spectra with transcript counts. The bottom panel illustrates the key finding: transcriptionally uniform cell clusters (UMAP) that resolve into metabolically distinct subpopulations when MSI data is overlaid — cells that look identical by gene expression harbor radically different lipidomes.
The most transformative advance in spatial biology since 2025 has been the demonstration that mass spectrometry imaging and spatial transcriptomics can be performed sequentially on the same single tissue section. This eliminates the registration ambiguity inherent in comparing adjacent sections and links a cell's transcriptional program directly to its metabolic output (Figure 4).
MALDI-MSI + Xenium: The First Validated Same-Section Workflow
In November 2025, Hendriks and colleagues at the M4I Institute (Maastricht University) published the first rigorous same-section MALDI-MSI + Xenium spatial transcriptomics workflow in Scientific Reports. The protocol performs MALDI-MSI at 5 μm pixel size first, then the same section undergoes Xenium fluorescent probe-based spatial transcriptomics. The MALDI laser ablation spots serve as intrinsic fiducial markers for image co-registration, handled by ESCDAT — an open-source MATLAB toolbox developed by the team.
The transcriptomic penalty is modest: transcript counts per cell decreased by approximately 30%, but over 90% of cells still surpassed 250 detected transcripts, preserving cell-type assignments. Applied to mouse brain and human glioblastoma, the workflow enabled per-cell MALDI spectra extraction aligned with gene expression, and Seurat v5 weighted-nearest-neighbor (WNN) integration revealed metabolically distinct subpopulations within transcriptionally uniform cell clusters. This is the critical finding: cells that look identical by gene expression can harbor radically different lipidomes, and same-section co-detection is the only way to capture this.
OpenFISH: Accessible Same-Section Spatial Transcriptomics After MSI
A complementary approach, OpenFISH (Li et al., 2026), brings the cost of same-section spatial transcriptomics down to approximately 0.5% of commercial platform pricing by using standard microscopes and open-source reagents. OpenFISH resolves hundreds of transcripts at subcellular resolution within 24 hours after MALDI-MSI on the same section, making multi-modal single-cell analysis financially feasible for academic labs. Demonstrated in mouse brain, the combined MALDI + OpenFISH pipeline resolved metabolic heterogeneity at the individual cell level and detected cell-type-specific transcriptional activation of transposable elements after inflammatory challenge.
haCCA: The Computational Glue
Hardware integration is only half the battle. The data types are fundamentally different — continuous m/z spectra versus discrete transcript counts — and share neither coordinates nor feature spaces when acquired from adjacent sections. The haCCA framework (Xu, Shen et al., Communications Biology, 2025) addresses this by constructing a shared latent space through canonical correlation analysis of high-correlation gene-metabolite pairs, then solving an optimal transport problem that jointly optimizes spatial and molecular feature alignment.
Applied to an Akt/Yap-driven intrahepatic cholangiocarcinoma mouse model, haCCA revealed that neutrophil extracellular traps (NETs) upregulate stearoyl-CoA desaturase 1 (Scd1), driving fatty acid elongation and cholesterol metabolism in tumor regions — the first in situ profiling of NET-driven metabolic reprogramming in cancer. The framework is available as a Python package and represents the current best-practice computational pipeline for integrating spatial transcriptomics with MALDI-MSI data.
Dynamic Single-Cell Metabolomics: Isotope Tracing Meets MSI
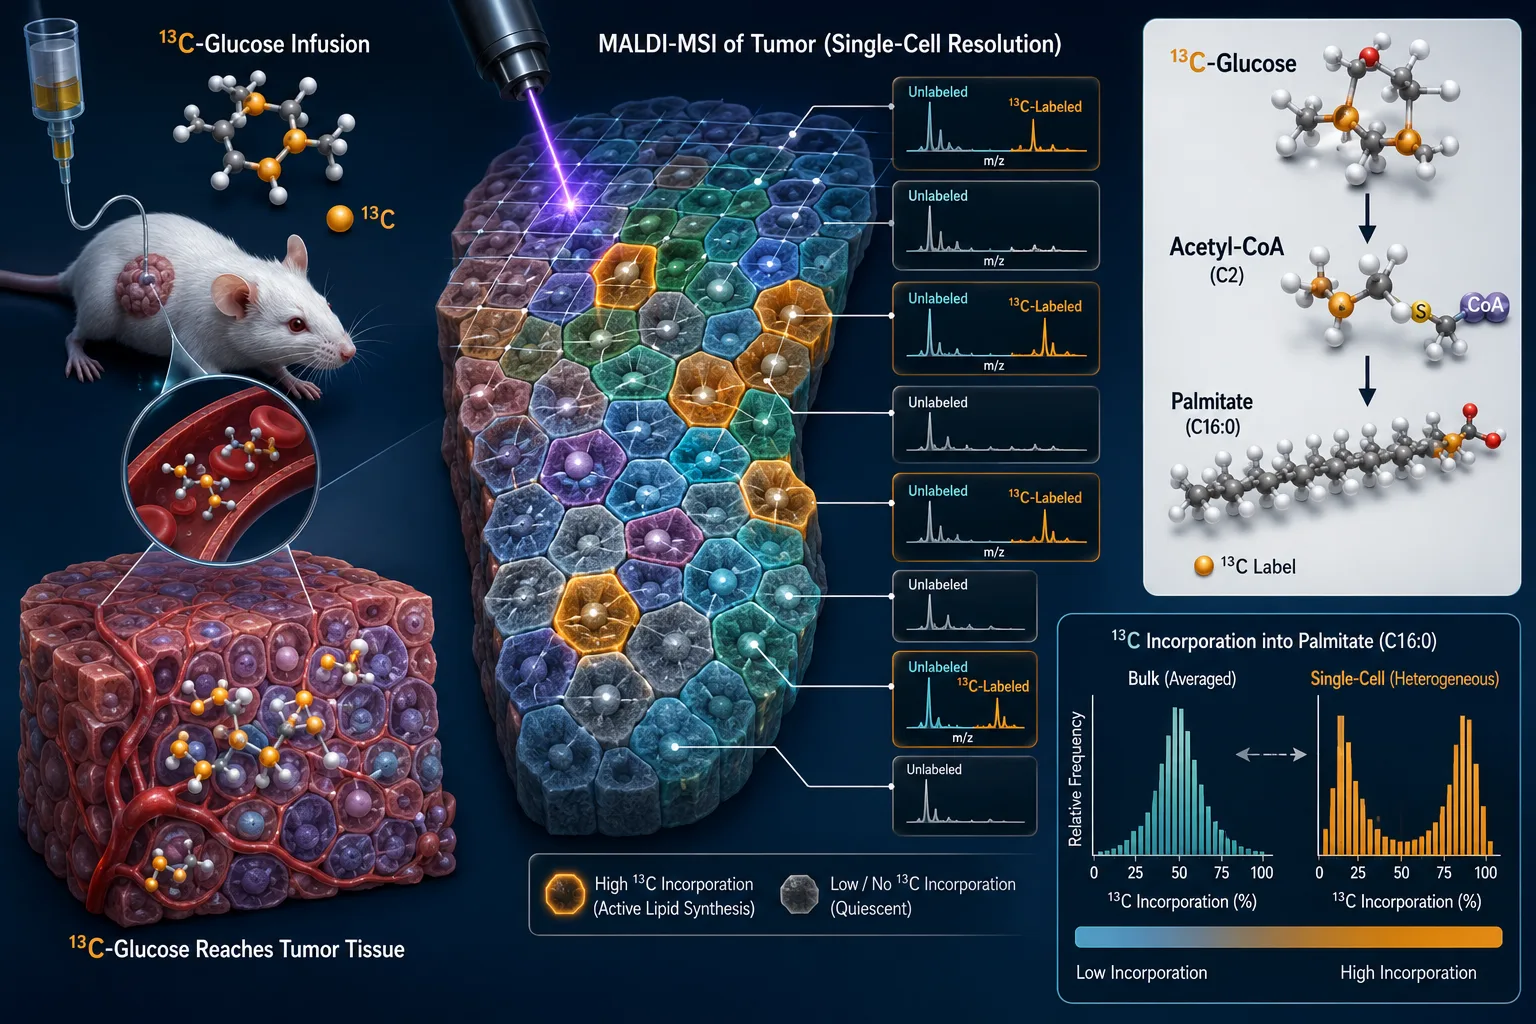 Figure 5: 13C-SpaceM — Isotope Tracing at Single-Cell Resolution Concept. Schematic of the 13C-SpaceM platform: ¹³C-glucose is administered to the biological system, and MALDI-MSI combined with fluorescence microscopy extracts per-cell metabolite and lipid profiles. Cells actively synthesizing fatty acids from ¹³C-glucose show characteristic +1, +2, +3 Da mass shifts in lipid spectra relative to unlabeled controls. A dual heatmap overlay displays the spatial distribution of total lipid intensity (grayscale) and ¹³C-enriched lipid species (color scale), revealing metabolic heterogeneity — some tumor subclones show high label incorporation (active lipogenesis) while adjacent clones show minimal labeling despite similar total lipid abundance.
Static metabolite snapshots — however spatially resolved — cannot distinguish a metabolite pool that is actively being synthesized from one that is dormant. Isotope tracing addresses this by administering a labeled precursor (typically ¹³C-glucose, ¹³C-glutamine, or ²H₂O) and mapping the spatial distribution of label incorporation, which reports on metabolic flux rather than pool size (Figure 5).
The SpaceM platform, developed by Alexandrov and colleagues and commercialized through DeepCyte, combines MALDI-MSI with fluorescence microscopy to extract per-cell metabolite and lipid profiles from tissue sections. The 13C-SpaceM extension, published in Nature Metabolism, adds isotope tracing: cells actively synthesizing fatty acids from ¹³C-glucose show characteristic mass shifts in lipid spectra, revealing metabolic heterogeneity in tumors that is invisible to both conventional metabolomics and transcriptomics. HT-SpaceM, the high-throughput variant, processes cells on custom multi-well slides at a throughput the developers characterize as "10× faster and 100× cheaper than single-cell RNA-seq." For researchers studying metabolic pathway activity in a spatial context, Creative Proteomics' Metabolic Flux Analysis (MFA) service provides stable-isotope-resolved metabolomics that complements spatial MSI readouts by quantifying flux through specific metabolic nodes.
A 2025 Methods in Molecular Biology protocol by Rietjens et al. provides a detailed experimental framework for in situ isotope tracing with MSI, covering vibratome sectioning of tissues from isotope-infused animals, matrix application protocols that minimize metabolite delocalization, and data processing steps that correct for natural isotope abundance.
Key Applications at Single-Cell Resolution
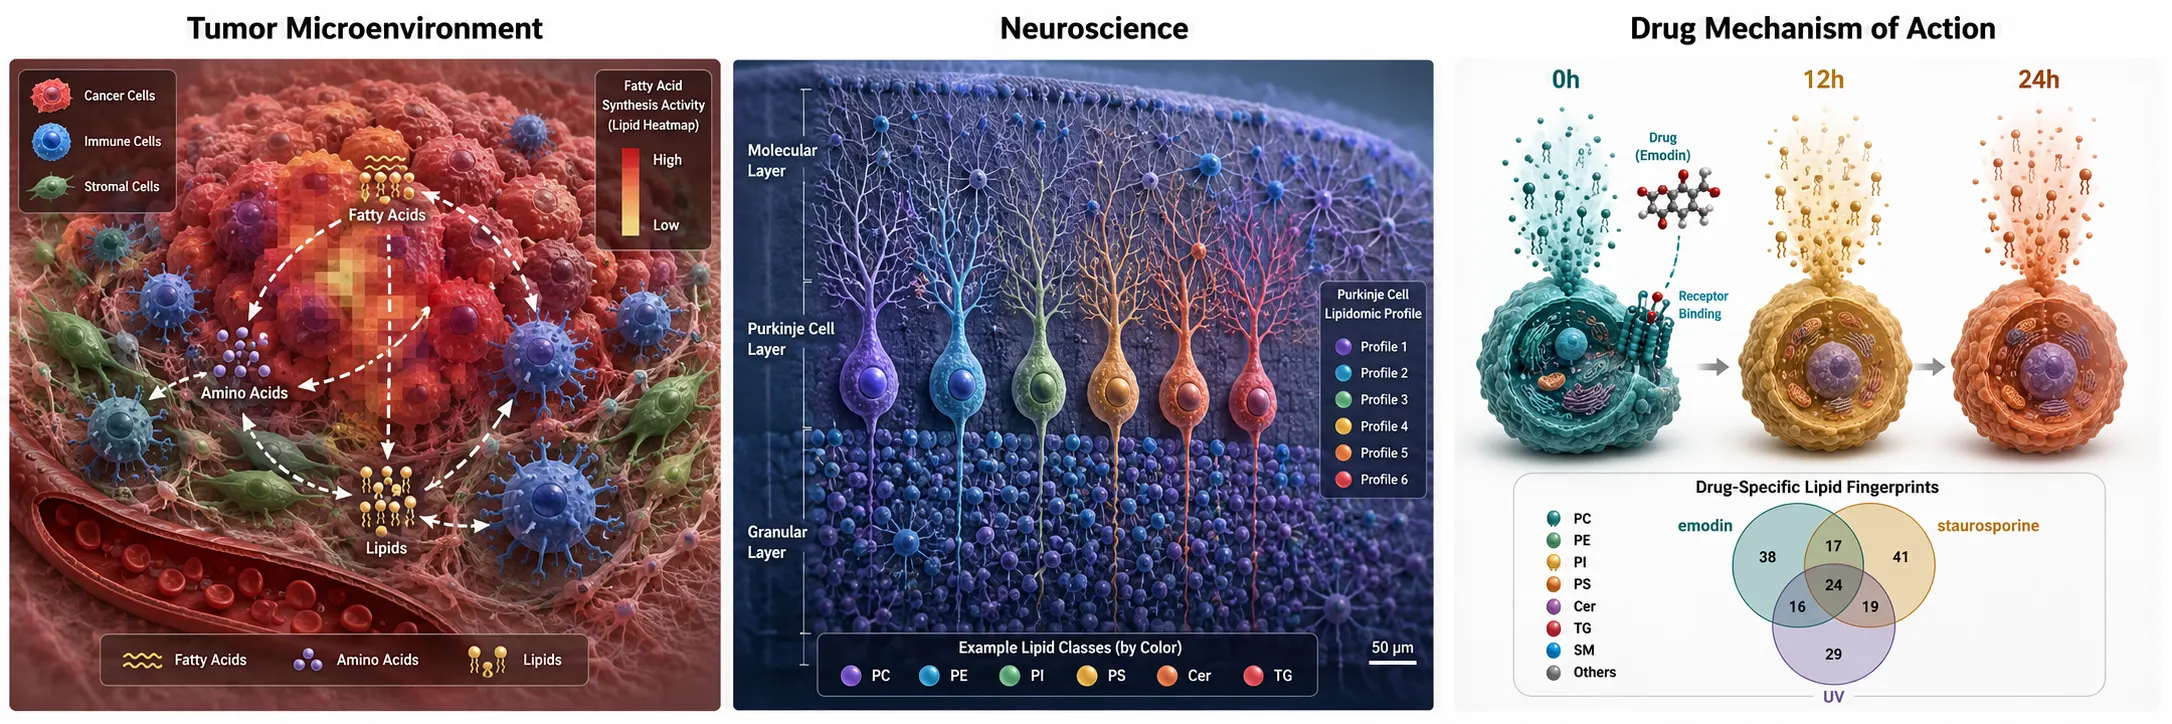 Figure 6: Key Single-Cell MSI Applications — Cancer Metabolism, Neuroscience, and Drug Mechanisms. A 1×3 panel infographic summarizing three key application domains: (left) Cancer Metabolism — t-MALDI-2 lipid-based neutrophil subtyping in 4T1 mammary carcinoma with eight metabolically distinct populations mapped to hypoxic and adipose zones; (center) Neuroscience — TEMI-resolved Purkinje cell lipid signatures in mouse cerebellum with 187 spatially organized metabolite features across cortical layers; (right) Drug Mechanisms — fiber-relay LDI single-cell lipid fingerprints distinguishing emodin-induced, staurosporine-induced, and UV-induced apoptosis, demonstrating that different death triggers produce distinct metabolic trajectories despite the same cellular endpoint.
Cancer Metabolism and Tumor Microenvironment
Single-cell MSI is redefining our understanding of tumor metabolic heterogeneity. The t-MALDI-2 study identified eight lipid-based neutrophil subtypes in the 4T1 mammary carcinoma model, spatially associated with hypoxic and adipose tissue zones. The AP-MALDI glioblastoma co-culture study mapped metabolic exchange between cancer cells and astrocytes at the invasion margin. The haCCA-NET study uncovered Scd1-driven fatty acid elongation as a spatially localized metabolic program in intrahepatic cholangiocarcinoma. Each of these findings was invisible to bulk metabolomics and would have been missed or misattributed by adjacent-section multi-omics.
Neuroscience
The brain's extreme cellular heterogeneity — dozens of molecularly distinct neuronal and glial subtypes interleaved at micrometer scales — makes it the ideal testbed for single-cell MSI. TEMI revealed 187 spatially organized metabolite features across cerebellar layers, with lipid signatures distinguishing Purkinje cells, granule cells, and white matter tracts. The same-section MALDI+Xenium study in mouse brain demonstrated that transcriptionally similar neuronal populations harbor metabolically distinct subpopulations, with potential implications for understanding selective neuronal vulnerability in neurodegenerative disease.
Beyond the cerebellum, AP-MALDI studies have mapped age-dependent shifts in hippocampal lipid composition at 10 μm resolution, identifying sphingolipid accumulation in CA1 pyramidal neurons that correlates with cognitive decline in rodent models. The ability to co-register MSI data with immunofluorescence markers for specific neuronal subtypes — parvalbumin-positive interneurons, dopaminergic neurons, cholinergic projection neurons — makes it possible to ask not just "what metabolites are in this brain region?" but "which specific cell type is accumulating which lipid species?" This is a question central to Parkinson's and Alzheimer's research, where selective vulnerability of defined neuronal populations remains unexplained by transcriptomics alone.
Drug Mechanism of Action and Pharmacometabolomics
The fiber-relay LDI study constructed drug-specific single-cell lipid fingerprints for emodin, staurosporine, and UV-induced apoptosis, revealing that different death triggers produce distinct metabolic trajectories even when the endpoint — cell death — is the same. This has direct implications for drug development: single-cell MSI can distinguish on-target metabolic effects from off-target toxicity, identify resistance mechanisms operating in metabolic subclones, and map drug-induced metabolic remodeling across the tumor microenvironment with cell-type resolution.
Single-cell MSI is also entering pharmaceutical R&D. A 2025 industry-academic collaboration used t-MALDI-2 to compare lipidomic responses across a panel of kinase inhibitors in 3D tumor spheroids, revealing that drugs with the same nominal target (EGFR inhibition) produced divergent spatial lipid fingerprints depending on off-target kinase engagement. This suggests single-cell MSI could serve as an early screening tool to flag unexpected metabolic off-target effects before compounds enter costly preclinical development. The key advantage over conventional toxicology assays is spatial resolution — a drug effect confined to a small cell subpopulation is invisible to bulk LC-MS but starkly visible at 1 μm pixel size.
Challenges and Practical Considerations
Sensitivity and Metabolome Coverage
Metabolites cannot be amplified — unlike transcripts, which benefit from PCR — so every molecule counts. A typical mammalian cell contains roughly 0.5-1.0 pmol of total metabolites distributed across thousands of species, meaning many individual metabolites are present at attomole levels. Current single-cell MSI methods detect hundreds of lipid species but typically fewer than 100 polar metabolites per cell. Ion suppression — where abundant species (phospholipids, cholesterol) dominate the spectrum and suppress signals from low-abundance metabolites — remains a fundamental challenge. On-tissue chemical derivatization and dual-polarity acquisition strategies (e.g., the DAN/DAN-HCl matrix pairing for sequential positive/negative ion mode) are active areas of development.
Throughput Versus Resolution
There is an unavoidable trade-off: higher spatial resolution means more pixels per tissue area and longer acquisition times. A 1 mm² tissue region imaged at 50 μm requires 400 pixels; at 1 μm, it requires 1,000,000 pixels. Most subcellular-resolution studies to date have been limited to small fields of view (tens to hundreds of cells), and scaling to whole-tissue sections while maintaining single-cell resolution will require advances in laser repetition rates, stage speed, and data compression. TEMI partially sidesteps this by achieving single-cell effective resolution with a physically larger pixel pitch, but the expansion steps add 2-3 days to sample preparation.
Sample Preparation Artifacts
The metabolome responds to perturbations within seconds. Enzymatic or mechanical tissue dissociation — routine steps in single-cell transcriptomics — can profoundly alter metabolite levels. For MSI, the key concern is metabolite delocalization during matrix application: if the matrix solvent spreads lipids and small molecules across the tissue surface before crystallization, spatial resolution is lost regardless of laser spot size. Sublimation-based matrix deposition, which applies matrix in the gas phase with zero solvent, and robotic micro-spotting systems that deliver picoliter droplets to discrete positions are the current best practices for minimizing delocalization.
Data Integration and Standardization
The single-cell spatial metabolomics field lacks community-wide data standards comparable to those in transcriptomics (e.g., 10X Genomics file formats, Seurat/Scanpy ecosystems). METASPACE, developed by the Alexandrov lab, provides cloud-based annotation and visualization of MALDI-MSI datasets and has become a de facto community resource, but true multi-modal data integration frameworks — haCCA, Seurat WNN with MSI data, and the emerging SpatialData standard — are still maturing. For labs entering the field, budgeting for bioinformatics support is as critical as budgeting for instrument time. Creative Proteomics' Bioinformatics for Metabolomics service supports multi-modal spatial data integration, including METASPACE-based metabolite annotation, spatial-statistical modeling, and integration of MSI datasets with transcriptomic or proteomic data layers.
Platform Selection Decision Framework
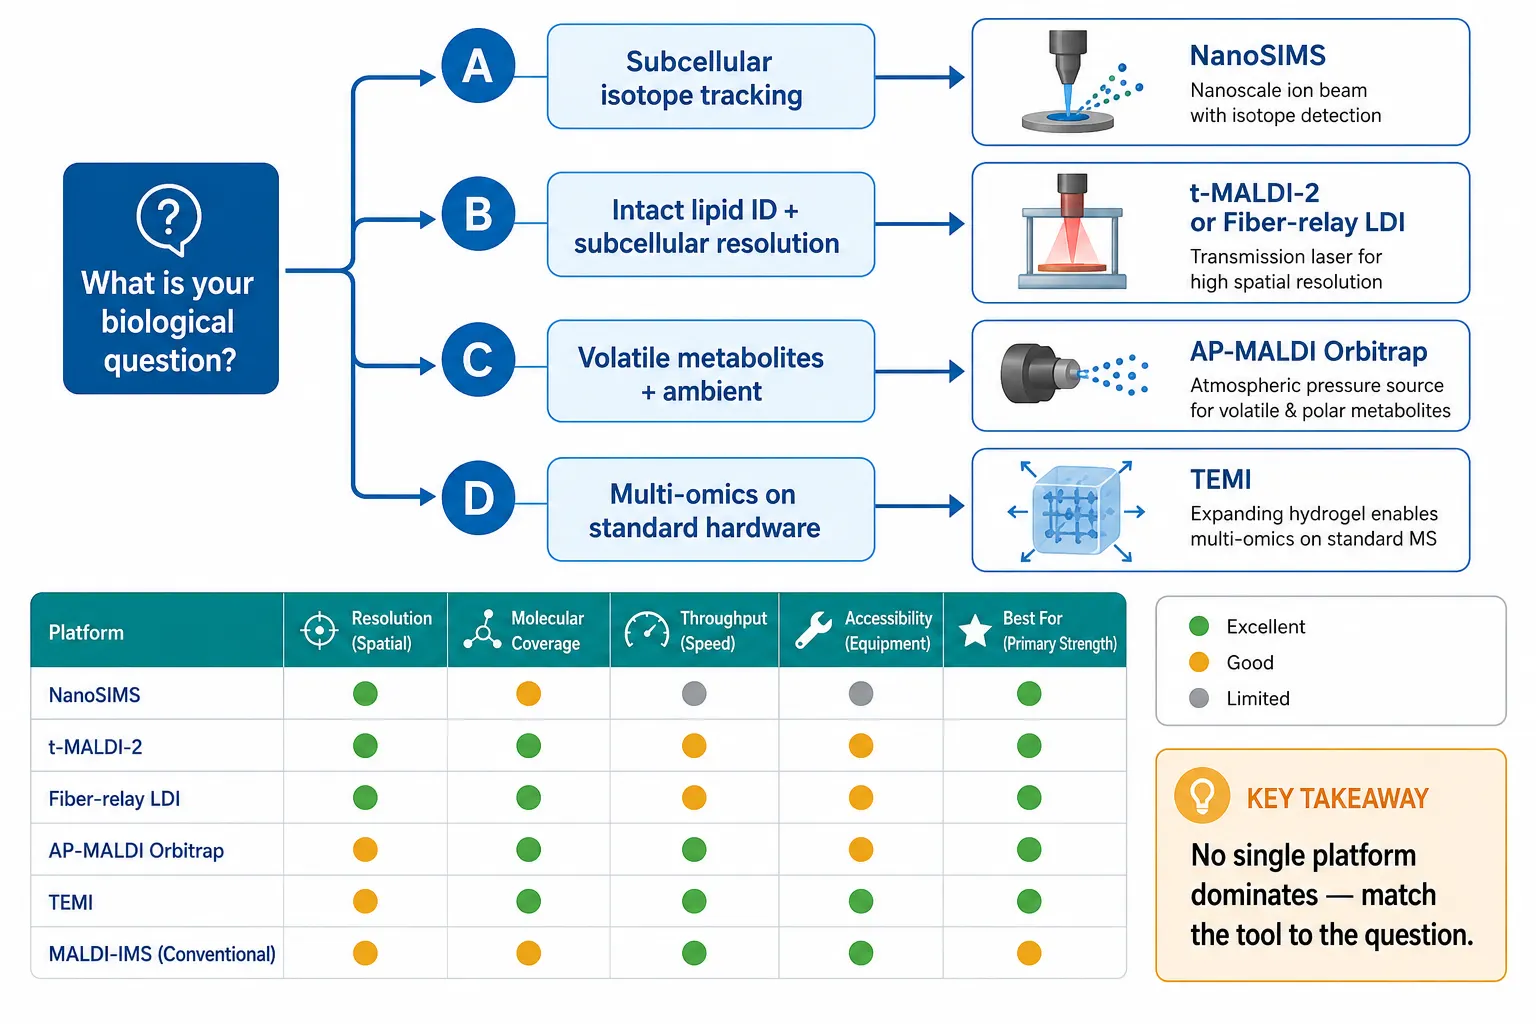 Figure 7: Platform Selection Decision Framework for Single-Cell MSI. A four-quadrant decision matrix mapping biological questions to the optimal single-cell MSI platform. Axes: spatial resolution (50 nm to 10 μm) vs. molecular coverage (elemental/isotope only to broad metabolome + lipids). Each platform occupies a quadrant: NanoSIMS (top-left, highest resolution, elemental only), TOF-SIMS/3D OrbiSIMS (upper-mid, μm resolution, lipids+metabolites), t-MALDI-2 and fiber-relay LDI (upper-right, sub-μm resolution, broad lipid coverage), AP-MALDI (mid-right, 3-10 μm, volatile metabolites preserved), and TEMI (right, effective 3 μm, broadest coverage, highest accessibility). A dashed accessibility contour indicates which platforms are available at core facilities vs. specialized labs vs. prototype-only.
The table below maps biological questions to the most appropriate single-cell MSI platform, considering resolution requirements, molecular coverage, throughput, and accessibility.
| Technology | Best Resolution | Molecular Coverage | Throughput | Accessibility |
|---|---|---|---|---|
| NanoSIMS | ~50 nm | Elemental/isotope only | Very low (hours per FOV) | Core facility only |
| TOF-SIMS / 3D OrbiSIMS | ~1 μm | Lipids, metabolites, fragments | Low | Core facility |
| t-MALDI-2 | ~600 nm–1 μm | Lipids, metabolites, glycans | Medium | Specialized lab |
| AP-MALDI Orbitrap | 3–10 μm | Lipids, volatile metabolites | Medium | Moderate |
| Fiber-relay LDI | ~800 nm | Lipids (AuNP-assisted) | Medium | Prototype only |
| TEMI (expanded) | ~3 μm effective | Lipids, metabolites, proteins, N-glycans | High (standard MALDI speed) | Any MALDI lab |
All single-cell spatial metabolomics metabolomics services described in this article are provided for Research Use Only (RUO). These workflows are not intended for diagnostic, therapeutic, or clinical decision-making purposes.
FAQ
Q: What is the highest spatial resolution achievable in MSI today?
A: NanoSIMS achieves ~50 nm for elemental and isotope imaging. For intact biomolecules (lipids and metabolites), t-MALDI-2 achieves ~600 nm–1 μm, and fiber-relay LDI achieves ~800 nm. TEMI achieves single-cell effective resolution (~3 μm) using standard MALDI hardware plus tissue expansion chemistry.
Q: Can MSI identify metabolites at single-cell resolution without labels?
A: Yes. t-MALDI-2, TOF-SIMS, 3D OrbiSIMS, AP-MALDI, and fiber-relay LDI are all label-free methods that detect endogenous lipids and metabolites by their mass-to-charge ratios. NanoSIMS requires isotope labeling for most biological applications.
Q: Is it possible to run spatial transcriptomics and MSI on the same tissue section?
A: Yes. The Hendriks et al. (2025) protocol performs MALDI-MSI followed by Xenium spatial transcriptomics on the same section, and OpenFISH (2026) provides a lower-cost alternative. Both protocols apply MSI first (which does not damage nucleic acids significantly) and spatial transcriptomics second.
Q: How many metabolites can single-cell MSI detect per cell?
A: Current methods detect hundreds of lipid species per cell, but polar metabolite coverage is more limited — typically tens of identifiable small molecules. This is an active area of development and varies significantly by platform, matrix chemistry, and tissue type.
Q: Can Creative Proteomics perform single-cell spatial metabolomics?
A: While the subcellular-resolution platforms described in this article (t-MALDI-2, NanoSIMS, fiber-relay LDI) are primarily available in specialized academic labs, Creative Proteomics offers complementary spatial omics services — including MALDI-Imaging Lipidomics at high spatial resolution and MS-based Spatial Proteomics — that address many of the same biological questions at tissue and near-single-cell resolution. For projects requiring true subcellular resolution, our team can advise on optimal sample preparation strategies and connect you with collaborative MSI platforms.
References:
- Potthoff A, Schwenzfeier J, Niehaus M, et al. Spatial biology using single-cell mass spectrometry imaging and integrated microscopy. Nature Communications. 2025;16:9129. doi:10.1038/s41467-025-64603-8
- Zhang H, Ding L, Hu A, et al. TEMI: tissue-expansion mass-spectrometry imaging. Nature Methods. 2025;22:1051-1058. doi:10.1038/s41592-025-02664-9
- Yi J, Leng Y, et al. Single-mode fiber image relay mass spectrometry imaging reveals lipid heterogeneity during drug-induced apoptosis. Journal of the American Chemical Society. 2026. doi:10.1021/jacs.6c00600
- Kontrimaite E, Wong J, Martínez-Jarquín S, et al. Single-cell metabolic profiling in a glioblastoma coculture model using AP-MALDI-based mass spectrometry imaging. Analytical Chemistry. 2026;98(15):11246-11260. doi:10.1021/acs.analchem.5c07924
- Hendriks TFE, Eijkel GB, Heeren RMA, Cuypers E, et al. One section, two worlds: single-cell integration of MALDI-MSI and spatial transcriptomics on the same single tissue section. Scientific Reports. 2025;15:42660. doi:10.1038/s41598-025-26735-1
- Li Z, et al. OpenFISH enables integrated high-resolution spatial transcriptomics and metabolomics on a single tissue section. bioRxiv. 2026. doi:10.1101/2025.08.19.671030
- Xu Z, Shen L, Zhang Y, Chen J, Jia W, Yang H. haCCA: multi-module integration of spot-based spatial transcriptomes and metabolomes. Communications Biology. 2025. doi:10.1038/s42003-026-09526-w
- Lai Z, Xu J, Chen L, Ke Y, Lin Z. From innovation to application: pioneering advances in mass spectrometry imaging for spatially resolved single-cell omics. Chinese Chemical Letters. 2026;37(6):111932. doi:10.1016/j.cclet.2025.111932
- Hill CB, et al. Single-cell mass spectrometry imaging: platform advances for multimodal spatial omics. Analytical and Bioanalytical Chemistry. 2026. doi:10.1007/s00216-026-06644-6
- Buglakova A, Ekelöf M, Alexandrov T, et al. Spatial single-cell isotope tracing reveals heterogeneity of de novo fatty acid synthesis in cancer. Nature Metabolism. 2024;6(9):1695-1711. doi:10.1038/s42255-024-01118-4
- Rietjens RGJ, Heijs B. In situ isotope tracing at single-cell resolution using mass spectrometry imaging. In: Clinical Metabolomics. Methods in Molecular Biology. 2025. doi:10.1007/978-1-0716-4116-3_28
- Mei X, You M, Xu G, Liu X. Advances in single-cell mass spectrometry imaging for small molecule analysis. Journal of Chinese Mass Spectrometry Society. 2025. doi:10.7538/zpxb.2025.0075
















