

Principles of MALDI-MSI: Ionization, Laser-Tissue Interaction, and Mass Analyzers
Matrix-assisted laser desorption/ionization (MALDI) mass spectrometry imaging occupies a central position in the spatial metabolomics technology landscape. Its operating principle couples an organic matrix — a small aromatic acid that co-crystallizes with endogenous analytes on a tissue surface — with a pulsed ultraviolet laser to generate gas-phase ions pixel by pixel across a raster-scanned tissue section. For a broader comparison of MALDI against other MSI platforms including DESI, SIMS, and LA-ICP-MS, see our technology landscape overview on spatial metabolomics by mass spectrometry imaging.
UV-MALDI vs IR-MALDI Fundamentals
Commercial MALDI-MSI instruments use frequency-tripled Nd:YAG (355 nm) or nitrogen (337 nm) UV lasers, whose photon energy couples efficiently to the aromatic ring systems of conventional matrices. The matrix absorbs laser energy, undergoes photothermal desorption, and transfers protons to co-desorbed analyte molecules in the expanding plume. Infrared MALDI (Er:YAG, 2.94 um) excites endogenous water O-H stretching and can operate matrix-free, but its spatial resolution is limited to 50-100 um by the longer wavelength and thermal diffusion zone. For high-resolution spatial metabolomics, UV-MALDI remains the standard.
TOF, FTICR, and Orbitrap Analyzers for MALDI Imaging
The choice of mass analyzer directly constrains mass resolution, mass accuracy, and acquisition speed in an MALDI-MSI experiment. Time-of-flight (TOF) analyzers dominate the installed base because their pulsed nature matches MALDI's discontinuous ion generation. Modern TOF instruments with reflectron geometry and delayed extraction deliver mass resolving power of 30,000-60,000 (FWHM) and mass accuracy below 2 ppm with internal calibration, at acquisition speeds compatible with 10 kHz lasers.
FTICR analyzers provide ultrahigh mass resolving power exceeding 1,000,000 for resolving isobaric species without MS/MS, but their long transient times (0.5-2 s per pixel) limit throughput for large-area imaging. The Orbitrap analyzer (MALDI-LTQ-Orbitrap, Q Exactive platforms) occupies a practical middle ground: resolving power up to 240,000 at m/z 200, sub-1-ppm mass accuracy with internal lock-mass correction, and per-pixel acquisition times of 100-500 ms. For most metabolomics and lipidomics imaging experiments, the Orbitrap provides the optimal balance of spectral fidelity and throughput; TOF instruments remain the choice for highest-speed acquisition at 10 kHz+ laser repetition rates.
Spatial Resolution Determinants in MALDI
Spatial resolution in MALDI-MSI is governed by the laser spot size at the tissue surface, the matrix crystal dimensions, and the step size of the raster pattern. On conventional reflection-geometry instruments, practical lateral resolution typically falls in the 10-50 um range. Transmission-mode MALDI (t-MALDI), in which the laser irradiates the sample through a transparent substrate, reduces the effective laser spot to approximately 1 um by minimizing the depth-of-focus limitations inherent to the reflection geometry. The t-MALDI configuration, combined with MALDI-2 post-ionization, now enables single-cell metabolomics and lipidomics at subcellular resolution — a topic covered in depth in our article on single-cell spatial metabolomics.
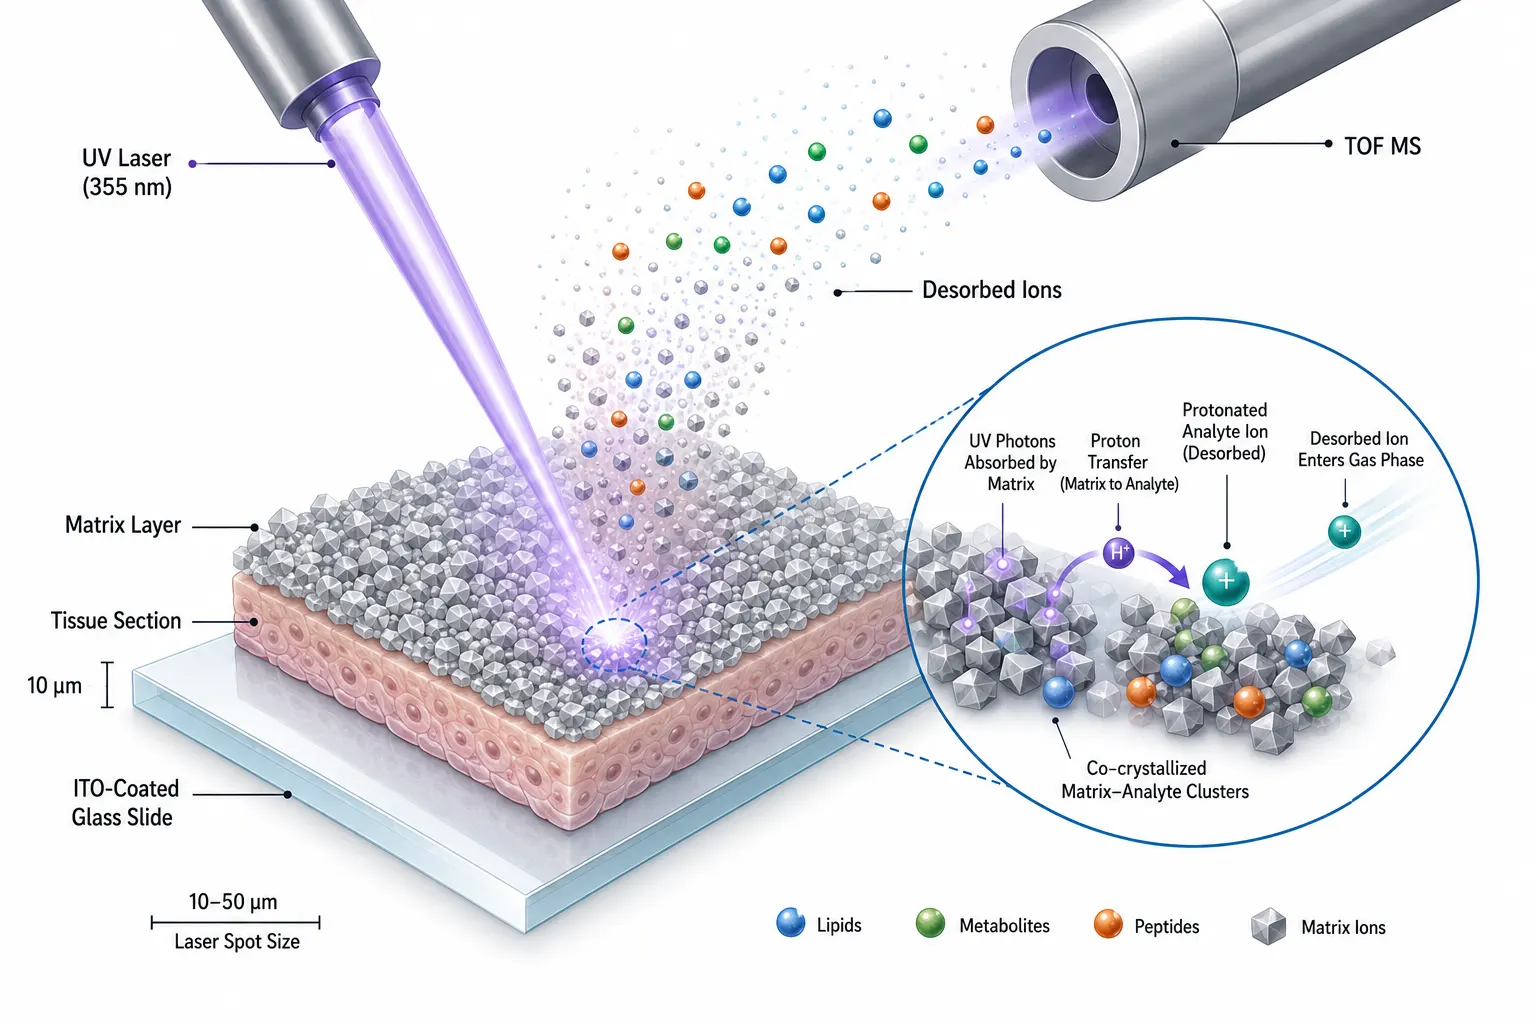 Figure 1: MALDI Ionization Mechanism — 3D Cutaway Showing Laser-Matrix-Analyte Interaction
Matrix Selection: A Decision Framework
Matrix selection is the single most consequential experimental choice in a MALDI-MSI workflow. The matrix determines which analyte classes are ionized, how efficiently they desorb, and the achievable spatial resolution. A standardized matrix decision logic — mapping specific matrices to target analyte classes — remains surprisingly absent from most published protocols, and this section provides that framework.
Matrix Chemistry Fundamentals
An effective MALDI matrix must satisfy four criteria simultaneously: (1) strong absorption at the laser wavelength to enable efficient energy transfer; (2) co-crystallization with analyte molecules to embed them within the matrix lattice; (3) proton donor or acceptor capability to ionize analytes in the gas phase; and (4) sufficiently low vapor pressure to remain stable under vacuum. Matrix pKa, crystalline morphology, and sublimation enthalpy collectively determine performance. Matrices with lower proton affinity produce hotter ionization and more fragmentation; "cool" matrices such as DHB preserve labile modifications but may ionize fewer analyte classes. Crystal size — a function of the matrix compound and the deposition method — directly limits the minimum practical laser spot size: a 50 um crystal cannot support 10 um spatial resolution.
Positive Ion Mode Matrices: DHB, CHCA, and Sinapinic Acid
2,5-Dihydroxybenzoic acid (DHB) is the most broadly deployed matrix for lipid and small-metabolite imaging in positive ion mode. Its low proton affinity (853 kJ/mol) makes it a "cool" matrix that minimizes in-source fragmentation of labile lipid species, particularly phosphatidylcholines (PC), sphingomyelins (SM), and triacylglycerols (TAG). DHB crystals formed by sublimation are typically 1-5 um in diameter, supporting imaging at 10-20 um lateral resolution. DHB's primary limitation is heterogeneous crystal formation — so-called "sweet spots" — though sublimation and controlled recrystallization have substantially mitigated this issue.
Alpha-cyano-4-hydroxycinnamic acid (CHCA) is the preferred matrix for low-molecular-weight polar metabolites, amino acids, and small peptides below approximately 5 kDa. Its higher proton affinity (890 kJ/mol) produces hotter ionization that aids desolvation of polar species but can fragment lipids. CHCA forms exceptionally fine, uniform crystals (sub-micron to 2 um), enabling the highest spatial resolution among conventional matrices — routinely below 10 um. A 2025 study by Spears et al. (Analytical Chemistry, PMID: 40855949) demonstrated that CHCA crystal size depends significantly on whether crystallization occurs on-tissue versus off-tissue, with tissue surface chemistry influencing nucleation density.
Sinapinic acid (SA; 3,5-dimethoxy-4-hydroxycinnamic acid) targets higher-mass analytes — intact proteins and large peptides above 5 kDa — and sees limited use in small-molecule metabolomics workflows. It is included here for completeness, as multi-omic MALDI experiments combining lipid, metabolite, and protein imaging from serial sections may employ all three matrices.
Negative Ion Mode Matrices: 9-AA, DAN, and Norharmane
9-Aminoacridine (9-AA) is the workhorse negative-ion matrix for acidic and phosphorylated metabolites. Its strong proton-acceptor character efficiently deprotonates organic acids, fatty acids, bile acids, nucleotides (ATP, ADP, AMP), phosphorylated sugars, and cardiolipins. 9-AA is essentially ineffective in positive ion mode — it must be paired with negative-ion acquisition. Sublimated 9-AA produces uniform coatings with crystal sizes of 2-5 um, supporting spatial resolution down to 10-20 um. For energy metabolism studies requiring spatial mapping of TCA cycle intermediates and adenylate energy charge, 9-AA in negative mode is irreplaceable.
1,5-Diaminonaphthalene (DAN) is a dual-polarity matrix that enables sequential positive- and negative-ion acquisition from a single tissue section, effectively halving sample consumption. DAN ionizes lipids in positive mode and acidic metabolites in negative mode, though with somewhat lower efficiency than dedicated single-polarity matrices. It is particularly valuable when tissue is scarce or when correlating lipid and metabolite distributions in the exact same tissue region.
Norharmane has attracted attention for the FluoMALDI pipeline, in which matrix-induced tissue autofluorescence is used for correlative microscopy. A 2025 comparison by Hahm et al. (Analytica Chimica Acta) evaluated six matrices and found that norharmane produced the strongest autofluorescence enhancement across both green and red/far-red channels, with sublimation favoring red fluorescence and spray coating favoring green. For experiments integrating MALDI-MSI with fluorescence microscopy, norharmane provides a single-matrix solution for both readouts.
Novel Matrices: Reactive Matrices, Ionic Liquid Matrices, and Nitro-Indoles
Several matrix classes have emerged to address coverage gaps. Reactive matrices incorporate a derivatization functionality into the matrix itself — for example, Girard's T derivatives that simultaneously extract and charge-tag carbonyl-containing metabolites — merging the matrix application and on-tissue chemical derivatization steps into one. Ionic liquid matrices (ILMs), formed by combining a conventional matrix acid with an organic base, produce homogeneous liquid coatings with exceptional shot-to-shot reproducibility, though their liquid nature can compromise spatial resolution through lateral diffusion. Nitro-indole derivatives such as 3,4-MNI and p-nitroaniline, reported in 2025, offer dual-polarity performance with improved ionization efficiency for specific lipid classes compared to DAN.
Matrix Selection Decision Tree
The following decision logic synthesizes current evidence into a practical selection workflow:
1. Identify the target analyte class: Lipids (PC, SM, TAG, PE) → start with DHB in positive mode. Small polar metabolites (amino acids, neurotransmitters, organic acids) → CHCA in positive mode or 9-AA in negative mode depending on acidity. Nucleotides and phosphorylated metabolites → 9-AA in negative mode. Proteins/peptides above 5 kDa → sinapinic acid.
2. Assess spatial resolution requirements: Sub-10 um → CHCA (finest crystals) or t-MALDI geometry. 10-50 um → DHB or 9-AA by sublimation. Above 50 um → any matrix; prioritize analyte compatibility.
3. Determine polarity: If only positive-mode acquisition is available, DHB or CHCA. If negative-mode coverage of acidic metabolites is required, 9-AA. If dual-polarity coverage from a single section is needed, DAN or norharmane.
4. Check for multimodal requirements: If correlative fluorescence microscopy is planned, norharmane (FluoMALDI). If H&E staining after MSI, choose a matrix and deposition method that can be washed off (sublimated matrices generally wash more cleanly than sprayed).
This framework avoids the common pitfall of defaulting to DHB for every experiment, which sacrifices negative-mode metabolite coverage unnecessarily. For matrix application services and protocol optimization, Creative Proteomics supports MALDI imaging lipidomics workflows with matrix selection guidance tailored to specific biological questions.
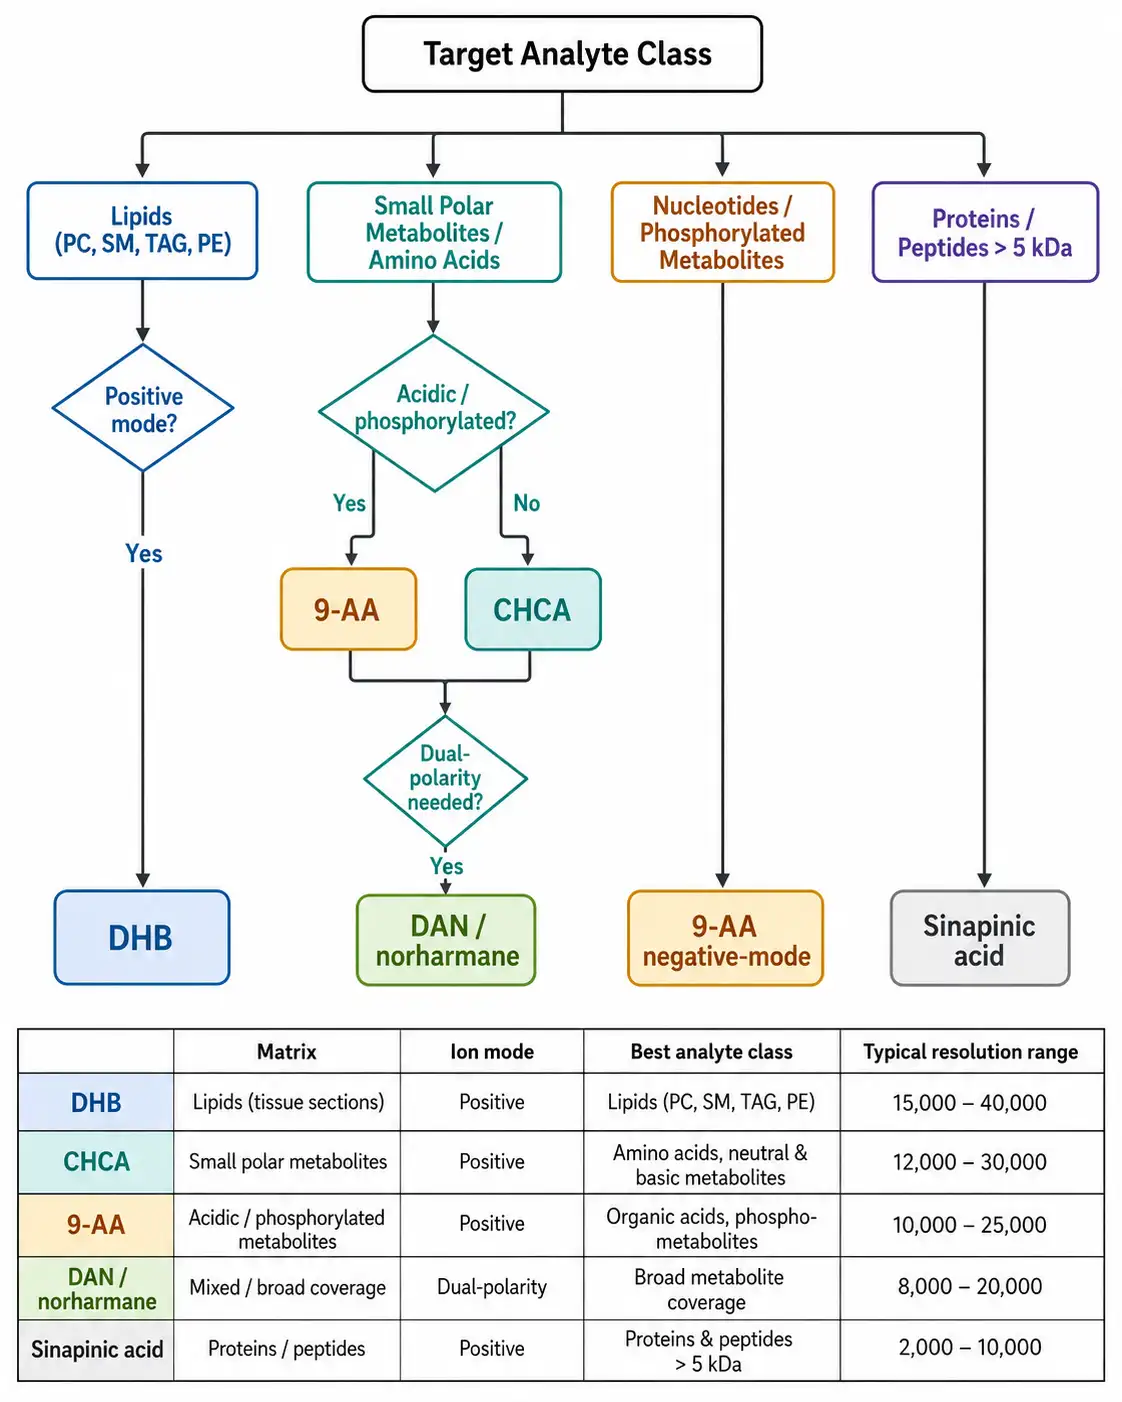 Figure 2: Matrix Selection Decision Tree — Color-Coded Flowchart by Analyte Class
| Matrix | Ion Mode | Target Analytes | Typical Resolution | Key Limitation |
|---|---|---|---|---|
| DHB | Positive | Lipids (PC, SM, TAG), broad metabolites | 10-50 um | Heterogeneous crystals; poor negative mode |
| CHCA | Positive | Amino acids, small peptides, neurotransmitters | <10 um | Hot ionization fragments labile lipids |
| 9-AA | Negative | Organic acids, nucleotides, phosphorylated metabolites | 10-50 um | Useless in positive ion mode |
| DAN | Dual | Lipids + acidic metabolites (single section) | 10-50 um | Lower ionization efficiency than dedicated single-polarity matrices |
| Norharmane | Positive | Lipids, cardiolipins + FluoMALDI fluorescence | 10-50 um | Fewer validated protocols than DHB or CHCA |
Matrix Deposition Methods: Sublimation, Spray, and Beyond
Once the matrix is selected, the deposition method determines crystal size, analyte extraction efficiency, and spatial resolution. The two dominant approaches — sublimation and automated spray coating — embody a fundamental trade-off between spatial fidelity and signal intensity.
Sublimation: Crystal Size Control, Reproducibility, and Limitations
Sublimation deposits matrix onto the tissue surface via a solvent-free vapor-phase process: matrix powder is heated under vacuum in a sublimation chamber, and the vapor condenses as a uniform microcrystalline film on the cooled tissue section. Because no solvent contacts the tissue, analyte delocalization is virtually eliminated, and crystal sizes are tightly controlled — typically 1-5 um for DHB and sub-micron for CHCA under optimized conditions. Sublimation produces the most reproducible inter-experiment and inter-laboratory coatings because the process parameters (temperature, vacuum level, deposition time) are precisely controllable.
The limitation of sublimation is reduced analyte extraction efficiency. Without a solvent to extract analytes from the tissue interior into the matrix layer, only surface-exposed molecules are efficiently ionized. This can result in lower overall signal intensity compared to spray-deposited matrices, particularly for analytes deeply embedded in lipid-rich membranes. A 2025 study by Spears et al. (Analytical Chemistry) systematically compared sublimation versus automated pneumatic spraying for CHCA, DHAP, and DHB across mouse brain, heart, and kidney: only a subset of the lipid spectrum showed significant sensitivity differences between methods, indicating that the sublimation penalty is analyte- and tissue-dependent rather than universal.
Recirculating sublimation systems with controlled crystallization temperature (CCT) have recently pushed crystal sizes below 0.2 um, enabling sustained imaging at 5 um lateral resolution without matrix-imposed limitations. This is particularly relevant for t-MALDI-2 experiments targeting single-cell resolution.
Automated Sprayers: TM-Sprayer, HTX, and SunCollect
Automated pneumatic sprayers deposit matrix dissolved in an organic solvent (typically 50-70% methanol or acetonitrile with 0.1-0.2% TFA) as a fine aerosol onto the tissue surface. Commercial systems include the HTX TM-Sprayer, HTX M3/M5, and SunCollect series. These instruments control flow rate, nozzle temperature, gas pressure, and number of spray passes, enabling operator-independent reproducibility.
Spray deposition provides superior analyte extraction compared to sublimation because the solvent penetrates the tissue, extracting analytes into the matrix layer. This typically yields higher signal intensity for deeply embedded analytes, particularly membrane lipids and hydrophobic metabolites. The trade-off is analyte delocalization: the solvent front can carry analytes laterally across the tissue before drying, blurring spatial features. The degree of delocalization depends on the solvent composition, spray wetness, and tissue type — lipid-rich brain tissue is particularly susceptible.
The FluoMALDI pipeline (Hahm et al., 2025) demonstrated that for norharmane, spray coating produced stronger green-channel autofluorescence while sublimation favored red/far-red channels, adding a secondary dimension to the deposition method choice when correlative imaging is planned.
Method Selection by Spatial Resolution Target and Analyte Class
A practical selection guide:
- Target resolution below 10 um: Sublimation is mandatory. Spray delocalization defeats the resolution gain.
- Target resolution 10-50 um, lipid-focused: Either method works; test both on a pilot section. Sublimation if reproducibility across a batch is the priority; spray if maximizing signal for low-abundance lipids is the priority.
- Target resolution above 50 um, peptide or protein targets: Automated spray with CHCA or sinapinic acid. Solvent extraction is beneficial for these larger, less surface-accessible analytes.
- Clinical cohort with many samples: Sublimation for batch-to-batch reproducibility; automated spray for speed if resolution permits.
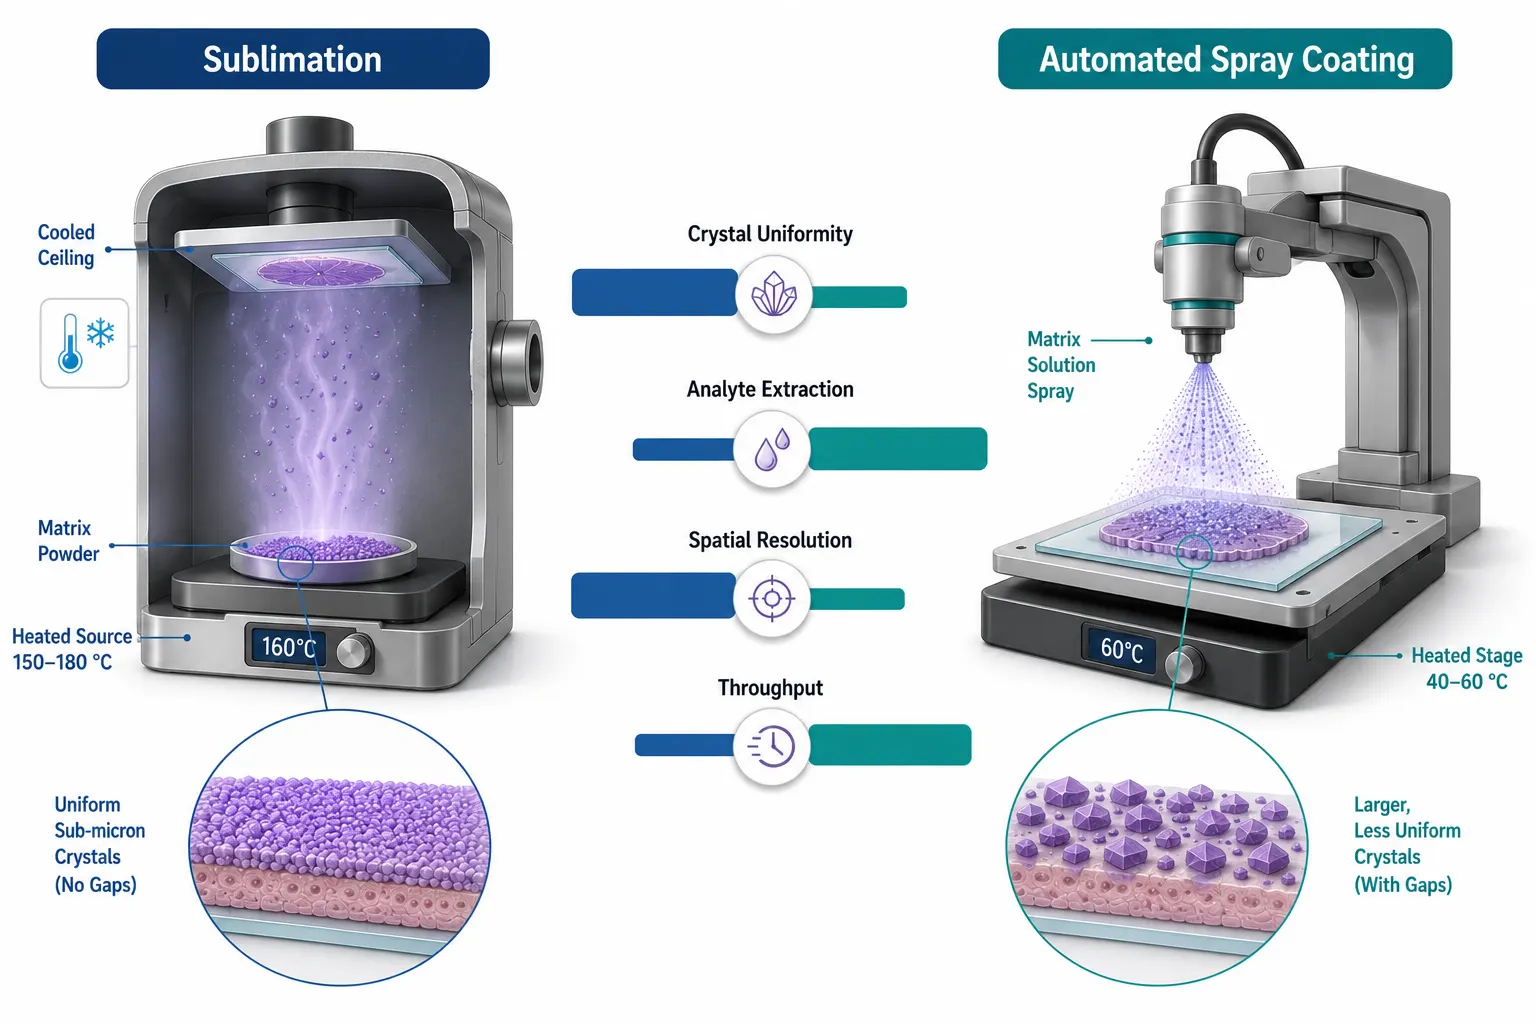 Figure 3: Matrix Deposition Methods Comparison — Side-by-Side Sublimation vs. Spray 3D Illustration
Instrumentation and Acquisition Parameters
Laser Repetition Rate and Throughput: From 1 kHz to 10 kHz+
Conventional MALDI-MSI instruments equipped with 1-2 kHz Nd:YAG lasers require 30-60 minutes for a 10 x 10 mm tissue area at 50 um resolution. Modern systems incorporating 10 kHz lasers reduce this to under five minutes for the same area, removing the throughput bottleneck that historically limited MALDI-MSI in clinical cohort studies and drug distribution screening. Bruker's timsTOF fleX platform combines a 10 kHz laser with trapped ion mobility spectrometry (TIMS), adding collisional cross-section (CCS) as a fourth analytical dimension (x, y, m/z, CCS) for gas-phase separation of isobaric lipids.
The laser repetition rate interacts with the mass analyzer: a 10 kHz laser firing at 50 um spacing across a 10 x 10 mm area generates 40,000 pixels. At 10,000 spectra per second, acquisition is complete in 4 seconds — but only if the mass analyzer can keep pace. TOF analyzers cycle in microseconds and match 10 kHz operation naturally; Orbitrap analyzers with approximately 100 ms transient times are the rate-limiting step in hybrid configurations.
t-MALDI-2 Post-Ionization: Mechanism, Ion Yield, and Subcellular Capability
MALDI-2 is a post-ionization technique in which a second laser pulse — typically 266 nm or 355 nm, fired orthogonally to the MALDI axis — intercepts the expanding desorption plume approximately 10-100 us after the primary MALDI event. The secondary laser ionizes neutral analyte molecules that were desorbed but not charged by the primary MALDI process, boosting ion yield by two to three orders of magnitude for most analytes. First demonstrated by Soltwisch et al. (Science, 2015), MALDI-2 has since been commercialized on Bruker platforms and extended to transmission-mode geometry (t-MALDI-2) for subcellular imaging.
The physical mechanism underlying MALDI-2 is believed to involve resonant multiphoton ionization of matrix-generated neutrals, with the matrix acting as a photo-sensitizer for the secondary ionization. The gain factor is analyte-dependent: endocannabinoids show up to 5,000-fold enhancement (Salviati et al., Talanta, 2025), while most phospholipids gain 50-500 fold. Chen et al. (Analytical Chemistry, 2025) demonstrated that MALDI-2 extends coverage to 13C-labeled glycolytic and TCA cycle intermediates that are undetectable by conventional MALDI, opening spatial stable-isotope tracing experiments in tissue.
The t-MALDI-2 configuration (Bessler et al., Analytical Chemistry, 2026) has achieved routine single-cell lipidomics at 1-5 um pixel sizes with integrated immunofluorescence microscopy for correlative cell-type identification. This positions t-MALDI-2 as a bridge between conventional MALDI-MSI and SIMS-level spatial resolution, but with far broader molecular coverage.
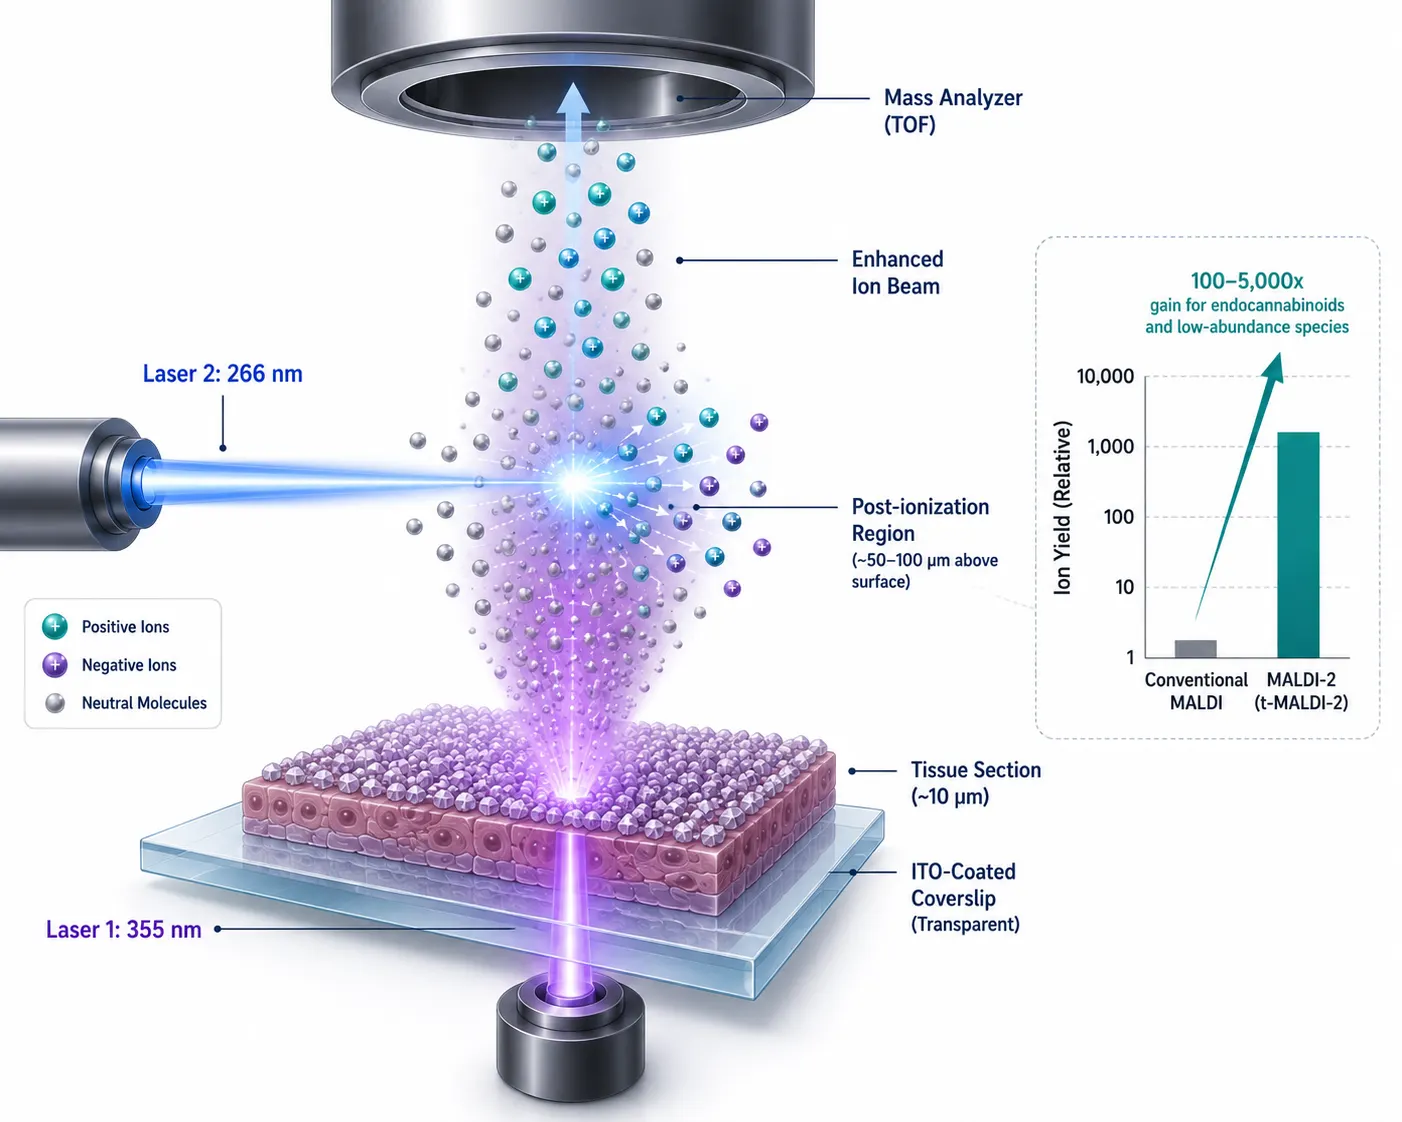 Figure 4: t-MALDI-2 Post-Ionization Mechanism — Dual-Laser Diagram with Ion Yield Enhancement
A scientific illustration of the t-MALDI-2 dual-laser setup: the primary MALDI laser (355 nm) fires upward through a transparent substrate, generating a desorption plume containing both charged ions and neutral molecules. A second laser (266 nm) intersects the plume orthogonally, post-ionizing neutrals and boosting ion yield by 100-5,000x. An inset bar chart compares conventional MALDI ion yield against MALDI-2 enhancement across representative analyte classes.
Transmission vs. Reflection Geometry; Polarity Switching and MS/MS
Reflection-geometry MALDI fires the laser onto the top surface of the tissue-matrix layer at a 30-60 degree angle. It is the standard configuration for all commercial instruments with the tissue on a conductive slide. Transmission-mode MALDI (t-MALDI) fires the laser through a transparent substrate (indium tin oxide-coated glass coverslip) from below, reducing the effective laser spot to approximately 1 um diameter. The trade-off is that t-MALDI requires thin tissue sections (5-10 um) mounted on specialized substrates and is sensitive to tissue thickness variations.
Polarity switching — acquiring alternating positive- and negative-ion spectra at each pixel — doubles the molecular information per tissue section. On TOF instruments with fast polarity switching (sub-100 ms), dual-polarity acquisition at 20-50 um resolution is practical for most tissue sizes. FTICR and Orbitrap instruments have slower polarity switching, making dual-polarity acquisition per pixel impractical; serial sections analyzed in opposite polarities are the common workaround. On-tissue MS/MS, whether data-dependent (DDA) or targeted (MRM), confirms molecular identity and resolves isobaric interferences. Creative Proteomics provides untargeted metabolomics services including MS/MS-based identification, which can complement MALDI-MSI discovery datasets with orthogonal LC-MS validation.
Data Analysis for MALDI-MSI: From Raw Spectra to Biological Insight
A MALDI-MSI acquisition generates a four-dimensional data structure: x coordinate, y coordinate, m/z value, and ion intensity. The data volume — routinely 10-100 GB per experiment — demands computational infrastructure and a structured analysis pipeline.
Preprocessing: Baseline Correction, Normalization, Peak Picking, and Alignment
Raw MALDI-MSI spectra require five sequential preprocessing steps. (1) Baseline correction subtracts the broad chemical background from matrix clusters and electronic noise, typically using TopHat or median-filter algorithms. (2) Noise reduction via Savitzky-Golay smoothing or wavelet denoising improves peak detection reliability. (3) Spectral normalization compensates for pixel-to-pixel variation in total ion current (TIC), matrix coating thickness, and tissue ionization efficiency — TIC normalization is the most common default, but median fold change normalization and probabilistic quotient normalization (PQN) are preferred when large systematic intensity variations exist across tissue subregions. (4) Peak picking identifies monoisotopic peaks above a signal-to-noise threshold (typically S/N > 3-5), generating a peak list for subsequent statistical analysis. (5) Peak alignment across all pixels compensates for sub-pixel mass drift, typically using reference lock-mass peaks or nonlinear alignment algorithms.
AI/ML Integration: CNNs, Self-Supervised Learning, and Automated Annotation
Artificial intelligence and machine learning are transforming MALDI-MSI data analysis beyond traditional univariate statistics. The 2025 landscape spans three primary ML paradigms.
Convolutional neural networks (CNNs) exploit the spatial structure of MSI data by operating on pixel patches rather than individual spectra. MSInet, a self-supervised CNN framework published by Shah et al. (Analytical Chemistry, 2025), achieved an Adjusted Rand Index of 0.89 and Normalized Mutual Information of 0.86 for pixel-wise tissue segmentation without requiring any manual annotations. The architecture uses superpixel-guided refinement to enforce local spatial consistency and patch-wise contrastive learning to capture global semantic relationships across distant tissue regions. On mouse brain MALDI-MSI, MSInet delineated anatomical subregions with a Silhouette Coefficient of 0.78.
A complementary approach uses transfer learning from pre-trained computer vision models. A 2025 study applied fine-tuned ResNet18 to 32 x 32 pixel MALDI-MSI patches reduced to 3-channel PCA pseudo-RGB images, achieving 76.2% test accuracy for colorectal cancer tissue classification — outperforming 1D spectral-only CNNs by incorporating spatial context.
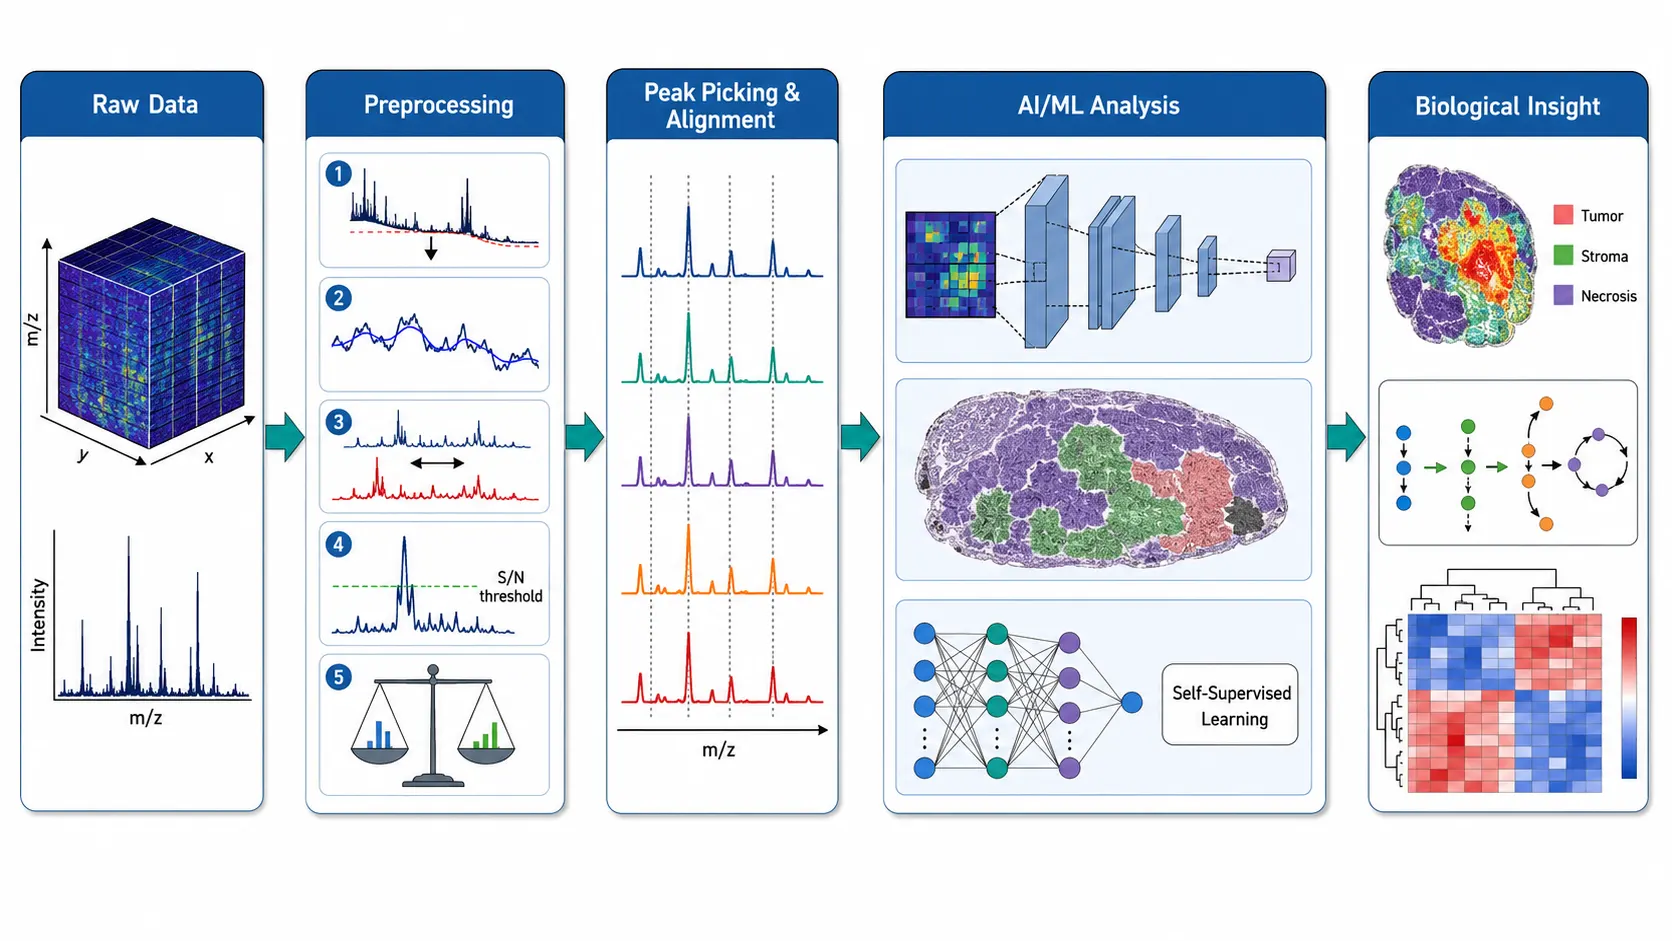 Figure 5: MALDI-MSI Data Analysis Pipeline — Five-Stage Horizontal Workflow with AI/ML Integration
A five-stage horizontal workflow diagram: (1) Raw Data as a 3D data cube (x, y, m/z), (2) Preprocessing with baseline correction, smoothing, alignment, peak picking, and normalization, (3) Peak Picking & Alignment with aligned spectra, (4) AI/ML Analysis showing a CNN architecture processing MSI pixel patches with self-supervised learning, and (5) Biological Insight with tissue heatmap overlays and annotated molecular signatures.
Farhan and Wang (Mass Spectrometry, 2025) reviewed the broader AI-for-MALDI landscape, noting rapid exponential growth in publications and identifying data quality — specifically, matrix coating homogeneity and spectral preprocessing — as the primary determinant of ML model performance, more so than model architecture choice.
Spatial Segmentation and Software Platforms
Self-organizing maps (SOMs) and k-means clustering remain the most widely used unsupervised spatial segmentation methods for exploratory analysis of MALDI-MSI data, mapping tissue regions with distinct spectral profiles without requiring a priori histological knowledge. Supervised methods — including random forests, support vector machines, and partial least squares discriminant analysis (PLS-DA) — are preferred when ground-truth histopathology annotations are available for training.
Software platforms for MALDI-MSI data analysis span commercial and open-source options. SCiLS Lab (Bruker) provides integrated preprocessing, multivariate analysis, and spatial visualization. MSiReader (open-source, North Carolina State University) offers a freely available environment for data exploration and quantitation. METASPACE (European Molecular Biology Laboratory) provides cloud-based molecular annotation using the METASPACE metabolite database for confidence scoring of tentative identifications. The choice of platform depends on the instrument vendor, the analysis complexity, and whether custom ML workflows — which typically require Python-based environments with TensorFlow or PyTorch — are planned. For researchers requiring customized statistical modeling or multivariate analysis that extends beyond vendor software capabilities, Creative Proteomics provides bioinformatics for metabolomics support including tailored MSI data processing pipelines for spatial metabolomics and lipidomics datasets.
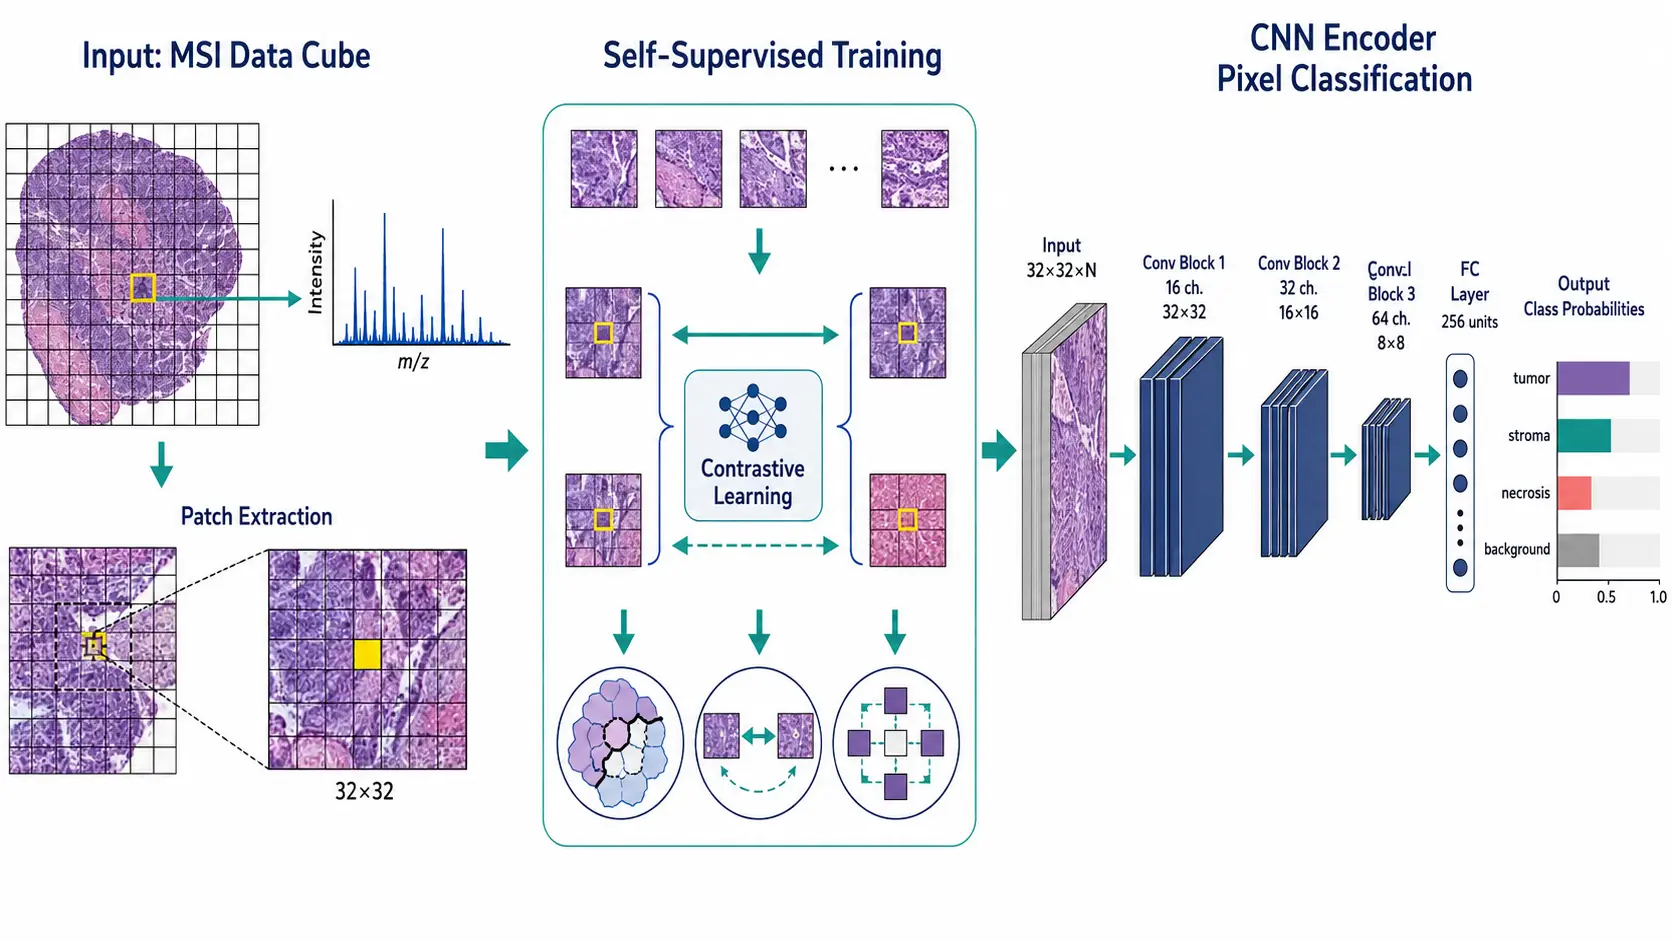 Figure 6: CNN Pixel Classification for MALDI-MSI — Self-Supervised Learning Concept Diagram
A two-part diagram: the left side shows a tissue section with grid overlay, a representative mass spectrum from one pixel, and extraction of a 32x32 pixel patch capturing spatial context. The right side shows a simplified CNN architecture — three convolutional blocks processing the patch tensor, a fully connected layer, and an output layer producing pixel-wise class probability distributions (tumor, stroma, necrosis, background). A central panel illustrates the self-supervised contrastive learning concept.
Key Applications
Clinical Tissue Classification: Tumor vs. Normal and Molecular Subtyping
MALDI-MSI is increasingly deployed for molecular pathology applications in which metabolic and lipidomic signatures supplement conventional H&E histology. In oncology, MALDI-MSI-derived lipid profiles have classified tumor versus normal tissue with diagnostic accuracies exceeding 90% in breast, colorectal, and brain cancer studies, with the added benefit that no antibody or probe is required — the molecular signature emerges from the endogenous metabolome. A representative study of breast cancer xenografts demonstrated that PC 34:1 and SM 34:1 enrichment patterns at the tumor-stroma interface discriminated invasive margins from tumor core with greater spatial precision than H&E alone, while phosphatidylinositol species mapped specifically to hypoxic regions identified by pimonidazole staining. In glioblastoma, MALDI-MSI of 5-aminolevulinic acid (5-ALA)-guided biopsies revealed that the metabolic boundary between tumor and adjacent brain extends beyond the fluorescent margin, informing surgical resection strategies. Molecular subtyping of histologically ambiguous tumors using MALDI-MSI lipid fingerprints is an active area of translational research, though regulatory qualification for clinical deployment remains under development.
Lipidomics and Metabolomics in Tissue Context
The most mature application space for MALDI-MSI is spatial lipidomics, where DHB-sublimated tissue sections reveal phospholipid distributions across anatomical microstructures at 10-50 um resolution. A typical experiment maps PC, SM, phosphatidylethanolamine (PE), and phosphatidylinositol (PI) species across a tissue section, generates ion images for 200-500 individual lipid features after peak filtering, and applies spatial segmentation algorithms to identify tissue regions with distinct lipidomic signatures — for example, separating gray matter (enriched in PC 38:6, PC 36:1) from white matter (enriched in SM 36:1, PC 36:0) in brain sections. The combination of positive-ion DHB and negative-ion 9-AA imaging from serial sections extends coverage to cardiolipins, sulfatides, and free fatty acids. For researchers studying metabolic diseases, the ability to co-localize lipid accumulation with specific cell populations — adipocytes, hepatocytes, foam cells — directly on tissue provides histopathological context that bulk lipidomics cannot. Creative Proteomics offers dedicated workflows for MALDI imaging lipidomics, supporting untargeted spatial lipidomics discovery and targeted lipid-class analysis across diverse tissue types, with custom matrix selection and deposition protocols optimized per tissue type — including sublimation for high-resolution applications and spray coating for maximum lipid coverage.
Drug Distribution and Metabolite Imaging
Label-free drug imaging by MALDI-MSI has become a standard tool in preclinical pharmaceutical development. A drug candidate and its metabolites are simultaneously detected in target tissues without radiolabeling or immunohistochemistry, enabling quantitative assessment of tissue penetration, metabolite formation, and target engagement. A representative application is imaging tyrosine kinase inhibitor (TKI) distribution in brain metastasis models: MALDI-MSI maps both the parent TKI and its N-desmethyl metabolite across the blood-brain barrier interface, revealing whether the drug reaches the metastatic core at pharmacologically relevant concentrations and whether efflux transporters at the tumor periphery create a penetration gradient. The technique has been extended to MALDI-HiPLEX-IHC, a multimodal workflow that integrates MALDI drug imaging with multiplexed immunohistochemistry on the same or serial tissue sections, co-registering drug distribution with cell-type markers (e.g., CD31 for vasculature, CD8 for T cells, Ki-67 for proliferation) for in situ PK/PD profiling. This convergence of spatial metabolomics and spatial proteomics is addressed in our article on MS-based spatial proteomics.
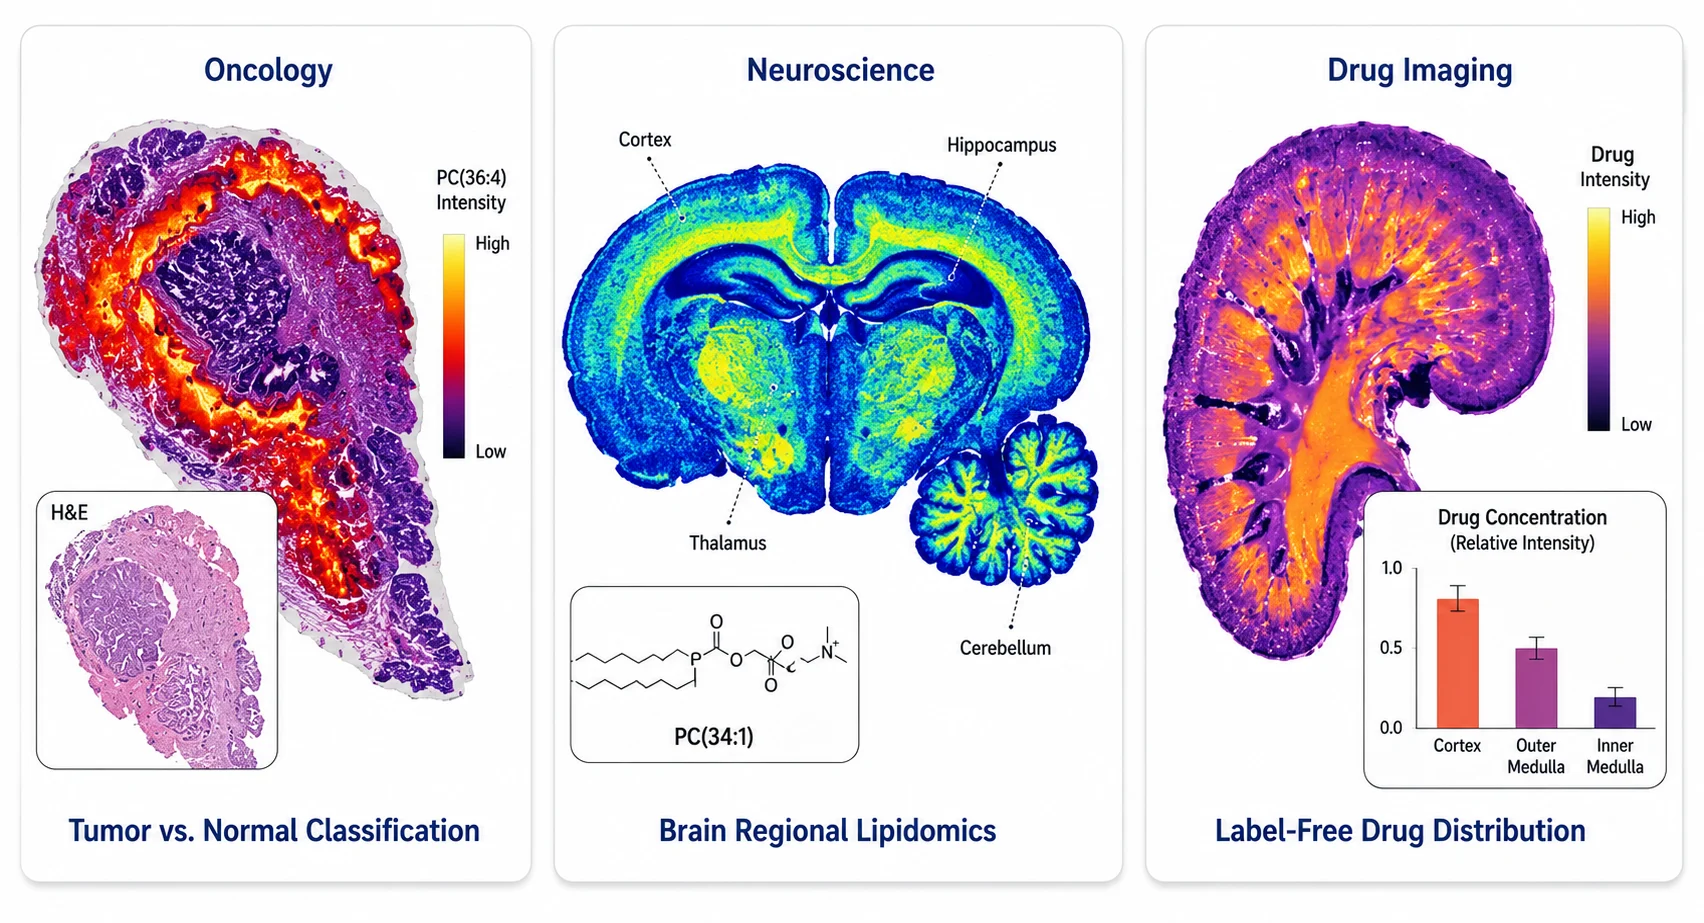 Figure 7: Application Examples Gallery — Three-Panel Molecular Imaging Results
A three-panel gallery: Oncology (tumor section with red-to-yellow lipid heatmap at the invasive margin, H&E comparison inset), Neuroscience (mouse brain coronal section with blue-to-green heatmap showing regional lipid heterogeneity across cortex, hippocampus, and cerebellum), and Drug Imaging (kidney section with purple-to-orange heatmap of drug compound distribution from cortex to medulla, concentration gradient bar chart inset).
Troubleshooting Common MALDI-MSI Issues
Low Signal or No Signal
Insufficient ion intensity most commonly arises from inadequate matrix coverage, incorrect matrix choice for the target analyte class, or excessive laser fluence causing matrix ablation rather than controlled desorption. Systematic troubleshooting should address each in order: (1) verify matrix deposition quality (uniform crystal coverage under light microscopy); (2) confirm matrix-analyte compatibility using the decision framework above; (3) test a laser fluence gradient (typically 40-80% of maximum on commercial instruments) to identify the optimal energy window. If using sublimation, consider whether a post-sublimation recrystallization step with 5-10% methanol vapor would improve extraction.
Analyte Delocalization Artifacts
Delocalization manifests as blurred ion images where molecular boundaries extend beyond anatomical structures, and is caused by solvent-mediated lateral diffusion during wet matrix deposition. Prevention is straightforward: use sublimation for applications requiring spatial resolution below 20 um, reduce spray wetness (lower flow rate, increased nozzle temperature) when spray is unavoidable, and always verify delocalization on a test section before committing precious samples. On-tissue chemical derivatization introduces an additional delocalization vector — the derivatization solvent — and should be validated with a control section processed without reagent.
Matrix Cluster Interference
Matrix clusters — repeating ions of the form [nM+H]+ or [nM-H]- — produce dense peak forests in the low-mass region (m/z < 500 for DHB, m/z < 400 for CHCA) that can obscure small metabolite signals. Mitigation strategies include: using matrices with lower cluster propensity (CHCA produces fewer clusters than DHB in the m/z 200-400 range), applying thinner matrix coatings via sublimation, and using MALDI-2 post-ionization which shifts the ionization mechanism and reduces cluster contributions. When matrix clusters cannot be eliminated, MS/MS filtering or ion mobility separation provides post-acquisition deconvolution.
Batch Effects Across Sections
Systematic intensity variation across tissue sections processed in different batches is the bane of cohort-scale MALDI-MSI studies. Best practices for mitigation: (1) randomize sample processing order; (2) include a quality control tissue section (e.g., a commercially available tissue homogenate section) in each batch; (3) apply batch correction algorithms (ComBat, which originated in microarray analysis, has been adapted for MSI data); and (4) use internal standards deposited onto the tissue or slide surface for pixel-level normalization. Our article on quantitative mass spectrometry imaging covers calibration strategies — including mimetic tissue models and per-pixel internal standards — in greater depth.
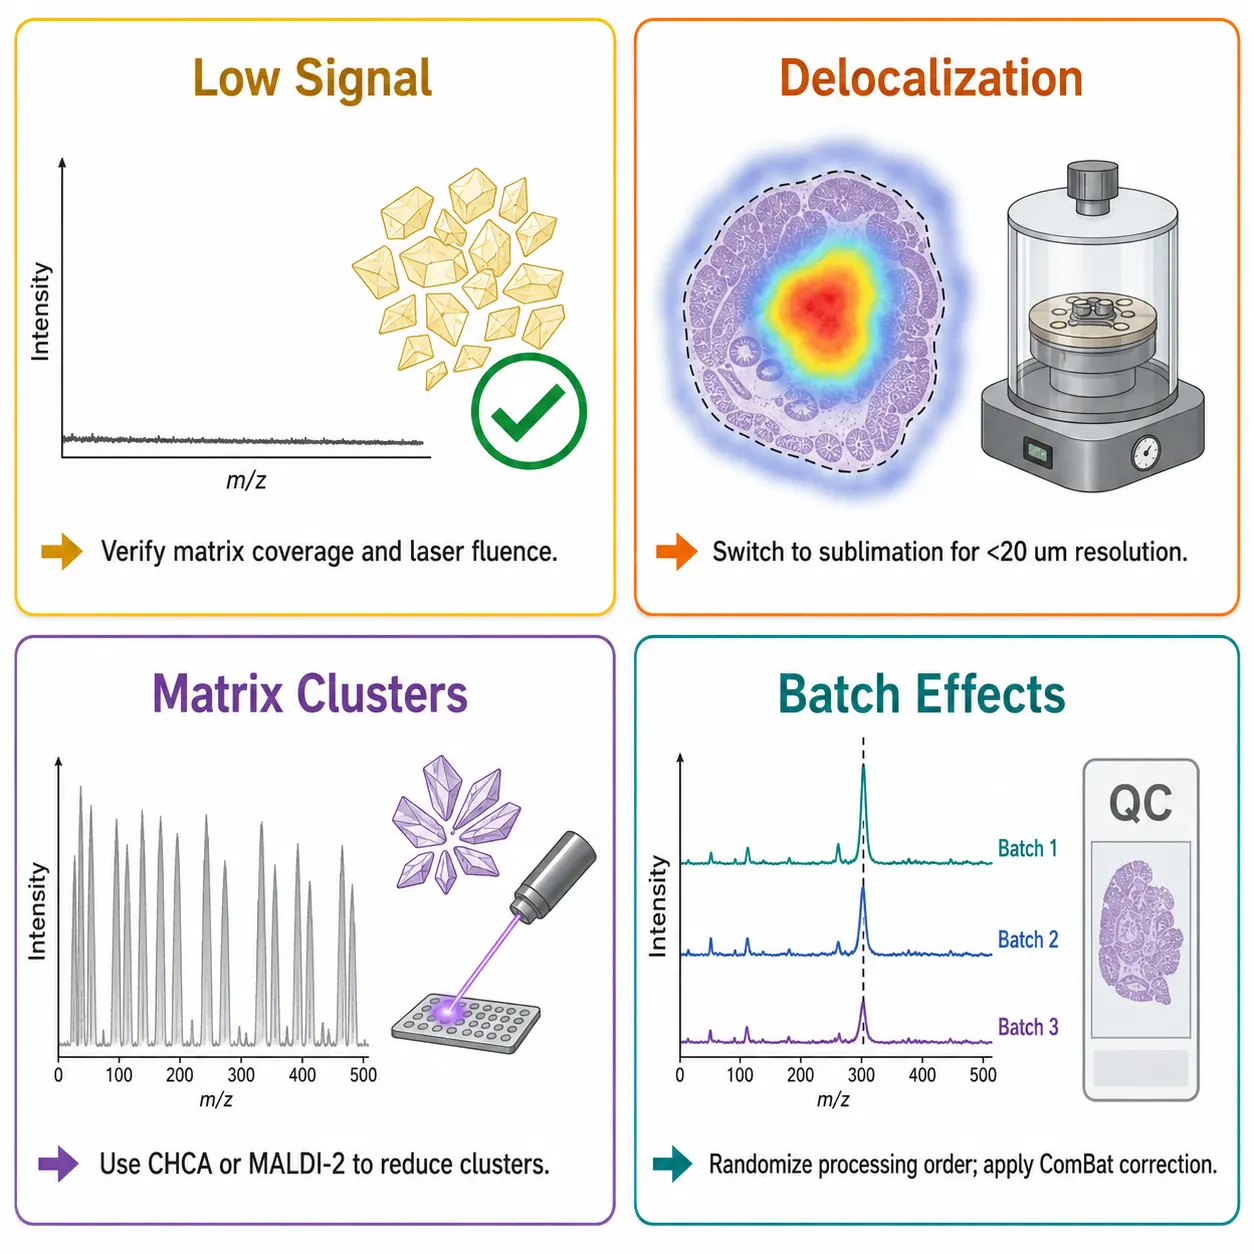 Figure 8: Common MALDI-MSI Artifacts and Troubleshooting Guide — Visual Reference
A 2x2 quadrant troubleshooting guide: Low Signal (mass spectrum with barely visible peaks + matrix coverage verification icon), Delocalization (blurred ion heatmap extending beyond tissue boundary + sublimation chamber solution icon), Matrix Clusters (dense repetitive matrix peaks in m/z 0-500 obscuring metabolites + CHCA/MALDI-2 solution icon), and Batch Effects (three overlaid spectra with intensity variation across batches + QC section and ComBat correction icon).
All MALDI mass spectrometry imaging metabolomics services described in this article are provided for Research Use Only (RUO). These workflows are not intended for diagnostic, therapeutic, or clinical decision-making purposes.
FAQ
Q: Which matrix should I start with if I have never done MALDI-MSI before?
A: DHB by sublimation in positive ion mode. It provides the broadest lipid coverage, the most reproducible coating, and the lowest risk of delocalization artifacts. Once you have reproducible results with DHB, expand to 9-AA for negative-mode metabolites or CHCA for higher resolution as your biological questions demand.
Q: Can I do MALDI-MSI on FFPE tissue?
A: Yes, but with significant limitations. Formalin fixation crosslinks proteins and depletes small metabolites; paraffin embedding further removes lipids during xylene clearing. FFPE-MSI is primarily used for N-glycan imaging after antigen retrieval, tryptic peptide imaging for spatial proteomics, and residual lipid detection. Fresh-frozen tissue is strongly preferred for untargeted spatial metabolomics.
Q: How do I know whether my matrix coating is good enough?
A: Inspect the coated slide under a light microscope before inserting it into the instrument. A good coating shows a uniform, fine-grained crystal layer across the entire tissue without visible gaps, large crystal aggregates, or areas where the tissue appears wet or smeared. For DHB sublimated onto brain tissue, the surface should appear as a pale yellow, matte finish with no visible crystalline structures at 10x magnification.
Q: Is MALDI-2 worth the additional instrument cost?
A: If your research requires detecting low-abundance analytes — endocannabinoids, steroid hormones, phosphorylated metabolic intermediates — that are at or below the detection limit of conventional MALDI, then yes, the 100-5,000x signal gain is transformative. For routine lipid imaging of abundant phospholipid classes (PC, SM), conventional MALDI is sufficient and MALDI-2 provides marginal benefit.
Q: What software should I use for MALDI-MSI data analysis?
A: Start with your instrument vendor's software (SCiLS Lab for Bruker, ImageQuest for Thermo, MassImager for Shimadzu) for data conversion and basic visualization. For custom analysis, MSiReader (free, open-source) handles most vendor formats. For AI/ML-driven analysis — CNNs, self-supervised segmentation, deep learning — you will need a Python environment with TensorFlow or PyTorch; reference implementations of MSInet are available on GitHub.
Q: How many biological replicates do I need for a MALDI-MSI study?
A: For discovery-phase spatial metabolomics, n = 3-5 biological replicates per group is the minimum standard, with at least two technical replicate sections per biological replicate. For classification studies intended to support translational findings, n = 8-12 per group is increasingly expected by reviewers. Power calculations for MSI are complicated by the fact that each pixel is not an independent observation — spatial autocorrelation must be modeled.
References:
- Buchberger AR, DeLaney K, Johnson J, Li L. Mass spectrometry imaging: a review of emerging advancements and future insights. Analytical Chemistry, 2018; 90(1): 240-265. doi:10.1021/acs.analchem.7b04733
- Soltwisch J, Kettling H, Vens-Cappell S, Wiegelmann M, Muthing J, Dreisewerd K. Mass spectrometry imaging with laser-induced postionization. Science, 2015; 348(6231): 211-215. doi:10.1126/science.aaa1051
- Spears I, Lagdameo G, Black A, et al. To spray or to sublimate: considerations for the matrix application of three common positive ion mode matrices. Analytical Chemistry, 2025; 97(35): 19001-19008. doi:10.1021/acs.analchem.5c01767
- Hahm TH, Wang W, Brown DR, et al. MALDI matrix sublimation versus spray coating in the FluoMALDI imaging pipeline. Analytica Chimica Acta, 2025; 1376: 344610. doi:10.1016/j.aca.2025.344610
- Farhan A, Wang YS. Recent applications of artificial intelligence and related technical challenges in MALDI MS and MALDI-MSI: a mini review. Mass Spectrometry (Tokyo), 2025; 14: A0175. doi:10.5702/massspectrometry.A0175
- Shah M, Liu S, Guo L, Zhang Y, Deng L, Xu X, et al. MSInet: a self-supervised CNN framework integrating global and local context for robust mass spectrometry imaging segmentation. Analytical Chemistry, 2025. doi:10.1021/acs.analchem.5c04885
- Salviati E, Guida F, La Gioia D, et al. Enhanced visualization of endocannabinoids spatial distribution in mouse brain via MALDI-2 mass spectrometry imaging. Talanta, 2025; 290: 127811. doi:10.1016/j.talanta.2025.127811
- Chen Y, Song Y, Yang Z, et al. Optimized MALDI-2 mass spectrometry imaging for stable isotope tracing of tissue-specific metabolic pathways in mice. Analytical Chemistry, 2025; 97(1): 499-507. doi:10.1021/acs.analchem.4c04600
- Bessler S, Richter M, Schwenzfeier J, et al. Integrated single-cell mass spectrometry imaging and immunofluorescence microscopy for multimodal characterization of human immune cells. Analytical Chemistry, 2026; 98(14). doi:10.1021/acs.analchem.6c00381
- Bezdeková D, Hendrych M, Schwenzfeier J, et al. Ozonization for MALDI-2 mass spectrometry imaging of carbon-carbon double bond positional isomers of phosphatidylethanolamines in biological tissues. Analytica Chimica Acta, 2026; 1382: 344814. doi:10.1016/j.aca.2025.344814














