

Why Spatial Drug Imaging — Plasma PK Is Not Tissue PK
The Drug Distribution Problem: Tumor Penetration, BBB, and Tissue Sequestration
Plasma pharmacokinetics tells you how much drug circulates in blood. It does not tell you whether the drug actually reaches its target. Three distribution barriers dominate drug development failure: the blood-brain barrier (BBB), which excludes the vast majority of small molecules and nearly all biologics from the CNS parenchyma; the tumor interstitial pressure gradient, which limits drug penetration to 3-5 cell diameters from the nearest blood vessel for many chemotherapeutics; and tissue-specific sequestration, where drugs accumulate in off-target compartments — chloroquine in kidney pelvis, amiodarone in lung, cisplatin in renal proximal tubules — at concentrations that plasma measurements cannot predict.
A 2025 Medicinal Research Reviews analysis by Zou et al. documented that spatial heterogeneity in drug distribution accounts for a substantial fraction of efficacy failures in oncology, where tumor regions distant from functional blood vessels may receive far less drug exposure than well-perfused regions at the same plasma concentration. Bulk tissue homogenization for LC-MS/MS averages this heterogeneity into a single number, masking the difference between a tumor core with zero drug and a tumor periphery at therapeutic concentration. Spatial mass spectrometry imaging (MSI) resolves this problem at its root: it measures drug concentration at each pixel across a tissue section, preserving the spatial information that homogenization destroys.
MSI vs. LC-MS/MS Homogenates and Autoradiography — The Label-Free Advantage
Traditional drug distribution methods each have a fatal limitation. LC-MS/MS of tissue homogenates provides absolute quantification but loses all spatial information — you know how much drug is in the kidney, but not whether it is in the cortex, medulla, or pelvis. Quantitative whole-body autoradiography (QWBA) preserves spatial information but requires radiolabeling the drug — a significant synthesis investment per compound — and cannot distinguish parent drug from metabolites (the radiographic signal captures all radiolabeled species indiscriminately). Immunohistochemistry detects the drug or its target but requires a validated antibody against each compound — impractical for early-stage screening across multiple candidates.
MSI eliminates all three trade-offs simultaneously. It is label-free — no radiolabel, no antibody, no fluorescent tag. It is molecularly specific — the mass analyzer distinguishes parent drug (m/z 320.2 for chloroquine) from its desethyl metabolite (m/z 292.2) and from endogenous lipids at nearby masses. And it preserves spatial context at resolutions from 1 μm (ToF-SIMS) to 50 μm (DESI), mapping drug distribution onto tissue histology. For a deeper orientation to the MSI technology landscape, see our spatial metabolomics guide.
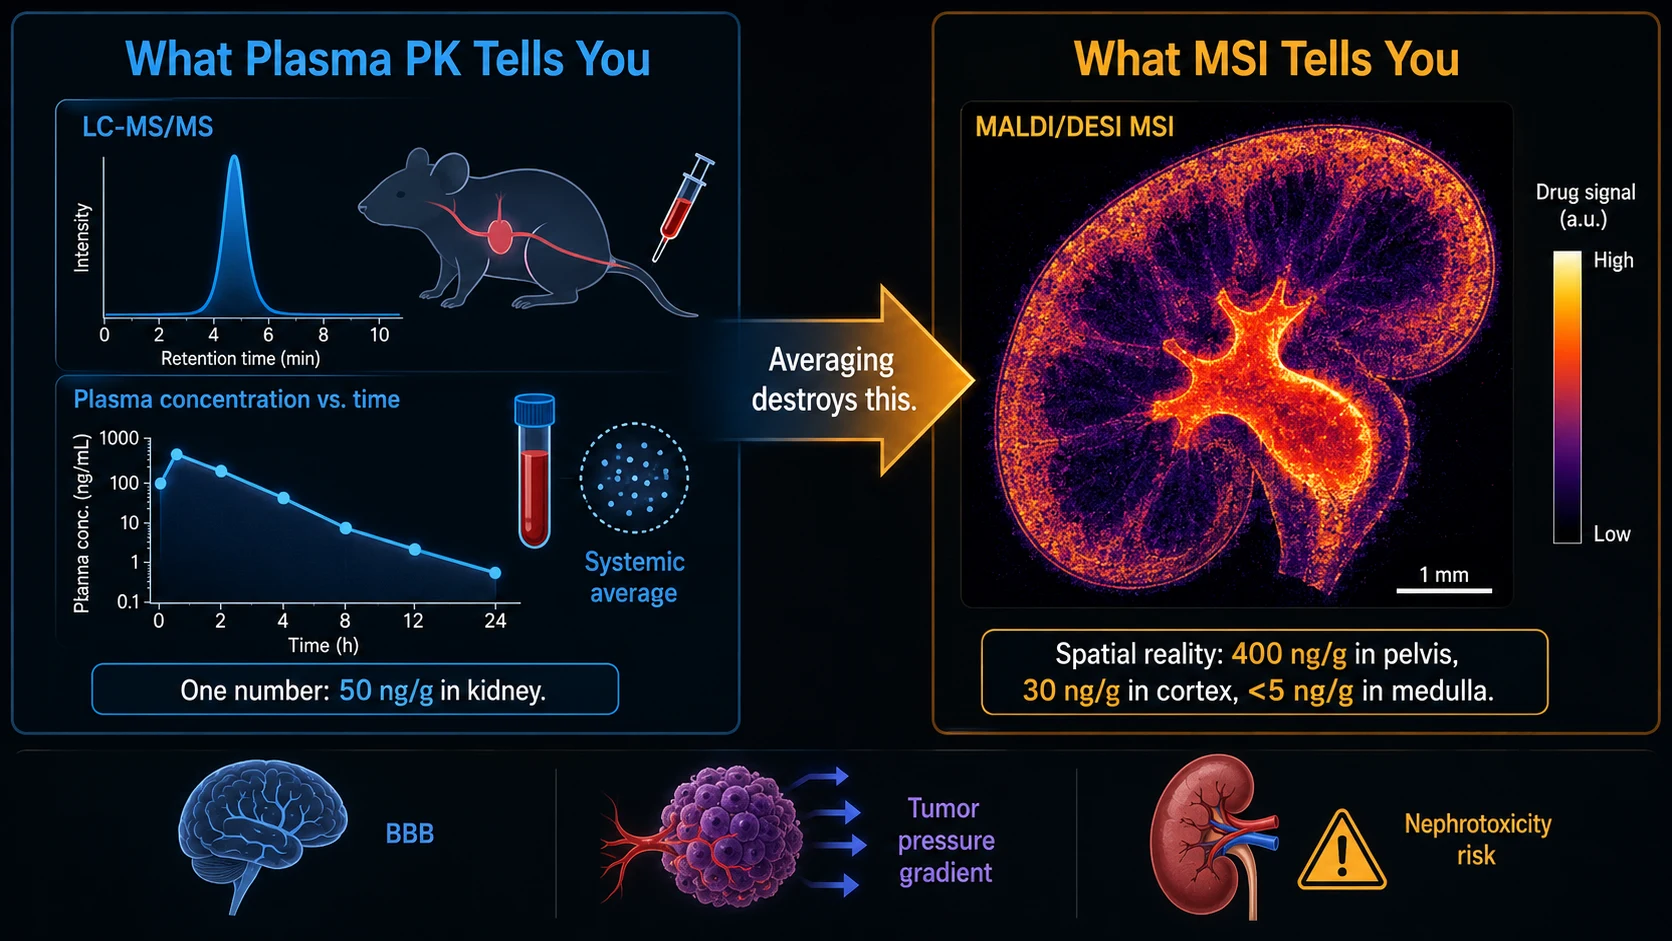 Figure 1: Plasma PK vs. Tissue Drug Imaging — Why Bulk Concentration Data Misses Spatial Heterogeneity. A side-by-side comparison infographic in three panels: (top) a plasma concentration-time curve showing a classic biphasic PK profile, with the annotation "Plasma PK tells you when — not where"; (middle) a cross-sectional schematic of a solid tumor with a drug concentration heatmap overlaid, showing steep gradients from blood vessels (red, therapeutic levels) to the necrotic core (blue, sub-therapeutic levels) — the heterogeneity that bulk LC-MS/MS of tumor homogenate averages into a single number; (bottom) a matched pair of MALDI-MSI ion images showing a drug (left, m/z 320.2) and its active metabolite (right, m/z 292.2) with different spatial distributions in the same tissue section. Callout boxes highlight the three key drug distribution barriers: the blood-brain barrier, the tumor interstitial pressure gradient, and tissue-specific sequestration.
MSI Platforms for Drug Detection
MALDI-MSI for Drug Imaging — Sensitivity, Matrix Interference, and Drug Class Considerations
Matrix-assisted laser desorption/ionization (MALDI) is the most widely adopted MSI platform for drug imaging, offering 5-20 μm spatial resolution and attomole-to-femtomole sensitivity for most small-molecule drugs. The key operational decision is matrix selection: CHCA (α-cyano-4-hydroxycinnamic acid) works well for most basic drugs and peptides in positive ion mode; DHB (2,5-dihydroxybenzoic acid) favors lipids and acidic drugs in negative mode; DAN (1,5-diaminonaphthalene) enables electron-transfer dissociation for specific drug classes. For a detailed treatment of matrix selection and application protocols, see our MALDI imaging workflow resource.
The principal limitation of MALDI for drug imaging is matrix interference in the low-mass range (m/z < 500), where most small-molecule drugs reside. Matrix cluster ions — particularly from CHCA (m/z 172, 190, 212, 335, 379) — can obscure drug signals. High-resolution mass analyzers (FTICR, Orbitrap) resolve these interferences at R > 100,000, but on lower-resolution TOF instruments, careful matrix selection and tandem MS (MS/MS) imaging are essential for unambiguous drug identification.
DESI-MSI — Ambient, No Matrix, Preserves Drug Distribution
Desorption electrospray ionization (DESI) operates at ambient pressure and requires zero sample preparation — no matrix, no vacuum, no conductivity coating. A charged solvent spray desorbs and ionizes molecules directly from the tissue surface, making DESI particularly attractive for drug imaging where matrix application could delocalize the compound of interest. Spatial resolution is typically 25-50 μm, sufficient for tissue-region-level drug mapping in kidney, liver, brain, and tumor sections.
The 2025 demonstration by Rahman et al. of DESI-MRM (multiple reaction monitoring) on a triple quadrupole instrument marked a significant advance for targeted drug quantification. Operating DESI mass spectrometry imaging in MRM mode — where Q1 selects the drug precursor ion, a collision cell fragments it, and Q3 selects a specific product ion — achieved R² = 0.9953 for chloroquine calibration in mouse kidney with RSD < 15%. The highest chloroquine concentrations localized to the kidney pelvis (~400-436 ng/mg tissue), consistent with renal elimination pathways — spatial detail that bulk LC-MS/MS of kidney homogenate would have averaged across the entire organ.
ToF-SIMS for Subcellular Drug Localization
Time-of-flight secondary ion mass spectrometry (ToF-SIMS) achieves 50 nm-1 μm spatial resolution — the only MSI platform capable of resolving drug distribution at the subcellular level. A focused ion beam (typically Bi₃⁺ or Arₙ⁺ clusters) sputters secondary ions from the tissue surface, which are analyzed by TOF. The trade-off is extreme surface sensitivity (top 1-2 nm of the sample) and a small field of view, making ToF-SIMS best suited for targeted, high-resolution questions: is the drug inside the nucleus or the cytoplasm? Does it co-localize with lysosomes?
The correlative Raman + ToF-SIMS workflow demonstrated by Tyagi et al. (JoVE, 2025) exemplifies the technique's role in drug visualization. Using ex vivo human skin treated with topical diclofenac, the team first acquired stimulated Raman scattering (SRS), second harmonic generation (SHG), and two-photon fluorescence (TPF) images of tissue morphology at sub-micron resolution, then performed ToF-SIMS on the same tissue section to map diclofenac distribution across the epidermis and dermis. Image co-registration revealed that diclofenac accumulated preferentially in the stratum corneum and epidermal viable layers, with limited penetration into the dermis — spatial detail that conventional Franz cell diffusion measurements cannot provide.
IR-MALDESI for Quantitative Drug Imaging Without Matrix
Infrared matrix-assisted laser desorption electrospray ionization (IR-MALDESI) is an emerging hybrid that combines the spatial sampling of laser ablation with the soft ionization of electrospray — and critically, it uses endogenous water as the "matrix." A 2.97 μm mid-IR laser resonantly excites O-H bonds in tissue water, ablating material into an electrospray plume for ionization. No chemical matrix is applied, eliminating matrix interference in the low-mass range entirely.
The Muddiman lab at NC State University has driven IR-MALDESI's advance toward absolute quantitative drug imaging. Their voxel-by-voxel (V×V) calibration method (Bruce et al., Anal Bioanal Chem, 2025) sprays a stable isotope-labeled internal standard uniformly onto a glass slide, mounts tissue on top, and calculates drug concentration at each pixel from the analyte-to-standard ratio — exploiting IR-MALDESI's complete tissue ablation at each voxel. Crucially, Joignant et al. (Anal Bioanal Chem, 2025) demonstrated that tissue heterogeneity does not bias IR-MALDESI quantification across diverse tissue types (gill, heart, liver), validating the platform for multi-organ drug distribution studies. The technique is now being applied to quantitative glutathione imaging in liver and glycosaminoglycan profiling in stroke brain via parallel reaction monitoring (PRM), with direct applicability to drug quantification.
Platform Selection by Drug Class — Small Molecule, Peptide, Antibody, ADC
Not all MSI platforms work equally well for all drug types. Small-molecule drugs (MW < 800 Da) with good ionization efficiency are well-served by MALDI and DESI, with DESI preferred for labile compounds that might degrade during matrix application. Peptide drugs (800-5,000 Da) require MALDI or IR-MALDESI; DESI sensitivity drops sharply above ~2,000 Da. Intact monoclonal antibodies (~150 kDa) exceed the mass range of most MSI platforms — spatial proteomics approaches using on-tissue digestion and peptide-level imaging are more practical, as detailed in our MS-based Spatial Proteomics service. Antibody-drug conjugates (ADCs) present a unique case: the intact ADC is too large for direct MSI, but the released free payload (a small molecule) can be imaged by MALDI-MSI, as demonstrated by Cai et al. (AAPS J, 2026), who mapped intratumoral free payload distribution from DAR4 vs. DAR8 ADCs and found that the permeable MMAF payload achieved pan-tumoral distribution regardless of the antibody's penetration depth — the bystander effect.
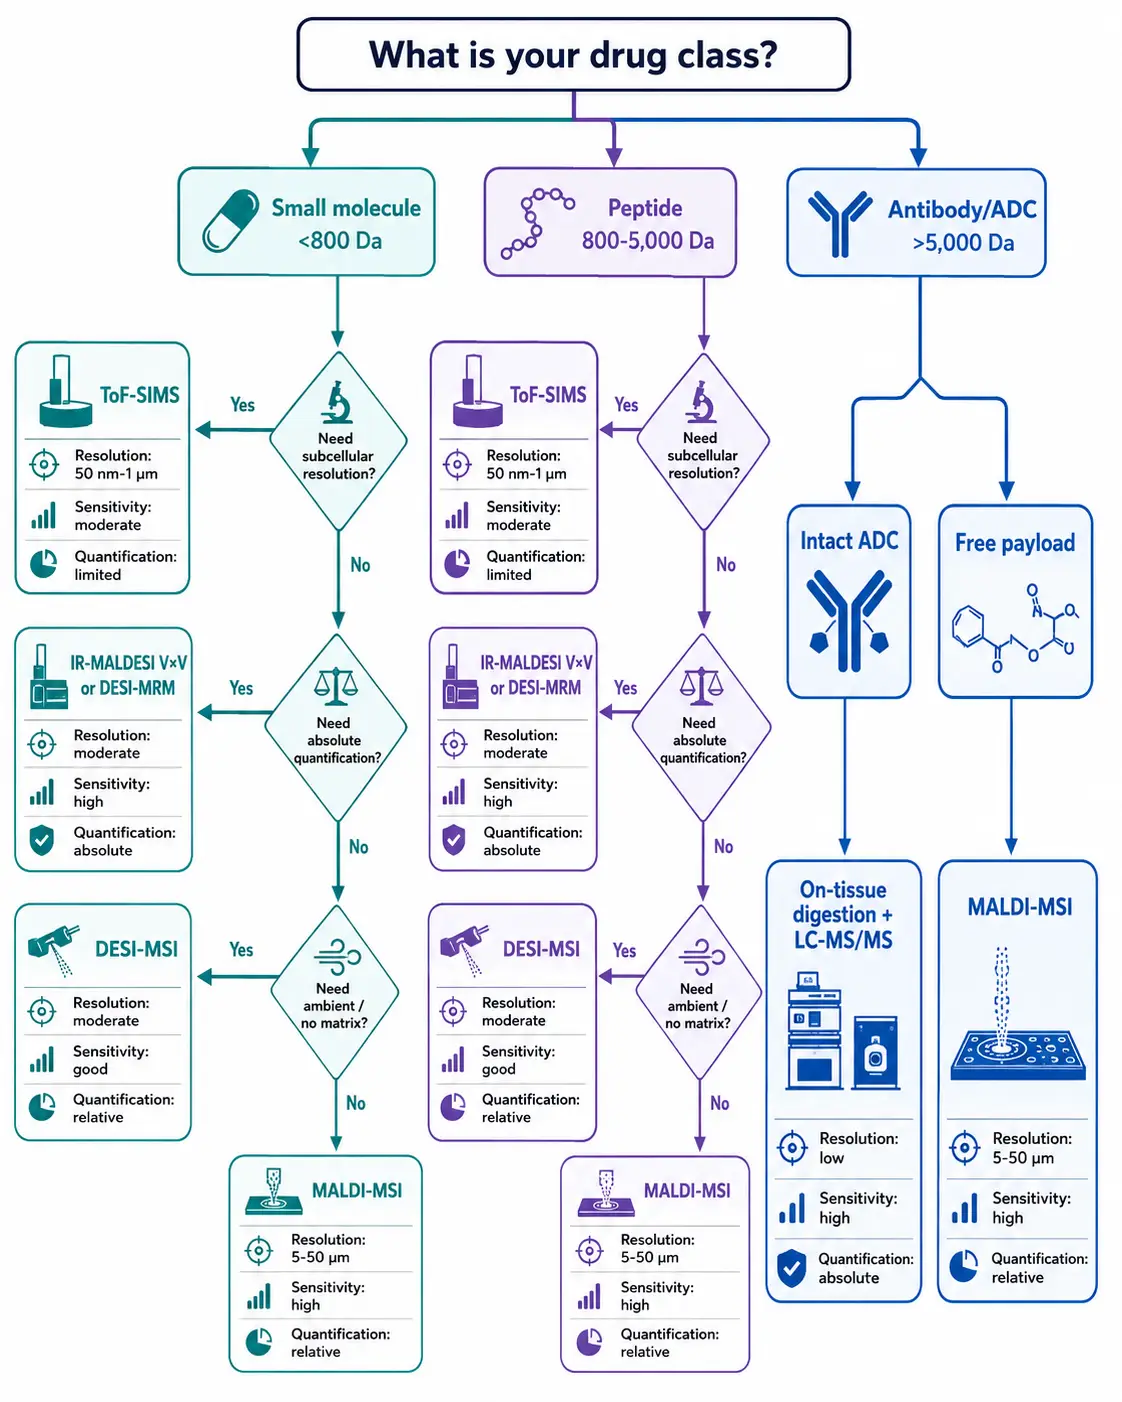 Figure 2: MSI Platform Decision Flowchart for Drug Imaging — Choose by Drug Class, Resolution Need, and Quantification Requirement. A branching decision tree that operationalizes MSI platform selection for drug imaging. The first branch separates by drug molecular weight: small-molecule drugs (MW < 800 Da) follow the left path, peptide drugs (800-5,000 Da) the center path, and ADCs/large molecules the right path. For the small-molecule path, secondary branches address: matrix interference risk (high → DESI or IR-MALDESI; low → MALDI), spatial resolution needs (subcellular → ToF-SIMS; 5-20 μm → MALDI; 25-50 μm → DESI), and quantification requirements (absolute → IR-MALDESI with V×V calibration or DESI-MRM; relative → standard MALDI or DESI). Each terminal node includes a practical note on matrix selection, sample preparation, and expected acquisition time. A summary callout at the bottom lists the four platforms with their resolution ranges, mass ranges, and quantification capabilities in a compact reference format.
Sample Preparation for Drug Imaging Studies
Fresh-Frozen vs. FFPE — Why FFPE Washes Out Most Small-Molecule Drugs
This is the most consequential sample preparation decision in drug imaging, and it is frequently gotten wrong. Formalin-fixed paraffin-embedded (FFPE) tissue — the standard pathology workflow — involves dehydration through graded ethanol, xylene clearing, and paraffin embedding at 60°C. Small-molecule drugs, which are not cross-linked by formalin, are progressively extracted during the solvent steps. By the time a FFPE block is sectioned, >90% of most small-molecule drugs have been washed out. Exceptions exist for drugs that covalently bind their target (e.g., irreversible kinase inhibitors) or are physically trapped in protein precipitates, but these are the minority.
Fresh-frozen tissue — snap-frozen in liquid nitrogen or isopentane-cooled dry ice immediately after harvest, then cryosectioned at -20°C — preserves drug distribution with minimal perturbation. The trade-off is tissue morphology: fresh-frozen sections show inferior histological detail compared to FFPE, complicating anatomical annotation. The pragmatic solution is to cut serial sections: one for MSI drug imaging (fresh-frozen), one for H&E staining and histological reference.
Timing Tissue Harvest to Drug Tmax; Vehicle Control Requirement
Drug concentration in tissue is time-dependent. Harvesting tissue at the drug's plasma Tmax (time of maximum plasma concentration) maximizes the probability of detecting the drug in target tissues, but for drugs with slow tissue penetration kinetics (many CNS drugs, some chemotherapeutics), tissue Tmax may lag plasma Tmax by hours. A pilot time-course experiment with 3-4 time points bracketing the expected Tmax range is strongly recommended before committing to a full MSI study.
Vehicle controls are mandatory. The drug formulation vehicle (e.g., DMSO, Cremophor EL, saline, PEG-400) can alter tissue morphology, ion suppression patterns, and endogenous metabolite profiles independently of the drug. Every MSI drug imaging study should include at least one vehicle-treated tissue section processed identically to the drug-treated sections, imaged under the same instrumental conditions.
Preventing Drug Delocalization During Sectioning
Drug delocalization during cryosectioning is a subtle but pervasive artifact. As the cryostat blade passes through the tissue at -20°C, a thin film of liquid water forms momentarily at the blade-tissue interface due to frictional heating — enough to dissolve and laterally smear highly water-soluble drugs across hundreds of micrometers. Mitigation strategies include: reducing cryostat chamber temperature to -25°C for highly soluble compounds, using a fresh blade for each block, and — where compatible with the drug's stability — briefly thaw-mounting the section onto a cold MALDI target plate rather than a room-temperature glass slide, minimizing the liquid water phase duration. For DESI and ToF-SIMS, which do not require matrix, the section can be analyzed immediately after cutting to further reduce diffusion.
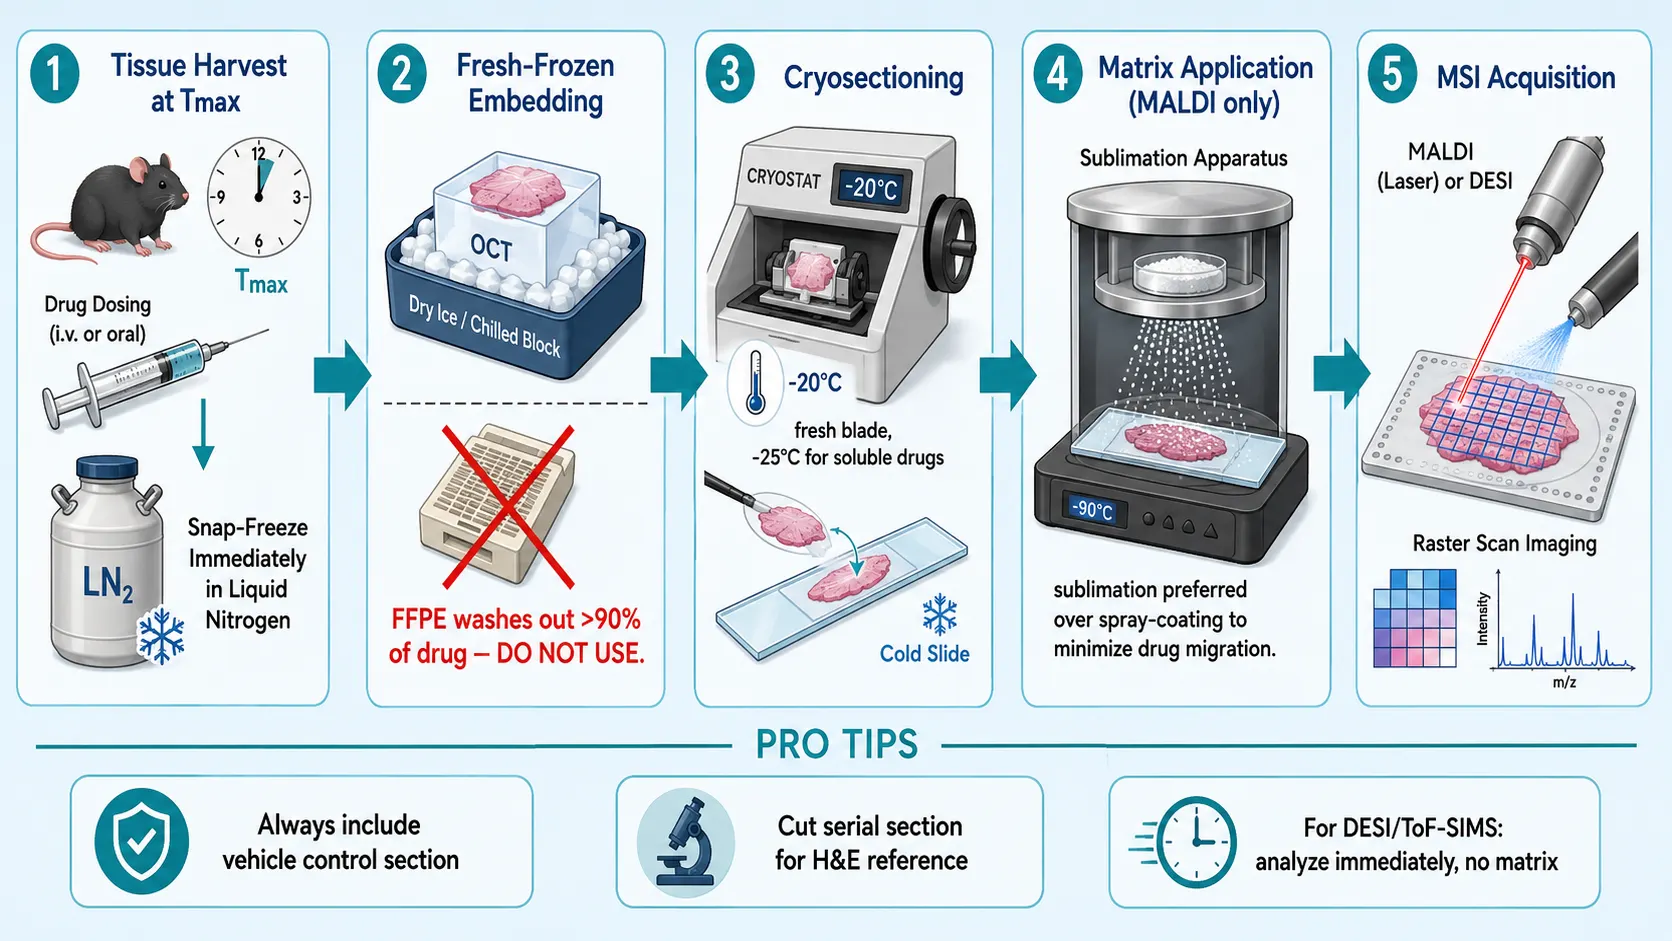 Figure 3: Sample Preparation Workflow for Drug Imaging — From Tissue Harvest to MSI-Ready Section. A six-stage vertical workflow diagram: (1) Dosing — syringe icon with annotation "Time tissue harvest to drug Tmax; confirm with pilot PK"; (2) Tissue Harvest — snap-freezing in liquid nitrogen within 30 seconds of excision, with a red X over a formalin jar labeled "FFPE: >90% small-molecule drug lost"; (3) Embedding — tissue orientation in OCT or CMC mounting medium; (4) Cryosectioning at -20°C to -25°C — illustration of a cryostat with callouts for ceramic blade (avoids metal smearing), section thickness (10-20 μm), and thaw-mounting; (5) Matrix Application — sublimation vs. spray-coating comparison for MALDI, with a "No matrix needed" bypass arrow for DESI and ToF-SIMS; (6) MSI-Ready Slide — the final section with an inset vehicle-control reminder. A bottom panel illustrates the serial-section strategy: one section for MSI drug imaging, one adjacent section for H&E reference histology.
Quantitative Drug Imaging
SIL Drug Standards and Mimetic Tissue Calibration
Moving from "where is the drug?" to "how much drug is at each pixel?" requires calibration standards that match the ionization environment of the drug in tissue. The gold standard is a stable isotope-labeled (SIL) analog of the drug itself — typically ²H, ¹³C, or ¹⁵N labeled — which has identical ionization efficiency and extraction behavior to the unlabeled drug. The SIL standard is spotted at known concentrations onto control tissue sections (or onto the same section adjacent to the tissue), and a calibration curve is constructed from the SIL-to-drug signal ratio.
When a SIL analog is unavailable (true for most discovery-stage compounds), mimetic tissue calibration offers an alternative — covered comprehensively in our quantitative MSI calibration guide — in which the unlabeled drug is spiked into a tissue homogenate at known concentrations, the spiked homogenate is frozen, cryosectioned at the same thickness as the sample, and calibration curves are constructed from the spiked sections. The mimetic approach accounts for tissue-specific ion suppression but requires independently prepared calibration sections for each drug.
DESI-MRM for Targeted Drug Quantification
The Rahman et al. (J Mass Spectrom, 2025) study established DESI-MRM as a practical platform for targeted drug quantification. By coupling DESI to a triple quadrupole mass spectrometer and monitoring specific MRM transitions, the method eliminates isobaric interferences that would confound full-scan DESI-MS. The MRM transition for chloroquine (m/z 320.2 → 247.1) and its deuterated internal standard (m/z 325.2 → 147.1) provided substantially higher selectivity than full-scan mode by eliminating isobaric interferences. The workflow is directly transferable to any drug with an established LC-MS/MS MRM method — the same transitions work for DESI imaging.
Multi-Drug and Metabolite Simultaneous Quantification
One of MSI's underutilized strengths is simultaneous multi-analyte imaging. A single DESI or MALDI acquisition captures the full mass spectrum at each pixel, meaning that parent drug, active metabolites, inactive metabolites, and endogenous biomarkers are all recorded simultaneously — provided their concentrations fall within the dynamic range. For drug development programs evaluating multiple backup compounds or studying metabolic pathways, this simultaneous detection capability eliminates the need for separate experiments per analyte. After acquisition, data can be re-mined for any ion present in the spectra, including metabolites that were not the original focus of the study.
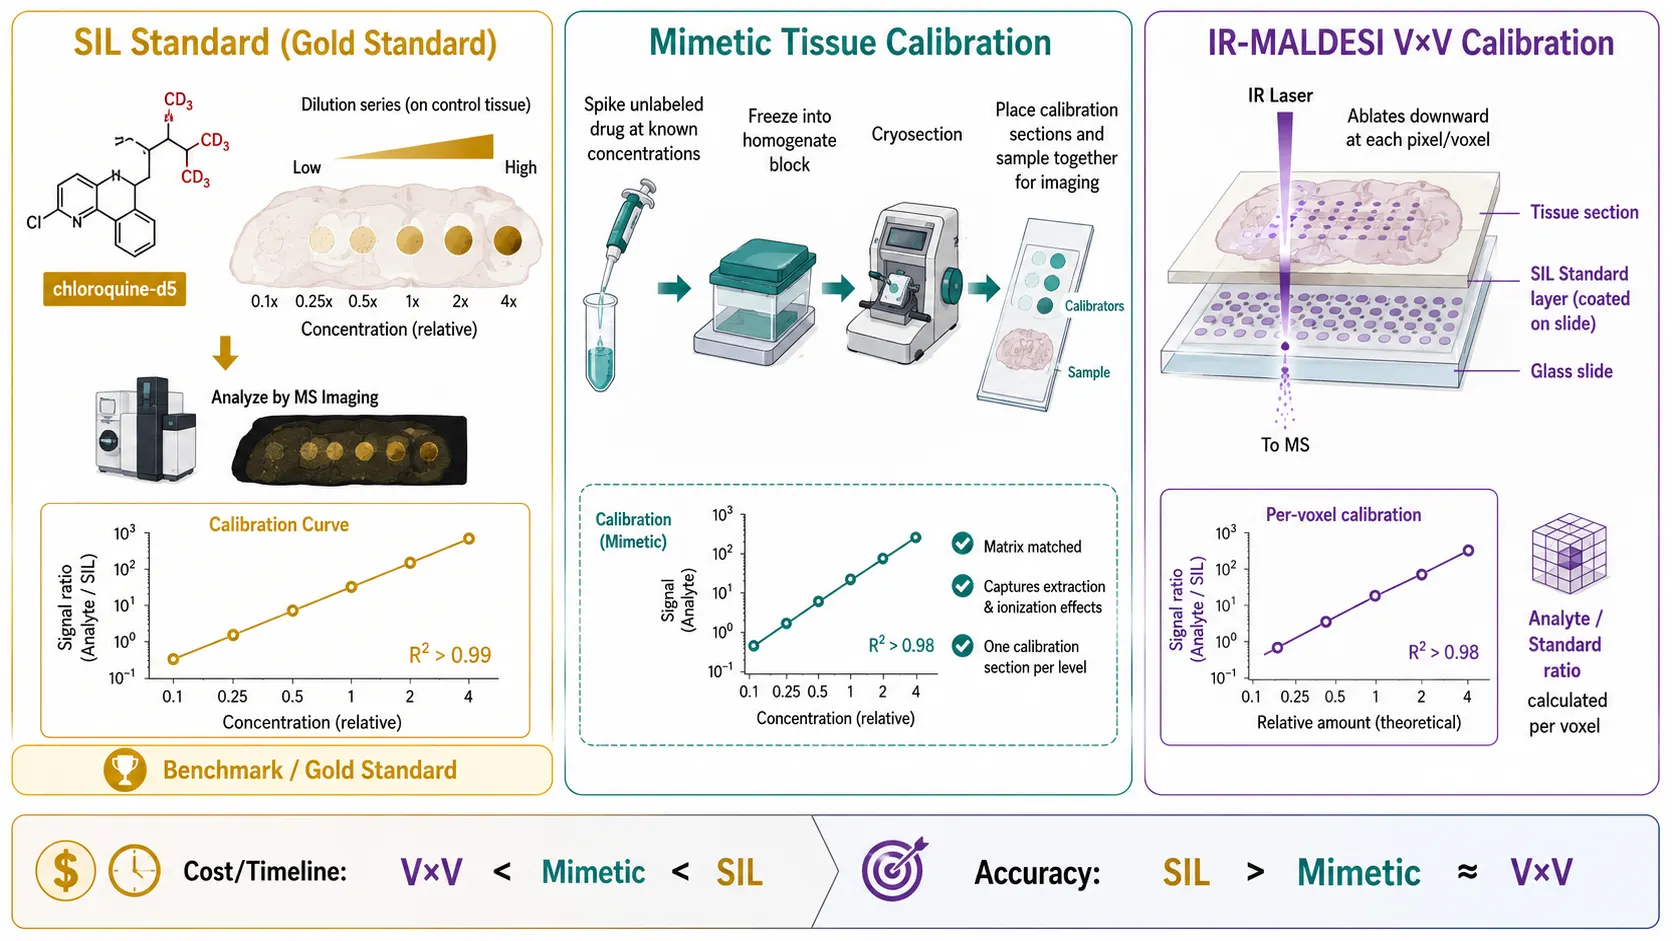 Figure 4: Quantitative Drug Imaging Calibration Workflow — SIL Standards, Mimetic Tissue, and V×V. A three-panel comparison of quantitative MSI calibration strategies for drug imaging: (left) SIL Drug Standard — a stable isotope-labeled drug analog (²H/¹³C/¹⁵N) is spotted at graded concentrations adjacent to the tissue section, producing a standard curve of SIL-to-drug signal ratio vs. concentration; (center) Mimetic Tissue Homogenate — unlabeled drug is spiked into control tissue homogenate at known concentrations, the spiked homogenate is frozen and cryosectioned, and calibration curves are constructed from the spiked sections that inherently account for tissue-specific ion suppression; (right) Voxel-by-Voxel (V×V) IR-MALDESI — a SIL internal standard is uniformly sprayed beneath the tissue on a glass slide, and the drug concentration at each pixel is calculated from the analyte-to-standard ratio, with complete tissue ablation ensuring every voxel is internally calibrated. Each panel displays the resulting calibration curve (signal ratio vs. concentration) with R² values and a representative quantitative ion image at the bottom.
Correlative Imaging for Drug Visualization
Raman/SHG/Fluorescence + MSI — The Tyagi 2025 Workflow
The Tyagi et al. (2025) correlative workflow represents the current state of the art in multi-modal drug visualization. On a single tissue section: (1) non-destructive optical microscopy (SRS, SHG, TPF) maps tissue morphology, collagen architecture, and autofluorescence at sub-micron resolution; (2) fiducial markers visible in both optical and mass spectrometric modalities are annotated for image registration; (3) ToF-SIMS or MALDI-MSI maps drug distribution on the same section; (4) computational co-registration overlays drug signal onto the high-resolution tissue morphology map. The result is a fused image showing exactly which cell types and tissue compartments the drug occupies — information unobtainable from either modality alone.
This workflow is not limited to ToF-SIMS. MALDI-MSI + H&E overlay on serial sections is routinely performed, and emerging work integrates DESI-MSI with immunofluorescence on the same section. The key enabling technology is image registration software that aligns multi-modal datasets using fiducial markers, tissue edges, or feature-based algorithms.
3D Drug Distribution Reconstruction from Serial Sections
Serial-section 3D MSI reconstructs volumetric drug distribution by imaging drug concentration across sequential tissue sections and computationally stacking the resulting 2D maps into a 3D volume. A comprehensive 2025 Analytical Chemistry review by Körber and Heeren covered the state of the art in 3D MSI, including topology-correlated imaging, serial-section co-registration, and depth-profiling alternatives via ion sputtering or laser ablation. A typical 3D MSI experiment images 30-50 serial sections at 50-100 μm z-spacing, producing data volumes of 100-500 GB.
The pharmaceutical value of 3D drug imaging lies in capturing anisotropic drug penetration — for example, tracking an anticancer drug's penetration gradient from the tumor periphery toward the necrotic core across the full z-depth of a xenograft, or mapping a CNS drug's distribution across multiple brain regions from olfactory bulb to brainstem in a single integrated dataset. Current limitations include the substantial acquisition time required for large tissue volumes and the computational complexity of aligning serial sections with non-identical tissue morphology.
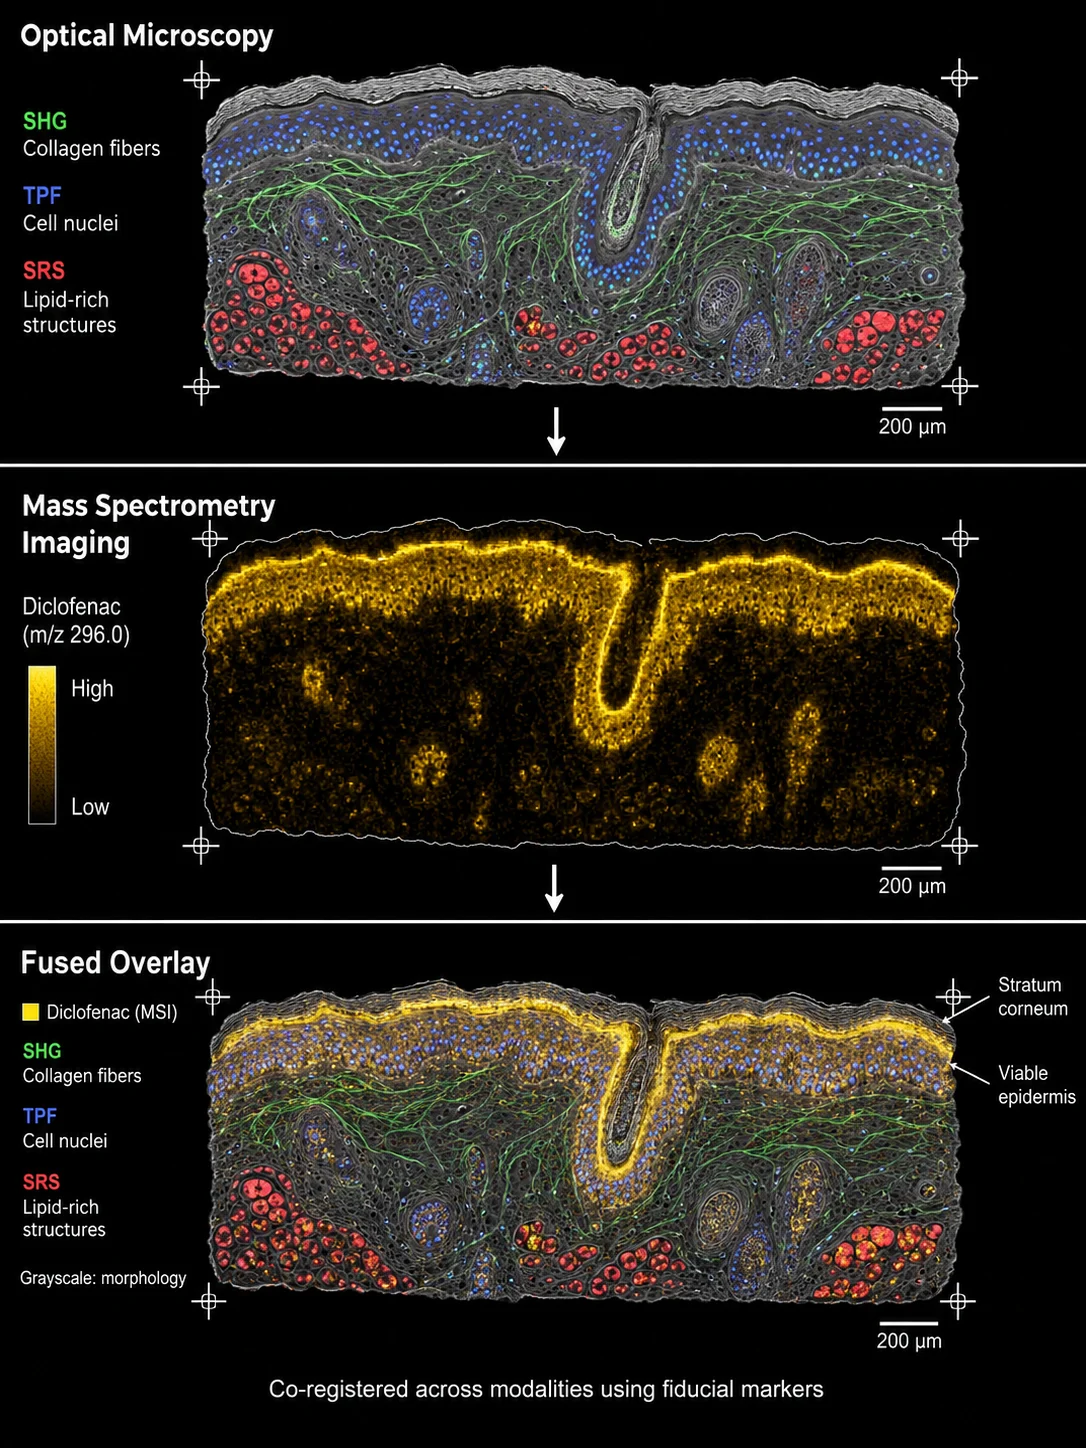 Figure 5: Correlative Imaging — Raman/SHG + MSI + H&E Overlay for Multi-Modal Drug Visualization. A horizontal workflow diagram of the Tyagi et al. (2025) correlative imaging pipeline: Stage 1 — Non-destructive optical imaging: stimulated Raman scattering (SRS) maps tissue morphology at sub-micron resolution, second harmonic generation (SHG) reveals collagen fiber architecture, and two-photon fluorescence (TPF) captures autofluorescence — all performed on the same tissue section without sample damage. Stage 2 — Fiducial markers visible in both optical and MS modalities are annotated for image co-registration. Stage 3 — ToF-SIMS or MALDI-MSI on the same section maps drug distribution (illustrated with a diclofenac ion image overlaid on human skin cross-section). Stage 4 — Computational co-registration fuses the optical morphology map with the MSI drug map, producing a final composite image showing drug localization (color scale) superimposed on high-resolution tissue architecture (grayscale). An inset shows the key finding from the Tyagi study: diclofenac accumulated preferentially in the stratum corneum and viable epidermis with limited dermal penetration.
Key Pharmaceutical Applications
Anticancer Drug Tumor Penetration
Poor tumor drug penetration is one of the most common causes of disappointing Phase II efficacy. MSI studies across multiple cancer models have consistently revealed that drug penetration in solid tumors is heterogeneous and often incomplete — paclitaxel and doxorubicin both show steep concentration gradients from blood vessels toward the tumor core, with drug-limited regions that correspond to the hypoxic and necrotic zones identified by histology. For irinotecan, MSI has further demonstrated that its active metabolite SN-38 distributes heterogeneously in colorectal tumors, likely due to regional differences in carboxylesterase expression. These spatial pharmacokinetic data directly inform dosing regimen design — for drugs with poor penetration, metronomic scheduling (frequent low doses) may achieve more uniform tumor exposure than maximum-tolerated-dose bolus administration.
CNS Drug Brain Microregion Distribution
The BBB does not simply block or admit a drug — it creates a complex spatial gradient of drug concentration across brain microregions. MSI has been used to map antidepressant distribution (fluoxetine, sertraline) across cortex, hippocampus, and striatum; to demonstrate that antipsychotics (risperidone, olanzapine) accumulate in specific white matter tracts; and to show that antiseizure medications (levetiracetam, lamotrigine) penetrate the hippocampus more effectively than the cerebellum. These findings, reviewed comprehensively by Zou et al. (Medicinal Research Reviews, 2025), underscore that BBB penetration is not binary — drugs cross at different rates into different brain regions, creating pharmacologically meaningful spatial gradients. For CNS drug development, MSI provides two essential data points that plasma and CSF sampling cannot: (1) whether the drug reaches the specific brain region implicated in the disease, and (2) whether off-target accumulation in other regions correlates with side-effect profiles.
ADC and Large-Molecule Imaging; Nanoparticle Carrier Biodistribution
The Cai et al. (AAPS J, 2026) ADC study exemplifies a paradigm shift: where IHC detected the antibody scaffold showing DAR4 ADCs penetrating tumors more deeply than DAR8, MALDI-MSI of the released free payload revealed identical spatial distributions — the permeable MMAF payload diffused uniformly through the tumor regardless of where the antibody deposited. This finding fundamentally reframes ADC design: for permeable payloads, the bystander effect dominates, and DAR optimization should prioritize payload release kinetics over antibody penetration. For nanoparticle drug carriers (liposomes, polymeric nanoparticles, iron oxide carriers), LA-ICP-MS or MALDI-MSI can track the elemental or molecular tag, respectively, across organs and over time.
Drug Metabolite Imaging — Distinguishing Parent from Metabolite
Drug metabolism produces spatial complexity that homogenization obliterates. A prodrug may be activated by CYP enzymes that are heterogeneously expressed across liver lobules (zone 3 > zone 1), meaning the active metabolite is generated in a specific spatial pattern that bulk LC-MS/MS averages across the whole organ. MSI simultaneously images parent drug and metabolite at each pixel, distinguishing m/z 320.2 (chloroquine) from m/z 292.2 (desethylchloroquine) by mass. For drugs with active metabolites — common in oncology (cyclophosphamide → 4-hydroxycyclophosphamide) and CNS (codeine → morphine via CYP2D6) — metabolite-specific imaging is essential for understanding which tissue regions actually experience pharmacologically active drug concentrations.
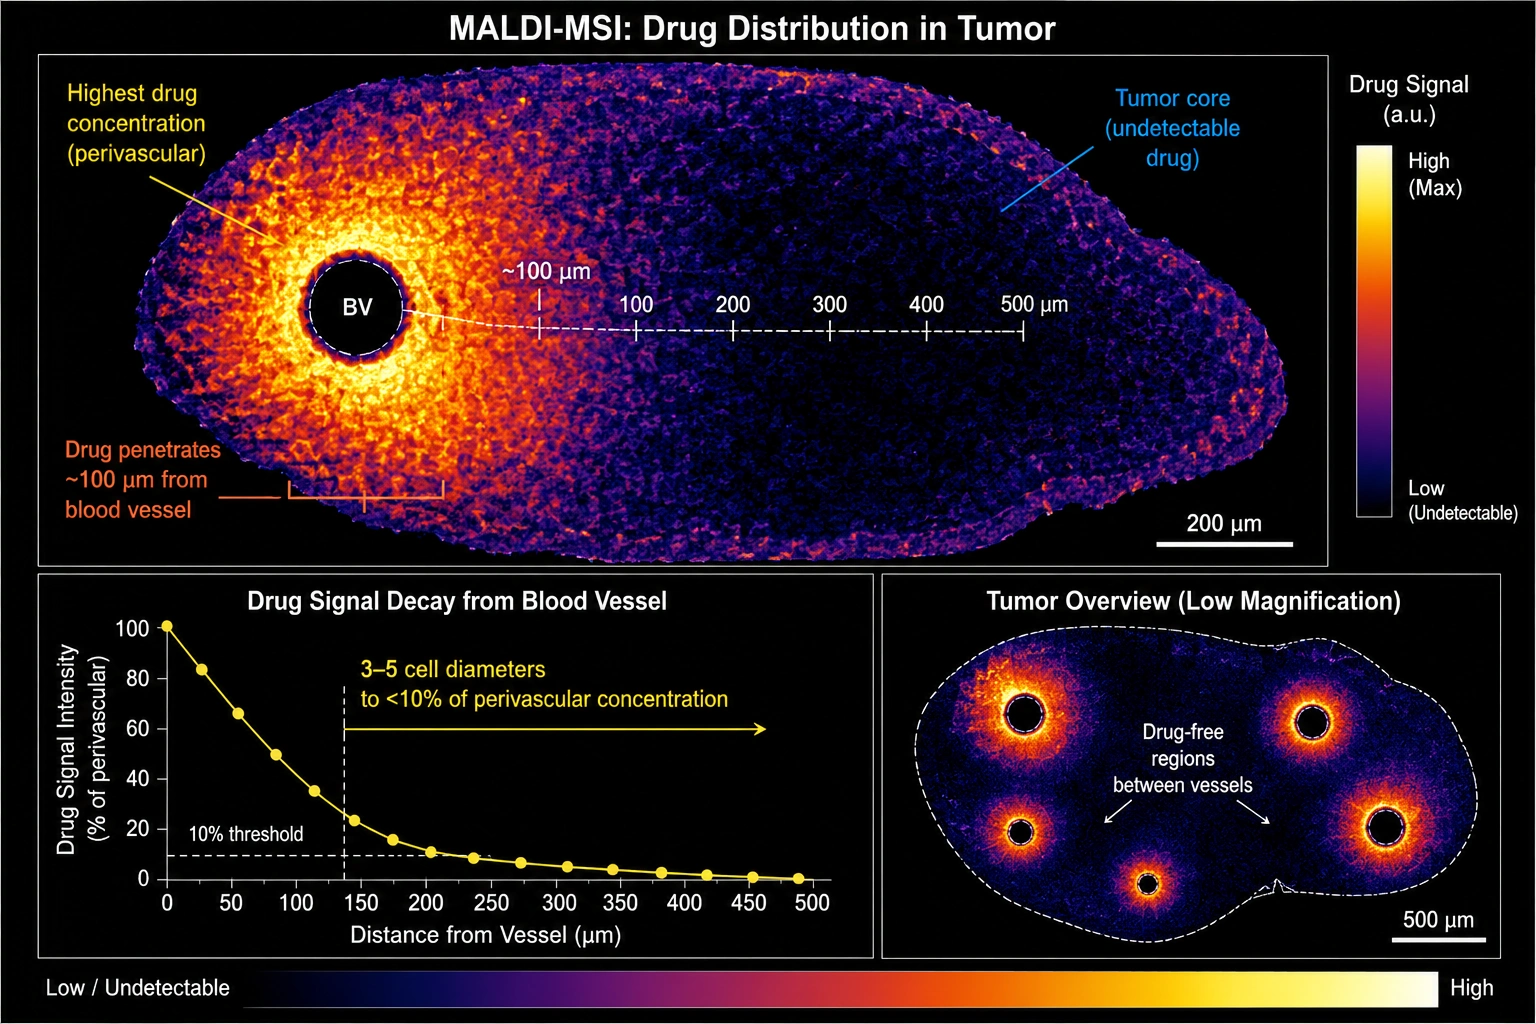 Figure 6: Anticancer Drug Tumor Penetration — MALDI Image of Drug Gradient from Vessel to Tumor Core. A representative MALDI-MSI ion image of an anticancer drug in a solid tumor xenograft section. The image shows a steep drug concentration gradient radiating outward from a central blood vessel (red, highest concentration, ~200 ng/mg) through intermediate zones (yellow-green, ~50-100 ng/mg) to the tumor periphery and necrotic core (blue,<10 ng/mg). An overlaid H&E mask delineates viable tumor regions, necrotic zones, and stromal tissue boundaries. Adjacent panels show: (left) the corresponding H&E-stained serial section with the blood vessel and necrotic core annotated; (right) a scatter plot of drug concentration vs. distance from the nearest blood vessel across all pixels in the image, with an exponential decay fit (R² = 0.91) showing the characteristic penetration half-distance of ~75 μm. The bottom callout summarizes the therapeutic implication: tumor cells beyond the penetration half-distance receive sub-therapeutic drug exposure despite adequate plasma concentrations.
Industry Adoption and Best Practices
Pharma Imaging MS Labs and CROs
The pharmaceutical industry has moved decisively toward in-house MSI capability. Genentech, AstraZeneca, GSK, and Novartis have all established dedicated imaging mass spectrometry laboratories, typically within DMPK or translational medicine groups. These labs support candidate selection (comparing drug penetration across backup compounds), formulation optimization (does nanoparticle encapsulation improve tumor delivery?), and toxicity investigation (is nephrotoxicity explained by drug accumulation in the proximal tubules?). For teams without in-house MSI capability, untargeted metabolomics of microdissected tissue regions offers an alternative route to spatially-resolved drug metabolism data, albeit at lower spatial resolution than direct MSI. On the CRO side, Aliri (formerly ImaBiotech, France) has emerged as a leading MSI service provider, operating GLP-compliant facilities in both Europe and North America and offering MALDI, DESI, and quantitative MSI under regulatory-grade quality systems, alongside several university-based cores that offer fee-for-service access.
Regulatory Considerations for MSI Data in Drug Development
MSI data is not yet required by any regulatory agency for IND or NDA submissions — but it is increasingly submitted as supplementary evidence. The IQ Consortium's 2026 cross-industry survey of 11 pharmaceutical companies (Tang et al., AAPS J, 2026) identified MSI as one of the most rapidly adopted advanced technologies in biodistribution assessment, alongside LC-MS/MS and ligand-binding assays. For regulatory submissions, key documentation requirements include: demonstration of method qualification (specificity, linearity, precision, and LOD in tissue), positive and negative control tissue sections, and justification of the spatial sampling scheme. As MSI matures from an academic technique to a regulated bioanalytical method, community-driven standardization initiatives are developing consensus on best practices for MSI data quality, reporting, and reproducibility.
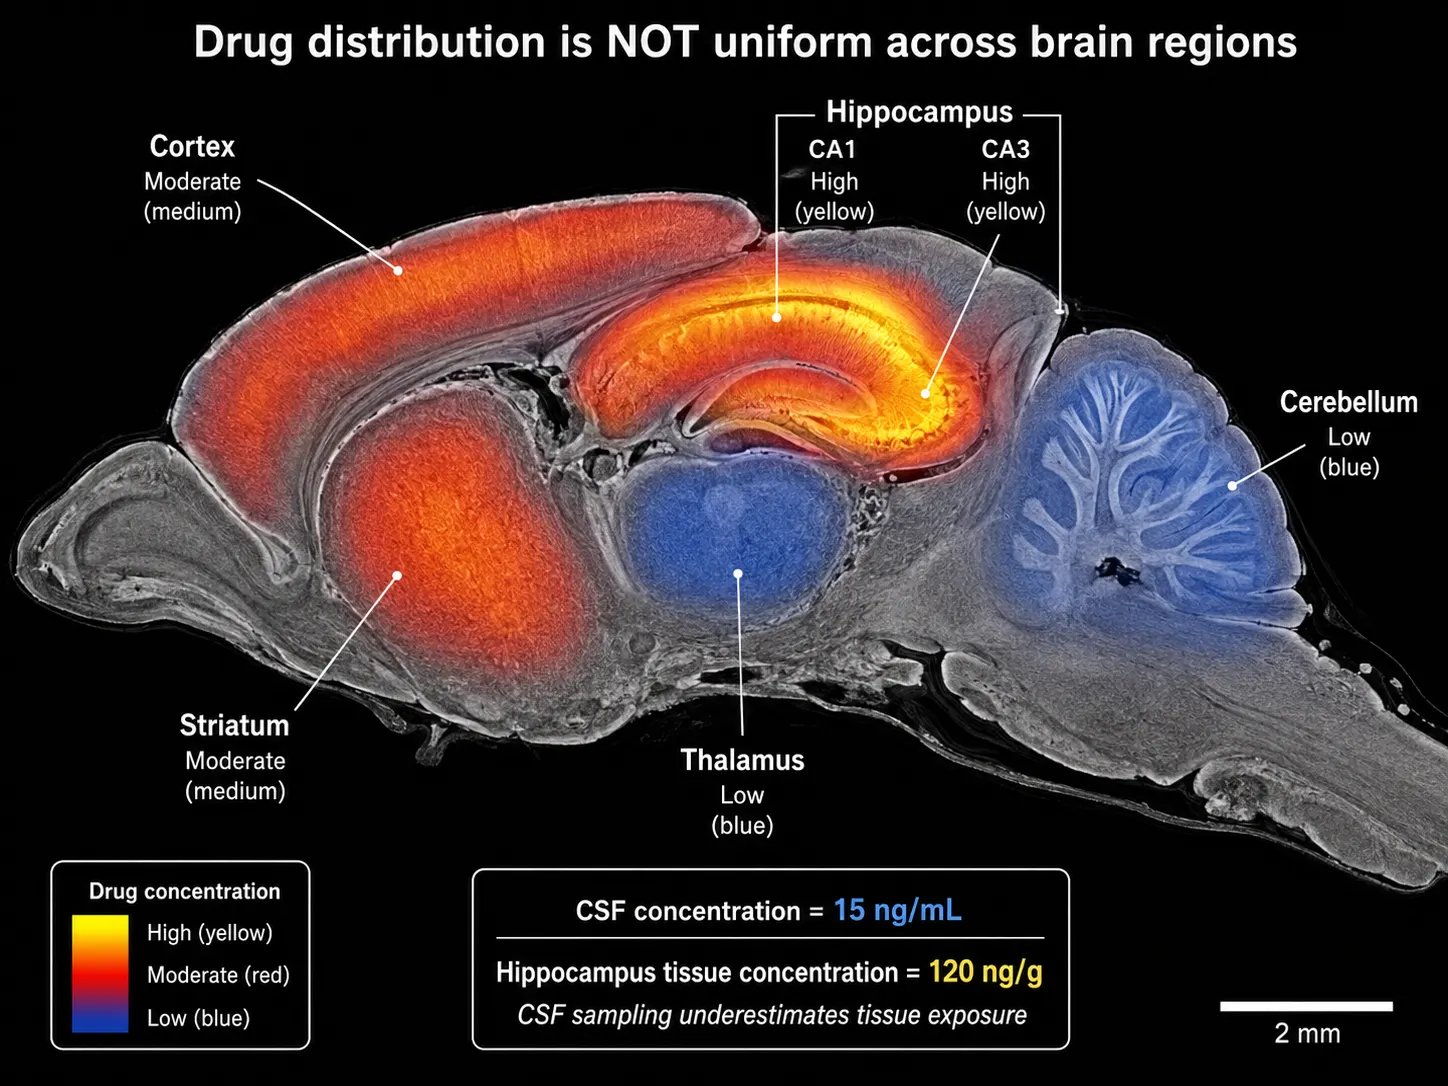 Figure 7: CNS Drug Brain Microregion Distribution — Sagittal Mouse Brain Section with Drug Overlay. A sagittal mouse brain section with a rainbow-scale drug distribution heatmap overlaid: red (highest) in the lateral ventricles and choroid plexus, yellow-green in the cortex and hippocampus, blue (lowest/absent) in the cerebellum. The coronal inset shows a magnified view of the hippocampus with drug signal resolved across the CA1, CA3, and dentate gyrus subfields — demonstrating that BBB penetration is not uniform even within a single anatomical structure. Anatomical labels (olfactory bulb, cortex, corpus callosum, hippocampus, thalamus, hypothalamus, cerebellum, brainstem) are overlaid in white text with leader lines. A sidebar panel shows the drug concentration bar chart across the seven annotated brain regions, with error bars representing inter-animal variability (n=3). A callout at the bottom right summarizes the key drug distribution parameters: brain-to-plasma ratio (Kp), unbound brain-to-plasma ratio (Kp,uu), and the ratio of drug concentration in the therapeutic target region vs. off-target regions — a metric that correlates with therapeutic index.
All spatial drug distribution and mass spectrometry imaging metabolomics services described in this article are provided for Research Use Only (RUO). These workflows are not intended for diagnostic, therapeutic, or clinical decision-making purposes.
FAQ
Q: Can mass spectrometry imaging replace LC-MS/MS for tissue drug quantification?
A: Not entirely — the two techniques are complementary. LC-MS/MS of tissue homogenates provides the highest quantitative accuracy (gold standard for absolute concentration), while MSI provides spatial distribution. The emerging best practice is to use LC-MS/MS for absolute quantification of drug in bulk tissue and MSI for spatial context — for example, LC-MS/MS confirms 50 ng/g in the kidney, and MSI reveals whether that 50 ng/g is uniform or concentrated 10× in the pelvis. For formal PK studies, LC-MS/MS remains the reference method; for understanding why a drug works or fails, MSI is indispensable.
Q: Which MSI platform should I use for a small-molecule drug with MW < 500 Da?
A: Start with MALDI-MSI if you need the best spatial resolution (5-20 μm) and sensitivity, and your drug ionizes well in positive or negative mode with standard matrices. Start with DESI-MSI if your drug is labile (degrades during matrix application), if you need to preserve the tissue for subsequent H&E or IHC staining, or if you require a simpler workflow with no vacuum requirement. If your drug signal falls in the MALDI matrix interference region (m/z < 500), consider IR-MALDESI (no matrix) or high-resolution MALDI (FTICR/Orbitrap). For subcellular localization questions, ToF-SIMS is the only option below 1 μm resolution.
Q: How do I prevent drug delocalization during sample preparation?
A: Four practical steps: (1) Use fresh-frozen tissue, never FFPE — the solvent steps in FFPE processing extract >90% of most small-molecule drugs. (2) Snap-freeze tissue immediately after harvest in liquid nitrogen or isopentane/dry ice; avoid slow freezing, which causes ice crystal formation and tissue damage. (3) Cryosection at -20°C to -25°C with a fresh, clean blade; reduce chamber temperature further for highly water-soluble drugs. (4) For MALDI, apply matrix by sublimation rather than spray-coating where possible — sublimation deposits dry matrix crystals without the solvent exposure of wet spray methods, minimizing drug migration during the matrix application step.
Q: Can MSI distinguish a drug from its metabolite in the same tissue section?
A: Yes — this is one of MSI's key advantages over autoradiography. The mass analyzer distinguishes ions by m/z: chloroquine (m/z 320.2) is separated from desethylchloroquine (m/z 292.2), and paclitaxel (m/z 854.3) is separated from 6α-hydroxypaclitaxel (m/z 870.3). Tandem MS (MS/MS) imaging adds an additional layer of specificity — the MRM transition for the parent drug confirms its identity independently of the metabolite MRM transition. For comprehensive drug metabolism studies, untargeted metabolomics can complement MSI by identifying unexpected metabolites that can then be targeted by MSI in follow-up studies.
Q: How long does a typical MSI drug distribution study take, from tissue harvest to data delivery?
A: Timeline depends on study complexity. A single-compound, single-time-point study on 3-5 tissues with MALDI-MSI typically takes 2-4 weeks: 1-2 days for dosing and tissue harvest, 1 day for cryosectioning, 1-2 days for matrix application and MSI acquisition, and 1-2 weeks for data processing, quantification, and image generation. Studies involving multiple time points, multiple drug candidates, 3D reconstruction from serial sections, or correlative multi-modal imaging (MSI + IHC + histology) can extend to 2-3 months. The rate-limiting step is typically data processing rather than acquisition — a single tissue section can be imaged in 2-6 hours, but extracting quantitative drug concentrations at each pixel and co-registering with histology requires substantial computational time.
Q: What is the minimum tissue concentration required for MSI drug detection?
A: The practical limit of detection depends on the drug's ionization efficiency, the mass analyzer, and the spatial resolution. As a rough guide, well-ionizing drugs (e.g., basic amines) can be detected by MALDI-MSI at concentrations in the hundreds of ng/g range at typical imaging resolutions (20-50 μm). As spatial resolution increases to single-cell dimensions (~5 μm), the amount of material per pixel decreases proportionally, and detection limits rise — typically to the low μg/g range for the same drug. Poorly ionizing drugs (neutral lipids, certain steroids) may not be detectable by MALDI at all without derivatization. DESI is generally less sensitive than MALDI for the same drug class. If your drug is below the MSI detection limit, consider targeted metabolomics by LC-MS/MS to quantify the drug in microdissected tissue regions, sacrificing spatial resolution for sensitivity.
References:
- Tyagi V, Dexter A, Vorng JL, et al. Correlative optical spectroscopy and mass spectrometry imaging methodology to visualise drug distribution in a soft tissue section. Journal of Visualized Experiments. 2025;(220):e67383. doi:10.3791/67383
- Rahman MM, Afroz MS, Al Mamun M, et al. Quantitative mass spectrometry imaging by targeted-DESI-MSI in MRM mode provides higher sensitivity and specificity for fast quantification of chloroquine drug in mice kidney. Journal of Mass Spectrometry. 2025;60(7):e5148. doi:10.1002/jms.5148
- Bruce KE, Xie MB, Manni JG, Muddiman DC. Demonstrating voxel-by-voxel (V×V) single-point calibration in liver tissue by IR-MALDESI quantitative mass spectrometry imaging. Analytical and Bioanalytical Chemistry. 2025;417:6463-6473. doi:10.1007/s00216-025-06138-x
- Cai Y, Wu Y, et al. Spatiotemporal profiling of intratumoral free payload distribution via MALDI imaging mass spectrometry: implications for drug-to-antibody ratio optimization in antibody-drug conjugates. The AAPS Journal. 2026. doi:10.1208/s12248-026-01235-w
- Joignant AN, Hector EC, Barnes MM, Kullman SW, Muddiman DC. Quantitative sampling by IR-MALDESI is not susceptible to tissue heterogeneity in a multi-organ model. Analytical and Bioanalytical Chemistry. 2025;417(1):83-93. doi:10.1007/s00216-024-05653-7
- Zou Y, Yan Z, Tang W, Li B. Insights from spatiality: accelerating pharmaceutical research using mass spectrometry imaging. Medicinal Research Reviews. 2025. doi:10.1002/med.70061
- Körber A, Anthony IGM, Heeren RMA. Mass spectrometry imaging. Analytical Chemistry. 2025;97:15517-15549. doi:10.1021/acs.analchem.4c05249
- Doble PA, et al. Laser ablation-inductively coupled plasma-mass spectrometry imaging in biology. Chemical Reviews. 2021;121:11769-11822. doi:10.1021/acs.chemrev.0c01219
- Tang H, McCoy M, Leonard A, et al. Industry practices in monoclonal antibody tissue biodistribution assessment: an IQ Consortium cross-industry survey of current approaches and emerging trends. The AAPS Journal. 2026;28(3). doi:10.1208/s12248-026-01209-y
- Ashbacher SM, Xie DY, Manni JG, Muddiman DC. Three-dimensional (3D) topographic mass spectrometry imaging of Artemisia annua by UV-MALDESI. Journal of the American Society for Mass Spectrometry. 2026;37(1):116-125. doi:10.1021/jasms.5c00224
- Schueler J, Heckscher S, Groß V, et al. In situ analysis of drug and metabolite distribution in a three-dimensional in vivo cyst model of ADPKD using DESI-MS. Journal of the American Society of Nephrology. 2025;36(10S). doi:10.1681/ASN.20254vqw8nt7














