

Beyond Plasma PK — Why Tissue-Level PK/PD Matters
The PK/PD Disconnect: Plasma Concentration Does Not Equal Tissue Effect
Pharmacokinetic-pharmacodynamic (PK/PD) modeling has been a cornerstone of drug development for decades, yet it rests on a fragile assumption: that drug concentration in plasma predicts drug concentration and effect at the target tissue. This assumption fails routinely. Tumor tissue may receive a fraction of the plasma drug exposure due to poor perfusion, high interstitial pressure, and heterogeneous vascular permeability. The blood-brain barrier limits CNS penetration independently of plasma AUC. Renal cysts in polycystic kidney disease create diffusion barriers that plasma sampling cannot reveal. In each case, plasma PK is a surrogate at best — and a misleading one at worst — for the tissue drug concentrations that actually determine efficacy and toxicity.
Spatial Heterogeneity in Drug Response: Why Some Regions Do Not Respond
Even when a drug reaches its target tissue, response is rarely uniform. In solid tumors, regions near functional blood vessels may show strong pharmacodynamic (PD) effects — apoptosis, metabolic pathway suppression, target engagement — while regions only a few hundred microns away, in the hypoxic or necrotic core, show none. This spatial heterogeneity is not captured by bulk tissue homogenate analysis, which averages drug concentration and metabolite abundance across all tissue compartments — a limitation discussed in our spatial metabolomics guide. The result is a distorted picture: a drug that achieves adequate average tissue exposure may still fail in the clinic because critical subregions are pharmacologically unprotected.
MSI as the Missing Link Between Drug Concentration and PD Effect
Mass spectrometry imaging (MSI) fills this gap by mapping both drug distribution and endogenous metabolite changes on the same tissue section or matched serial sections, preserving spatial context at 10-100 μm resolution. A single MSI experiment can simultaneously detect the parent drug and its metabolites alongside thousands of endogenous small molecules — lipids, TCA cycle intermediates, amino acids, nucleotides — that serve as spatially resolved PD biomarkers. This capability, termed in situ PK/PD analysis, transforms drug distribution from a single homogenate concentration into a spatially explicit map of exposure and response.
The Three-Module In Situ PK/PD Workflow [CORE DIFFERENTIATOR]
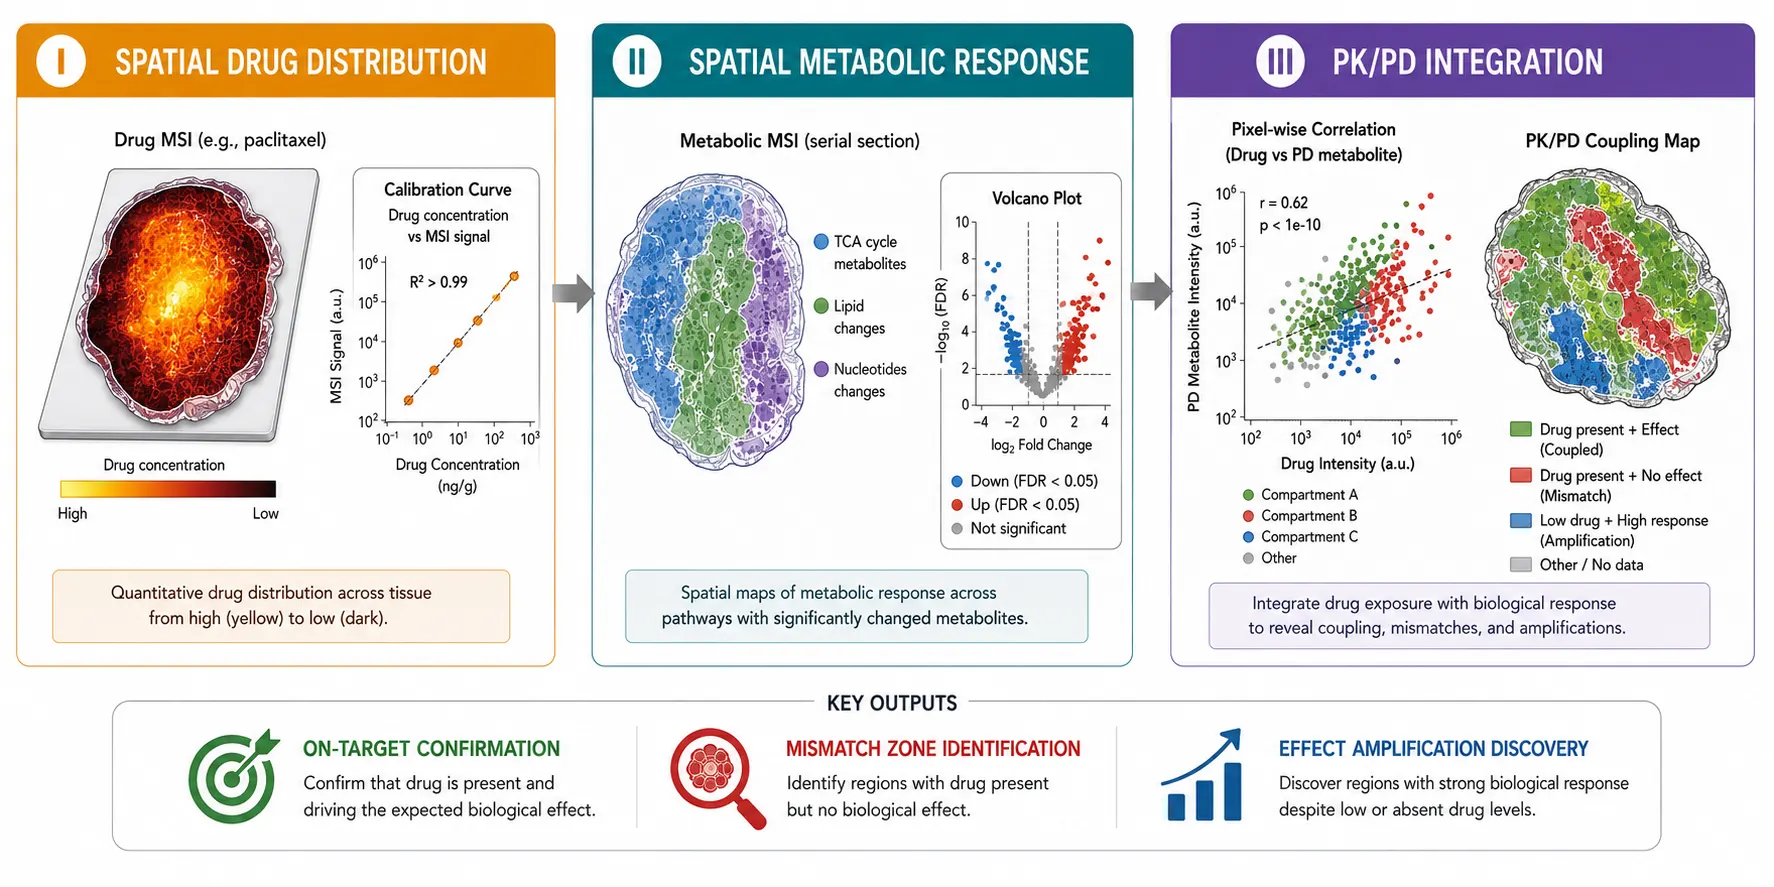 Figure 1: The Three-Module In Situ PK/PD Workflow — From Tissue Section to Spatial PK/PD Map. A horizontal three-module pipeline rendered as a modern scientific infographic on a clean white background. Module I (left panel, blue accent): Spatial Drug Distribution — a tissue section on a slide with a drug concentration heatmap overlay (red=high, blue=low), connected to a mass spectrum showing the drug peak (m/z 320.2) and its metabolite peak (m/z 292.2), with a mimetic tissue calibration block (spiked homogenate cryosectioned at matching thickness) shown as the quantification reference. Module II (center panel, teal accent): Spatial Metabolic Response — the same tissue section now with an endogenous metabolite heatmap overlay showing drug-induced changes (e.g., TCA cycle intermediates, phospholipids), connected to a PCA scores plot showing separation between drug-treated and vehicle control groups with QC samples clustering tightly. Module III (right panel, amber accent): PK/PD Integration — a pixel-wise scatter plot of drug intensity vs. PD biomarker intensity colored by anatomical zone (tumor periphery, intermediate, core) with Pearson r annotation, and a final composite image showing three color-coded zones overlaid on tissue: green (PK/PD coupling), red (PK/PD mismatch), and blue (effect amplification). Arrows connect the modules left-to-right with annotations: "Serial section 1," "Serial section 2," "Spatial co-registration."
Module I: Spatial Drug Distribution — Parent Drug and Metabolites in Tissue
Module I maps the quantitative distribution of the parent drug and its major metabolites across a tissue section using MSI. Depending on the drug class and required sensitivity, the platform may be MALDI-MSI (broadest metabolite coverage, highest spatial resolution), DESI-MSI (ambient, no matrix, preserves labile drug species), or nano-DESI-MS (targeted quantification on a triple quadrupole mass spectrometer in MRM mode; Moore et al., 2024). Absolute quantification is achieved through mimetic tissue calibration — covered in depth in our quantitative mass spectrometry imaging guide — drug standards spiked into tissue homogenate at known concentrations, frozen, cryosectioned, and imaged alongside study samples — or through isotope-labeled internal standards applied as a uniform coating (Kibbe & Muddiman, 2024). The output is a false-color ion image showing drug concentration across anatomical compartments, with detection limits in the low μg/g tissue range for most small-molecule drugs.
Module II: Spatial Metabolomics — Drug-Induced Metabolic Pathway Changes
Module II uses untargeted metabolomics — spatially resolved on a serial tissue section — to profile drug-induced changes in the endogenous metabolome. The approach parallels conventional untargeted metabolomics in its discovery scope, but preserves the tissue coordinates needed for PK/PD correlation. Where specific pathway hypotheses exist, targeted metabolomics can provide higher sensitivity and throughput for quantifying predetermined PD biomarkers. The same MALDI or DESI platform that mapped the drug now maps thousands of endogenous m/z features — lipids, energy metabolites, amino acids, nucleotides — across the same tissue regions. By comparing drug-treated tissue against vehicle control tissue imaged under identical conditions, metabolite features that increase or decrease in response to drug exposure are identified as candidate PD biomarkers. This approach has been demonstrated in multiple therapeutic contexts: losartan reduced fumarate and malate (TCA cycle intermediates) in diabetic kidney disease tissue, identifying mitochondrial metabolic remodeling as a PD mechanism (Hejazi et al., ASN 2024); and valsartan produced region-specific metabolic normalization in heart failure tissue, with stronger effects in infarct zones than non-infarct zones (Xu et al., 2025).
Module III: PK/PD Integration — Pixel-Wise Drug Concentration vs. PD Response Correlation
Module III is the analytical integration step. Drug ion intensity at each pixel (Module I) is correlated with PD biomarker ion intensity at the corresponding pixel or ROI (Module II), producing a spatially resolved PK/PD relationship. Three patterns emerge from this analysis. First, expected PK/PD coupling: regions with high drug concentration show strong PD response, confirming on-target pharmacology. Second, PK/PD mismatch — drug present, no effect: drug accumulates in a tissue compartment but the PD biomarker does not change, suggesting target absence, resistance, or drug sequestration in a pharmacologically inactive form. Third, effect amplification — low drug, high response: PD biomarkers shift strongly in regions with modest drug exposure, indicating downstream signal amplification, bystander effects, or paracrine signaling. Each pattern carries distinct implications for dose selection, combination strategy, and target validation.
Module I — Spatial Drug Distribution for PK
Platform Selection by Drug Class
MALDI-MSI is the preferred platform for most small-molecule drugs (<800 Da) due to its broad metabolite coverage, 10-50 μm spatial resolution, and compatibility with quantitative calibration workflows — as detailed in our MALDI imaging workflow resource covering matrix selection, instrument parameters, and data analysis pipelines. DESI-MSI is preferred when the drug is labile or matrix-sensitive — as detailed in our DESI mass spectrometry imaging guide — since DESI operates at ambient pressure with no matrix application, eliminating the delocalization and ion suppression risks that can affect certain compound classes during MALDI sample preparation. Nano-DESI-MRM on a triple quadrupole provides the highest quantitative precision for targeted drug quantification, with Moore et al. (2024) reporting lower standard deviations and superior limits of detection compared to AP-MALDI for erythromycin, sulfamethazine, and cyclosporin A in mimetic tissue.
Quantitative Requirements: Calibration, LOQ, and Dynamic Range
Quantitative MSI requires a calibration curve spanning the expected tissue concentration range, constructed from drug standards in a matrix-matched environment. The mimetic tissue model — drug-free tissue homogenate spiked with known drug concentrations, frozen in a mold, and cryosectioned — accounts for tissue-specific ion suppression (Holbrook et al., 2024). Lower limits of quantification (LLOQ) in the low μg/g range are achievable for most small-molecule drugs on modern Q-TOF and Orbitrap instruments; QqQ-MRM instruments push sensitivity further. Dynamic ranges of two to three orders of magnitude are typical, sufficient to capture the concentration differences between drug-exposed and drug-sparse tissue regions.
Time-Point Selection: Capturing Tmax and Elimination Phases
Tissue harvest timing relative to the drug's plasma Tmax is the single most consequential design decision in an in situ PK/PD study. Harvesting at Tmax captures peak tissue exposure and is appropriate for mapping maximum drug distribution and initial PD response. Harvesting at a late elimination time point (e.g., 4× plasma half-life) reveals whether PD effects persist after drug clearance — a critical question for understanding duration of action and dosing interval justification. A minimum of two time points (Tmax and one late time point) is recommended for any PK/PD study; three or more time points enable construction of a spatially resolved tissue PK curve.
Module II — Spatial Metabolic Response Profiling
Untargeted Spatial Metabolomics for PD Biomarker Discovery
Untargeted spatial metabolomics — acquiring full-scan mass spectra across a tissue section and performing peak picking, alignment, and annotation — is the primary approach for discovering novel PD biomarkers. Thousands of m/z features are detected per section, of which several hundred are typically annotated against metabolite databases (METASPACE, HMDB, CoreMetabolome). By comparing drug-treated and vehicle control tissues from the same time point, differentially abundant features are identified through univariate testing (t-test per m/z, FDR-corrected) or multivariate methods (PCA, OPLS-DA). Features that are significantly altered by drug treatment and map to the same anatomical compartments where the drug localizes are prioritized as candidate PD biomarkers. For lipid-rich tissues such as brain and kidney, MALDI-Imaging Lipidomics is particularly informative, as drug-induced changes in phospholipid and sphingolipid metabolism often serve as sensitive early indicators of pharmacodynamic response. Downstream, Bioinformatics for Metabolomics support — including pathway enrichment and network analysis — is essential for translating a list of differentially abundant m/z features into a coherent biological narrative of drug action.
Targeted Panels and Distinguishing Drug from Biology
When the drug's mechanism of action is well-characterized, a targeted panel of pathway metabolites can be monitored instead of (or in addition to) untargeted profiling. For example, a mitochondrial complex I inhibitor would be expected to alter NAD+/NADH ratio, TCA cycle intermediates, and glycolysis endpoints; these specific metabolite classes can be targeted for quantification with higher sensitivity and throughput than untargeted discovery. A critical analytical consideration is distinguishing drug-derived signals from endogenous biological signals: the drug itself, its metabolites, and matrix adducts appear in the same m/z space as endogenous metabolites. Vehicle control tissue sections — tissue from animals receiving the drug vehicle (formulation without active drug) under identical treatment and harvest conditions — are essential for establishing the baseline metabolic state against which drug-induced changes are measured.
Vehicle Control Tissue: The Essential Baseline
Vehicle control tissue sections must be prepared, stored, sectioned, and imaged under identical conditions to drug-treated tissue, ideally on the same slide to eliminate slide-to-slide batch effects. Without an appropriate vehicle control, it is impossible to distinguish drug-induced metabolic changes from handling artifacts, dietary effects, or circadian metabolic fluctuations.
Module III — PK/PD Correlation Analysis
Pixel-Wise Correlation and Mismatch Zone Identification
The core analytical output of in situ PK/PD is the pixel-wise or ROI-wise correlation between drug ion intensity and PD biomarker ion intensity. For each annotated m/z feature in the PD dataset, a Pearson or Spearman correlation coefficient is calculated against the drug ion intensity at the corresponding spatial location. Features with strong positive correlation (drug present → PD marker high) suggest on-target pharmacology. Features with no correlation despite drug presence identify PK/PD mismatch zones — tissue compartments where the drug reaches therapeutic concentrations but fails to elicit the expected biological response. These zones may indicate intrinsic resistance, target downregulation, or drug sequestration (e.g., lysosomal trapping of cationic amphiphilic drugs without cytoplasmic target engagement).
Identifying Effect Amplification Zones
The inverse pattern — low drug, high response — is equally informative. It may reflect a low-abundance but highly potent active metabolite driving the PD effect (rather than the parent drug being imaged), paracrine signaling from drug-exposed cells to neighboring unexposed cells, or immune cell-mediated bystander killing in oncology. Identifying these zones can redirect medicinal chemistry efforts toward the true pharmacologically active species.
Visualization Approaches
PK/PD spatial data are visualized through several complementary formats: (a) dual-channel ion image overlays, with drug in one color channel and a key PD metabolite in another, overlaid on a tissue micrograph; (b) scatter plots of drug intensity vs. PD metabolite intensity, with each point colored by its anatomical compartment of origin; (c) PK/PD ratio maps, where the ratio of drug signal to PD response is displayed pixel-by-pixel, highlighting mismatch zones in a divergent color scale; and (d) spatial correlation heatmaps showing the local Pearson r between drug and PD feature abundance within a sliding window.
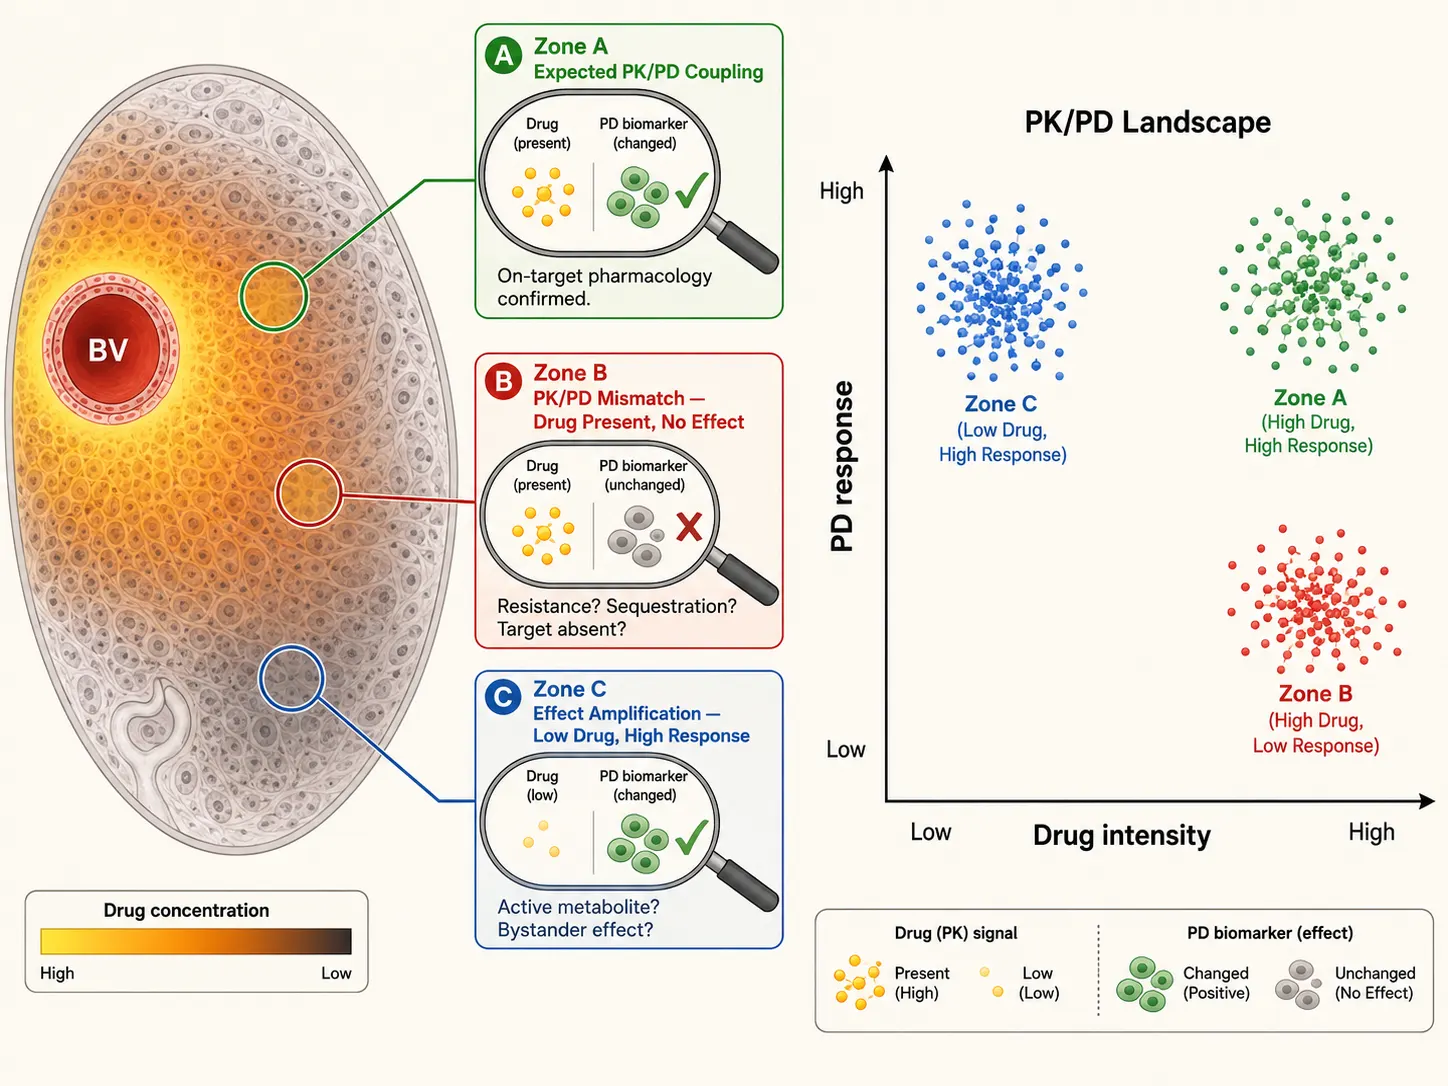 Figure 2: The PK/PD Mismatch Concept — Drug Present but No Effect, and Vice Versa. A conceptual tissue cross-section illustration centered on a blood vessel (left), with a drug concentration gradient shown as a warm-color (red-to-yellow-to-blue) heatmap radiating outward into the tissue parenchyma. Three pharmacologically distinct zones are demarcated with dashed boundaries and annotated letter labels. Zone A (green outline, vessel-proximal): Expected PK/PD coupling — drug concentration heatmap shows red (high), overlaid PD response markers (e.g., phosphorylated target, metabolic pathway suppression) shown as checkmark icons, with the annotation "On-target pharmacology confirmed." Zone B (red outline, intermediate distance): PK/PD mismatch — drug concentration heatmap shows yellow (moderate), but PD response markers show an X icon, with the annotation "Drug present, no effect → Resistance or sequestration." Inset magnified view of Zone B shows a cellular-level schematic of lysosomal drug trapping: drug molecules (small colored dots) accumulating inside lysosomes (membrane-bound vesicles) without reaching the cytoplasmic target. Zone C (blue outline, distal): Effect amplification — drug concentration heatmap shows blue (low), yet PD response markers show a triple-checkmark icon, with the annotation "Low drug, high response → Active metabolite or bystander killing." A horizontal profile graph beneath the tissue section plots drug concentration (red line) and PD response (green line) as a function of distance from the blood vessel, with the three zones demarcated by vertical dashed lines — the green PD line diverging from the red drug line in Zones B and C.
Experimental Design for In Situ PK/PD Studies
Tissue Harvest Timing and Biological Replicates
Harvest timing must be anchored to the drug's known plasma pharmacokinetic profile. The primary time point is Tmax — the time of peak plasma concentration — which typically corresponds to peak tissue exposure for well-perfused organs. A secondary time point at 2-4× the elimination half-life captures the distribution and response during the elimination phase. A minimum of three biological replicates per group per time point is recommended; five or more are preferred when inter-animal variability in drug absorption or metabolism is high. All animals in a given study must receive the same drug dose by the same route, with tissue harvest times standardized to within ±5 minutes of the nominal time point.
Section Selection and Fresh-Frozen Requirement
Serial sections (typically 10-12 μm thickness) are cut from each tissue block: one section for drug imaging (Module I), an adjacent section for spatial metabolomics (Module II), and a third section for H&E staining to guide histological annotation. All tissue must be fresh-frozen — snap-frozen in liquid nitrogen or isopentane-cooled dry ice immediately after harvest, without fixation. FFPE processing washes out the majority of small-molecule drugs and metabolites and is incompatible with in situ PK/PD.
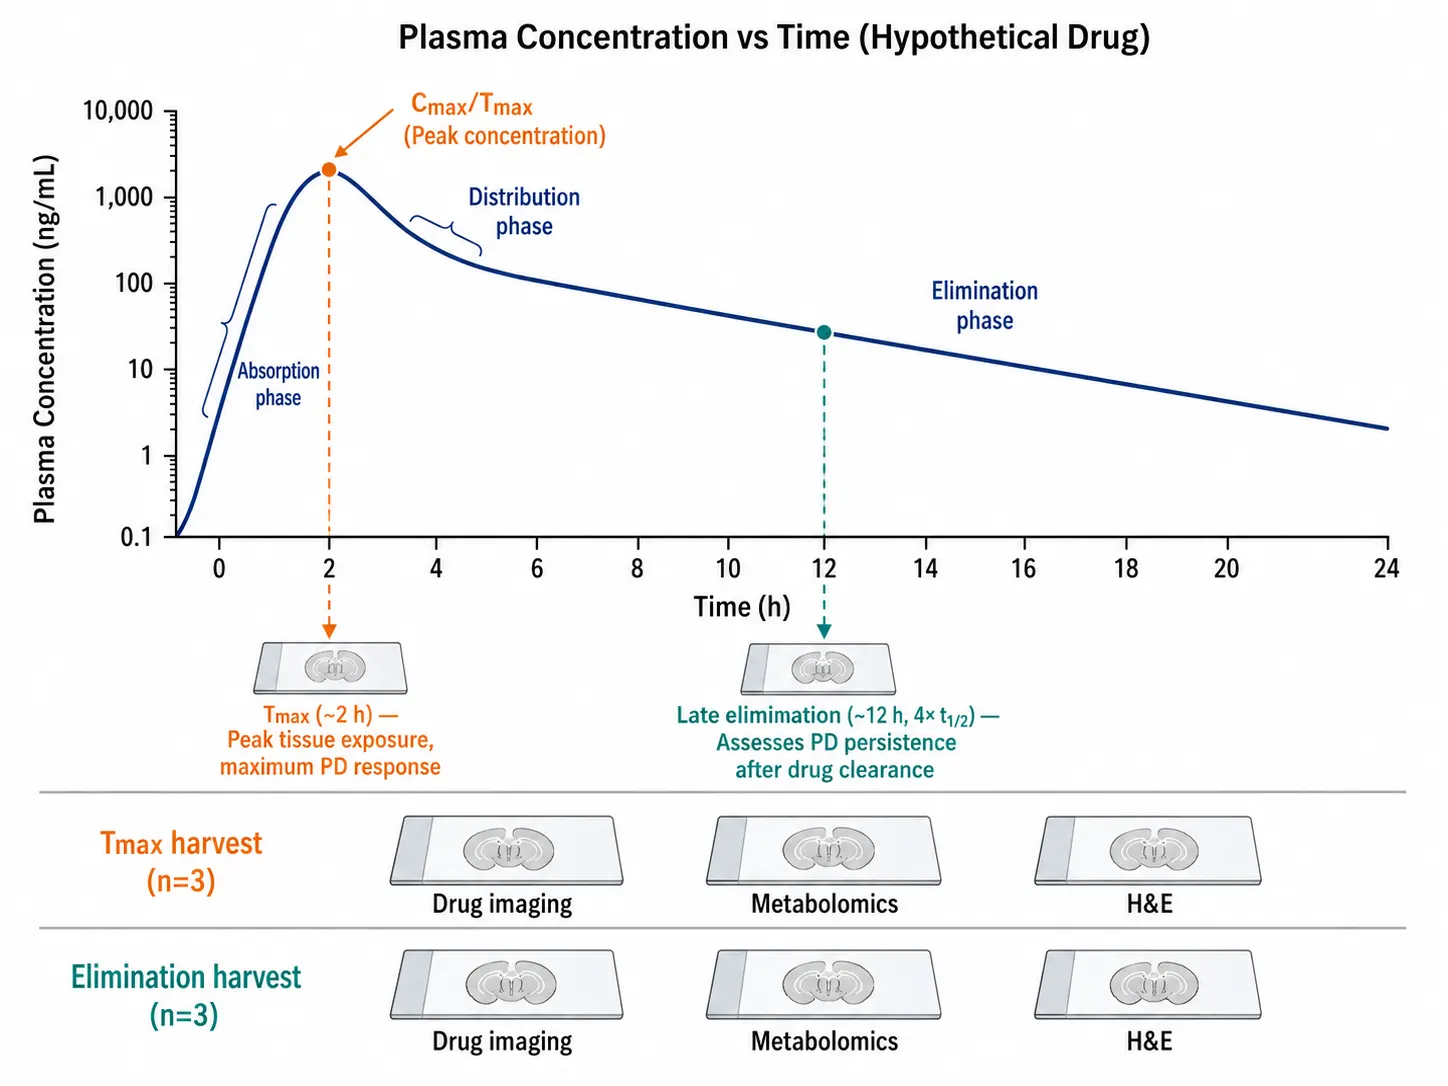 Figure 3: Time-Point Selection for Tissue Harvest — Plasma PK Curve with Tissue Sampling Windows. Two-panel figure. Top panel: a semi-log plasma drug concentration-time curve with a biphasic elimination profile, rendered as a clean scientific line graph with individual animal data points (n=3) at each sampling time. Two vertical shaded bands highlight the recommended tissue harvest windows: a green band centered on Tmax (~2 h, labeled "Primary harvest: Peak tissue exposure, maximum PD response") and a blue band at 4× elimination half-life (~12 h, labeled "Secondary harvest: Residual PD effect after clearance, duration of action"). The y-axis is log-scale plasma concentration (ng/mL), x-axis is time (h). Bottom panel: a schematic of the experimental design matrix — a 2×3 grid showing two time points (Tmax, Tlate) × three biological replicates, each cell containing three serial section icons: a red-bordered section for Module I (drug imaging), a blue-bordered section for Module II (spatial metabolomics), and a purple-bordered section for H&E histology. Annotations emphasize: "Same slide per time point," "Vehicle controls at each time point," "Standardize harvest to ±5 min of nominal time."
Case Study Examples
Benzbromarone in ADPKD Renal Cysts — CAM Model DESI-MS (ASN Kidney Week 2025)
A 2025 study presented at ASN Kidney Week used DESI-MS imaging to map benzbromarone distribution in human ADPKD renal cyst tissue cultured on the chorioallantoic membrane (CAM) — a 3D in vivo preclinical model. DESI-MS successfully distinguished renal cyst tissue from surrounding CAM membrane based on lipid and metabolite profiles. Benzbromarone was detected within renal cyst tissue, with imaging revealing its penetration pattern and preferential accumulation around the cyst epithelium. Drug metabolites and compounds associated with apoptotic processes were also detected, demonstrating the CAM-DESI-MS platform's capability to provide spatially resolved PK and early PD readouts simultaneously. The study illustrates the value of in situ PK/PD for drugs targeting cystic diseases, where drug penetration into the cyst lumen across the epithelial barrier is a critical efficacy determinant that plasma PK cannot assess.
Anticancer Drug PK/PD in Tumor Xenografts
In oncology applications, MALDI-MSI has been used to map both drug distribution and metabolic response in xenograft tumors, as detailed in our spatial drug distribution guide. The typical workflow images doxorubicin or paclitaxel distribution alongside lipid remodeling and energy metabolism changes, revealing that drug accumulation in well-perfused tumor periphery produces strong metabolic perturbation (e.g., phosphatidylcholine depletion, ATP decrease), while the hypoxic core — despite detectable drug — shows minimal metabolic response. This mismatch pattern directly informs combination strategies: adding a vascular normalization agent to improve core perfusion, or a hypoxia-activated prodrug to target the resistant subregion.
CNS Drug Regional PK/PD in Brain
For CNS drugs, MALDI-MSI of sagittal brain sections maps drug distribution across anatomical regions (cortex, hippocampus, striatum, cerebellum) alongside region-specific neurotransmitter and metabolite changes. The key question — does the drug reach its target brain region at adequate concentration? — is answered directly by co-localization of drug ion and PD biomarker ion within the same anatomical structure.
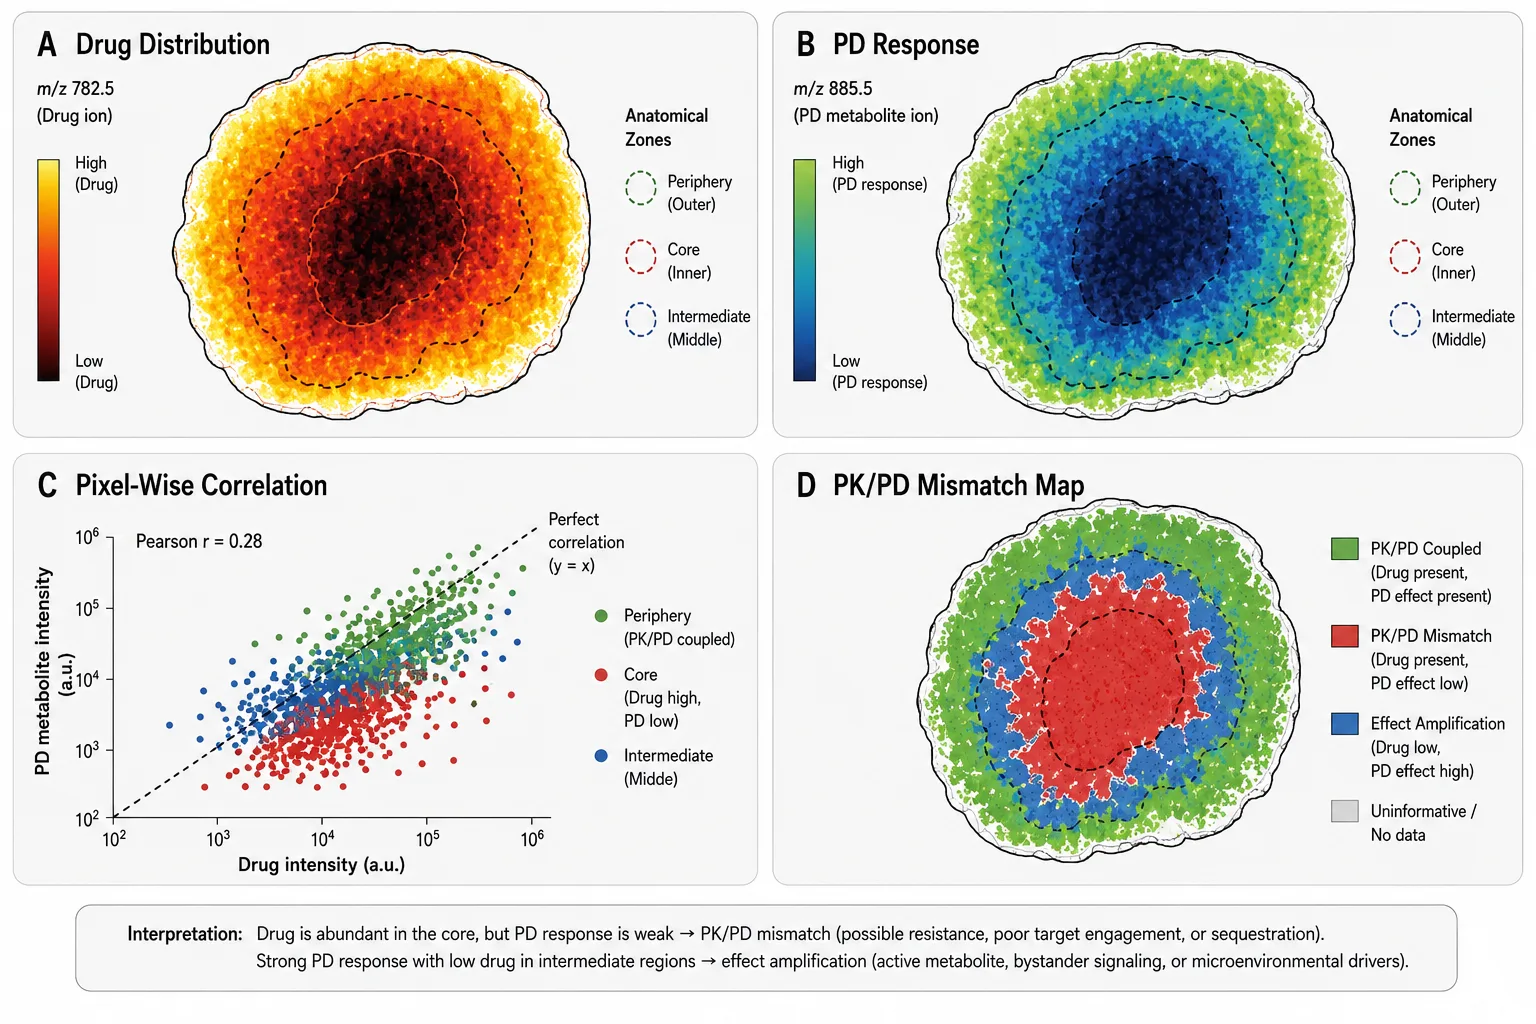 Figure 4: Pixel-Wise PK/PD Correlation — From Raw Ion Images to Integrated Spatial Map. A four-panel composite figure arranged in a 2×2 grid. Panel A (top-left): Drug distribution ion image — a tissue section with a warm-color heatmap (fire scale: black→red→yellow→white) showing drug intensity, with a clear periphery-to-core gradient. Scale bar = 1 mm, color scale annotated with "Drug ion intensity (a.u.)." Panel B (top-right): PD metabolite ion image — the adjacent serial tissue section with a cool-color heatmap (blue→cyan→green) showing the intensity of a key PD biomarker metabolite (e.g., a TCA cycle intermediate or phospholipid species). The spatial pattern mirrors the drug distribution but with notable differences in specific subregions highlighted by dashed circles. Panel C (bottom-left): Pixel-wise scatter plot — drug intensity (x-axis) vs. PD metabolite intensity (y-axis), with each point representing one pixel (or binned superpixel), colored by anatomical zone (green = tumor periphery, orange = intermediate, red = tumor core). A linear regression line is displayed with the Pearson correlation coefficient (r = 0.72) and p-value. Points in the mismatch zone (high drug, low PD) are circled. Panel D (bottom-right): Final PK/PD integration map — the tissue section with a three-color overlay: green = PK/PD coupled (drug and PD both high), red = PK/PD mismatch (drug high, PD low), blue = effect amplification (drug low, PD high). A legend decodes the three colors with concise descriptions: "Coupled — on-target pharmacology," "Mismatch — resistance/sequestration," "Amplification — active metabolite/bystander."
Integration with Traditional PK/PD
Spatial PK/PD Complements Plasma PK and Pharmacometric Modeling
In situ PK/PD does not replace traditional plasma PK or compartmental pharmacometric modeling — it adds a spatial dimension that these methods lack. Plasma PK defines the systemic exposure timeline; population PK/PD models relate dose to systemic response. In situ PK/PD adds tissue-level granularity: it answers whether the drug actually reaches the tissue compartment where its target resides, whether the drug is uniformly distributed or concentrated in subregions, and whether local drug concentration correlates with local PD effect. The three approaches are complementary layers of a comprehensive PK/PD package.
When In Situ PK/PD Is Worth the Investment
In situ PK/PD adds the most value when: (a) the drug target is located in a tissue compartment with known penetration barriers (tumor, brain, cyst, fibrotic tissue); (b) there is unexplained disconnect between plasma exposure and efficacy in preclinical models; (c) the drug has a narrow therapeutic index and tissue-specific toxicity is suspected; or (d) the drug is an ADC, nanoparticle, or large molecule where tissue penetration heterogeneity is a known liability. For well-perfused, homogeneous target tissues with established plasma-tissue correlation, traditional PK/PD may suffice.
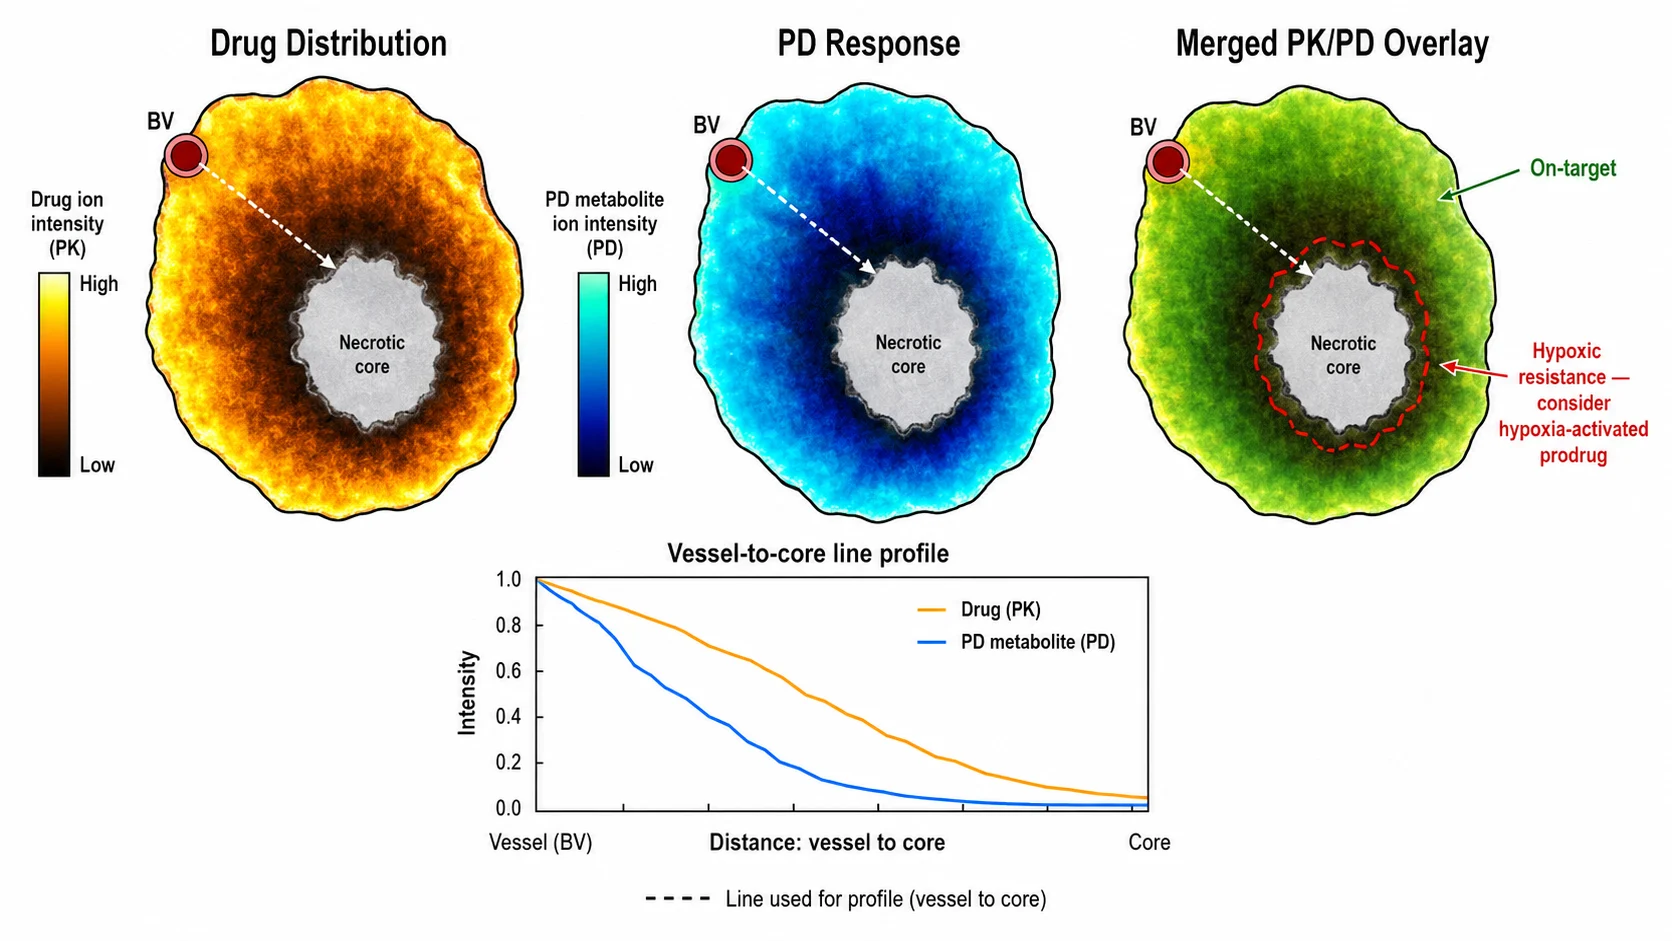 Figure 5: Case Study — Drug Gradient and Metabolic Response in a Tumor Xenograft. A composite illustration of a tumor xenograft cross-section organized into three horizontal panels plus a bottom profile graph. The tumor is depicted as an irregular ovoid with a peripheral blood vessel on the left and a central necrotic core on the right, rendered as a grayscale H&E-style background for anatomical context. Left panel: Drug distribution map — a warm-color heatmap (red→yellow→black) showing doxorubicin/paclitaxel intensity concentrated in the well-perfused tumor periphery (within ~75 μm of the vessel) and steeply declining toward the necrotic core. Center panel: PD metabolic response map — a cool-color heatmap (blue→cyan→white) showing phosphatidylcholine depletion and ATP decrease (PD biomarkers) mirroring the drug distribution pattern, with the strongest metabolic perturbation in the vessel-proximal zone. Right panel: Integrated PK/PD map — a three-color overlay: green (PK/PD coupling) in the perfused periphery where drug and PD response co-localize; a red dashed boundary encircling the hypoxic core labeled "PK/PD mismatch zone — drug detectable but minimal metabolic response"; and a small blue zone at the invasion front labeled "Effect amplification — paracrine apoptosis signal." Bottom graph: A spatial line profile plotting drug concentration (red line, left y-axis) and PD metabolite intensity (blue line, right y-axis) as a function of distance from the blood vessel (x-axis, 0-500 μm). Both signals show exponential decay with distance, but the PD line plateaus at ~200 μm while the drug line continues to decline — the mismatch is visible as the divergence of the two curves. A callout box summarizes the clinical implication: "Adding a vascular normalization agent or hypoxia-activated prodrug could convert mismatch zones to coupled zones."
All in situ PK/PD profiling and mass spectrometry imaging metabolomics services described in this article are provided for Research Use Only (RUO). These workflows are not intended for diagnostic, therapeutic, or clinical decision-making purposes.
FAQ
Q: What is the minimum number of tissue sections needed for an in situ PK/PD study?
A: A minimum of three serial sections per tissue block: one for drug imaging (Module I), one for spatial metabolomics (Module II), and one for H&E histology. Additional sections may be required for technical replicates or for targeted follow-up experiments.
Q: Can in situ PK/PD be performed on FFPE tissue?
A: No. Fresh-frozen tissue is required because FFPE processing — particularly the organic solvent dehydration and paraffin embedding steps — removes small-molecule drugs and metabolites. Snap-freezing immediately after tissue harvest is essential for preserving both drug distribution and endogenous metabolome integrity.
Q: How do I distinguish drug-induced metabolic changes from normal biological variation?
A: Vehicle control tissue is essential. Tissue from animals receiving the drug vehicle (formulation without active drug) under identical conditions must be processed and imaged on the same slide as drug-treated tissue. The comparison of drug-treated vs. vehicle control within the same acquisition batch isolates the drug-specific metabolic effect from biological and technical variation.
Q: What does a PK/PD mismatch zone tell me?
A: A PK/PD mismatch zone — drug present but no PD effect — may indicate target absence or downregulation, drug sequestration in a pharmacologically inactive compartment (e.g., lysosomes), microenvironment-mediated resistance (e.g., hypoxia-driven metabolic reprogramming), or that the wrong PD biomarker is being monitored. Each explanation has different implications for drug development strategy.
References:
- In situ analysis of drug and metabolite distribution in a three-dimensional in vivo cyst model of ADPKD using desorption electrospray ionization-mass spectrometry (DESI-MS). J Am Soc Nephrol. 2025;36(10S):FR-PO0684. Available at: https://journals.lww.com/jasn/fulltext/2025/10001/in_situ_analysis_of_drug_and_metabolite.2105.aspx
- Kibbe RR, Muddiman DC. Quantitative mass spectrometry imaging (qMSI): a tutorial. J Mass Spectrom. 2024;59(4):e5009. doi:10.1002/jms.5009
- Holbrook JH, Kemper GE, Hummon AB. Quantitative mass spectrometry imaging: therapeutics & biomolecules. Chem Commun. 2024;60(16):2137-2151. doi:10.1039/D3CC05988J
- Moore AM, Bowman A, Wali SN, et al. Quantitative analysis of drugs in a mimetic tissue model using nano-DESI on a triple quadrupole mass spectrometer. J Am Soc Mass Spectrom. 2024;35(12):3170-3177. doi:10.1021/jasms.4c00345
- Hejazi L, et al. MALDI-MSI identifies TCA cycle metabolites as pharmacodynamic biomarkers for losartan in diabetic kidney disease. J Am Soc Nephrol. 2024;35(10S):FR-PO0949. doi:10.1681/ASN.2024z189qzy9
- Xu Y, Wang L, Tu J, Zang Q, Wang Y, et al. Spatial metabolomics combined with transcriptomics to reveal heterogeneous metabolism and drug response in the heart of rats with heart failure. Chin Chem Lett. 2025;36(7):110958. doi:10.1016/j.cclet.2025.110958















