

The tumor microenvironment (TME) is not a uniform mixture of cancer and immune cells — it is a spatially organized ecosystem with distinct cellular neighborhoods, metabolic gradients, and immune architectures that collectively determine disease trajectory and treatment response. Spatial multi-omics technologies — spanning transcriptomics, proteomics, and metabolomics — now enable the dissection of this architecture at resolutions from tissue regions down to individual cells. This article provides a practical framework for selecting spatial modalities to answer specific TME questions, applying spatial ecotype analysis to define recurrent cellular neighborhoods, and integrating the often-overlooked metabolic dimension of the TME into spatial profiling studies. We focus on the 2025-2026 evidence base and emphasize actionable experimental design principles for researchers planning spatial TME investigations.
The Spatial Architecture of the Tumor Microenvironment — Why Space Matters
TME Cellular Neighborhoods: Beyond "Cold" vs "Hot" Tumors
The binary "cold" versus "hot" tumor classification — based on the presence or absence of CD8+ T cells in the tumor parenchyma — has been a useful clinical heuristic for immunotherapy patient stratification but collapses a rich spatial biology into a single dimension. A tumor can be "hot" at its invasive margin yet immunologically "cold" at its core. It can harbor dense immune infiltrates that are functionally excluded from tumor nests by a collagen-rich stromal barrier. It can contain tertiary lymphoid structures (TLS) that actively generate antitumor immune responses adjacent to regions of complete immune desertification. The 2025-2026 spatial multi-omics literature has moved decisively beyond the hot/cold dichotomy toward a neighborhood-level understanding of TME architecture — one in which the spatial relationships between cell types, rather than their bulk abundances, determine immune function. Our TME profiling service is designed to capture this spatial complexity through integrated multi-omics approaches.
Immune Exclusion, Immune Desert, and Immune Inflamed — Spatial Phenotypes
A more granular spatial classification, comprehensively reviewed by Zheng et al. (2024), distinguishes three canonical immune phenotypes that remain the dominant framework for spatial TME analysis. Immune-inflamed tumors show abundant CD8+ T cells within tumor nests and stroma, high interferon-γ response, and elevated antigen presentation — these are the prototypical responders to immune checkpoint blockade (ICB). Immune-excluded tumors retain T cells but trap them in the peritumoral stroma, prevented from contacting tumor cells by fibroblast-rich extracellular matrix barriers and chemokine mismatches; these tumors are often ICB-refractory with the worst prognosis in several cancer types. Immune-desert tumors show a paucity or absence of T cells throughout, typically driven by defective antigen presentation, low mutational burden, or expansion of immunosuppressive myeloid populations. In a 2025 AI-powered spatial TIL analysis of 304 resected pancreatic ductal adenocarcinoma (PDAC) specimens, 85.2% of tumors were immune-excluded, 9.9% immune-inflamed, and 4.9% immune-desert, with the immune-inflamed phenotype independently associated with the best overall and recurrence-free survival (Kim et al., 2025).
The Metabolic-Immune Axis: How Local Metabolism Shapes Immune Function
Underlying each immune phenotype is a metabolic landscape that actively regulates which immune cells can survive, proliferate, and function at each spatial coordinate. Tumor cells engage in aerobic glycolysis (the Warburg effect), producing lactate at millimolar concentrations that acidify the local microenvironment. Lactate is now recognized as a master immunoregulatory metabolite rather than a waste product: it impairs CD8+ T cell cytotoxicity and proliferation, promotes regulatory T cell (Treg) function, drives M2 macrophage polarization, and stabilizes HIF-1α to upregulate PD-L1 expression. It also functions as an epigenetic regulator through histone lysine lactylation at immune gene loci. In parallel, the tryptophan-catabolizing enzymes IDO1 and TDO2, overexpressed in many tumors, deplete local tryptophan and produce kynurenine — a metabolite that engages the aryl hydrocarbon receptor (AhR) on CD8+ T cells and dendritic cells to suppress antitumor immunity and promote Treg differentiation. Adenosine, generated from ATP by CD39/CD73 ectonucleotidases on tumor and stromal cells, signals through A2A receptors to further suppress effector T cell function. These three metabolic axes — lactate, kynurenine, and adenosine — constitute a spatially heterogeneous immunosuppressive network that cannot be detected by bulk tumor profiling and requires spatial metabolomics to resolve (Wang et al., 2026; Hartmann, 2025).
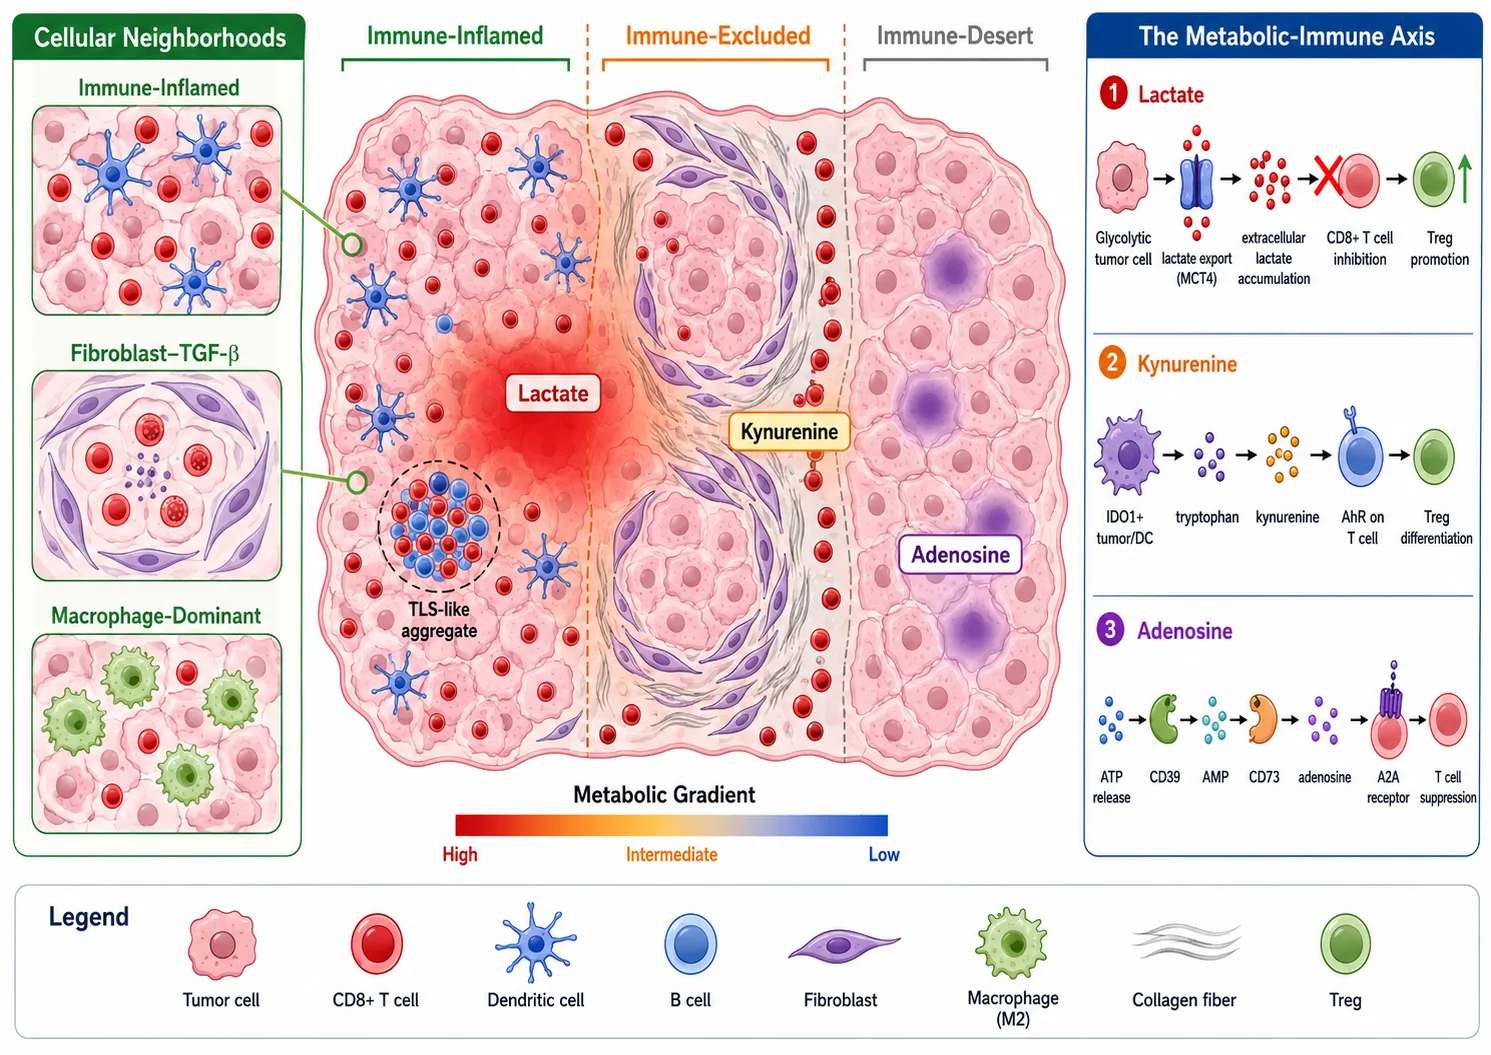 Figure 1: TME spatial architecture overview — the three immune phenotypes (inflamed, excluded, desert) shown on a tissue section with cellular neighborhoods, metabolic gradients, and the metabolic-immune axis highlighted
Spatial Modality Selection for TME Questions
Selecting the right spatial technology for a given TME question is the single most consequential experimental design decision — and one that the current review literature rarely addresses in practical terms. Chang et al. (2026) cataloged the spatial multi-omics TME technology landscape but did not provide a decision framework. Here, we map specific TME research questions to the most appropriate spatial modalities, considering analyte coverage, spatial resolution, throughput, and sample compatibility.
Immune Cell Mapping: Spatial Transcriptomics and Spatial Proteomics
For questions about immune cell identity, abundance, and spatial distribution — "which immune cells are present, where are they located, and in what activation states?" — spatial transcriptomics (10x Visium, Xenium, MERFISH, CosMx) and spatial proteomics (MIBI-TOF, CODEX, Imaging Mass Cytometry) are the primary tools. Spatial transcriptomics provides genome-wide coverage at spot (Visium, 55 μm) or single-cell (Xenium, MERFISH) resolution, enabling discovery-driven immune cell mapping, cell-type deconvolution, and pathway-level analysis of immune activation states. Spatial proteomics using Imaging Mass Cytometry (IMC) or CODEX offers 40-60 protein targets at subcellular resolution, directly quantifying key immune markers (CD8, CD4, FOXP3, PD-1, PD-L1, Granzyme B) and their spatial co-localization with tumor and stromal cells. The 2024 HCC study by Salié et al. exemplifies the proteomics approach: 41-plex IMC on 101 HCC specimens identified 23 cell types and three immune neighborhoods that predicted immunotherapy outcome.
Metabolic Zonation: Spatial Metabolomics
For questions about metabolic heterogeneity — "where in the tumor are glycolysis, glutaminolysis, and lipid synthesis most active, and how do these metabolic zones relate to immune cell distribution?" — spatial metabolomics by MALDI-MSI or DESI-MSI is the essential modality. Tumor cores are typically glycolytic and hypoxic (high lactate, low glucose, HIF-1α activation), while invasive margins often rely on oxidative phosphorylation and fatty acid oxidation. Across multiple cancer types — including glioblastoma, breast cancer, gastric cancer, and PDAC — core regions consistently express HK2, LDHA, and GLUT1 at high levels, while marginal zones retain OXPHOS activity and exhibit lactate uptake via MCT1 by stromal fibroblasts — a metabolic symbiosis that supports tumor invasion (Chen et al., 2025). For a broader introduction to the spatial metabolomics technology landscape, see our guide to spatial metabolomics by mass spectrometry imaging. For studies focused on lipid-mediated immune modulation, spatial lipidomics and our spatial lipidomics pillar provide complementary coverage.
Cell-Cell Communication and Stromal Remodeling
For questions about ligand-receptor interactions and stromal architecture — "which cells are communicating with each other, through what molecular pathways, and how does the extracellular matrix regulate this?" — a combination of spatial proteomics and spatial metabolomics is often required. Spatial proteomics maps cell-surface and secreted proteins (chemokines, cytokines, ECM components), while MALDI imaging lipidomics resolves lipid-mediated signaling molecules (PGE2, LPA, oxidized phospholipids) and membrane remodeling that accompanies fibroblast activation and epithelial-mesenchymal transition in the TME stroma (Lee and Lee, 2025).
Decision Matrix: TME Question to Spatial Modality
| TME Research Question | Recommended Modality | Key Output | Example Platform |
|---|---|---|---|
| Immune cell identity & distribution | Spatial transcriptomics | Cell-type maps, pathway activity | Visium, Xenium, MERFISH |
| Immune protein marker co-localization | Spatial proteomics | Protein-level cell phenotype maps | IMC, CODEX, MIBI-TOF |
| Metabolic zonation (glycolysis, hypoxia) | Spatial metabolomics | Metabolite gradient maps | MALDI-MSI, DESI-MSI |
| Lipid-mediated immune signaling | Spatial lipidomics | Lipid species distribution maps | MALDI-MSI (lipid-targeted) |
| Ligand-receptor & cell-cell interactions | Spatial proteomics + transcriptomics | Co-localized ligand-receptor pairs | IMC + Visium (serial sections) |
| Stromal remodeling & ECM architecture | Spatial proteomics + lipidomics | ECM protein + lipid remodeling maps | IMC + MALDI-MSI |
| Drug penetration & metabolic response | Spatial metabolomics + spatial transcriptomics | Drug ion maps + transcriptional response | MALDI-MSI + Visium (same-section) |
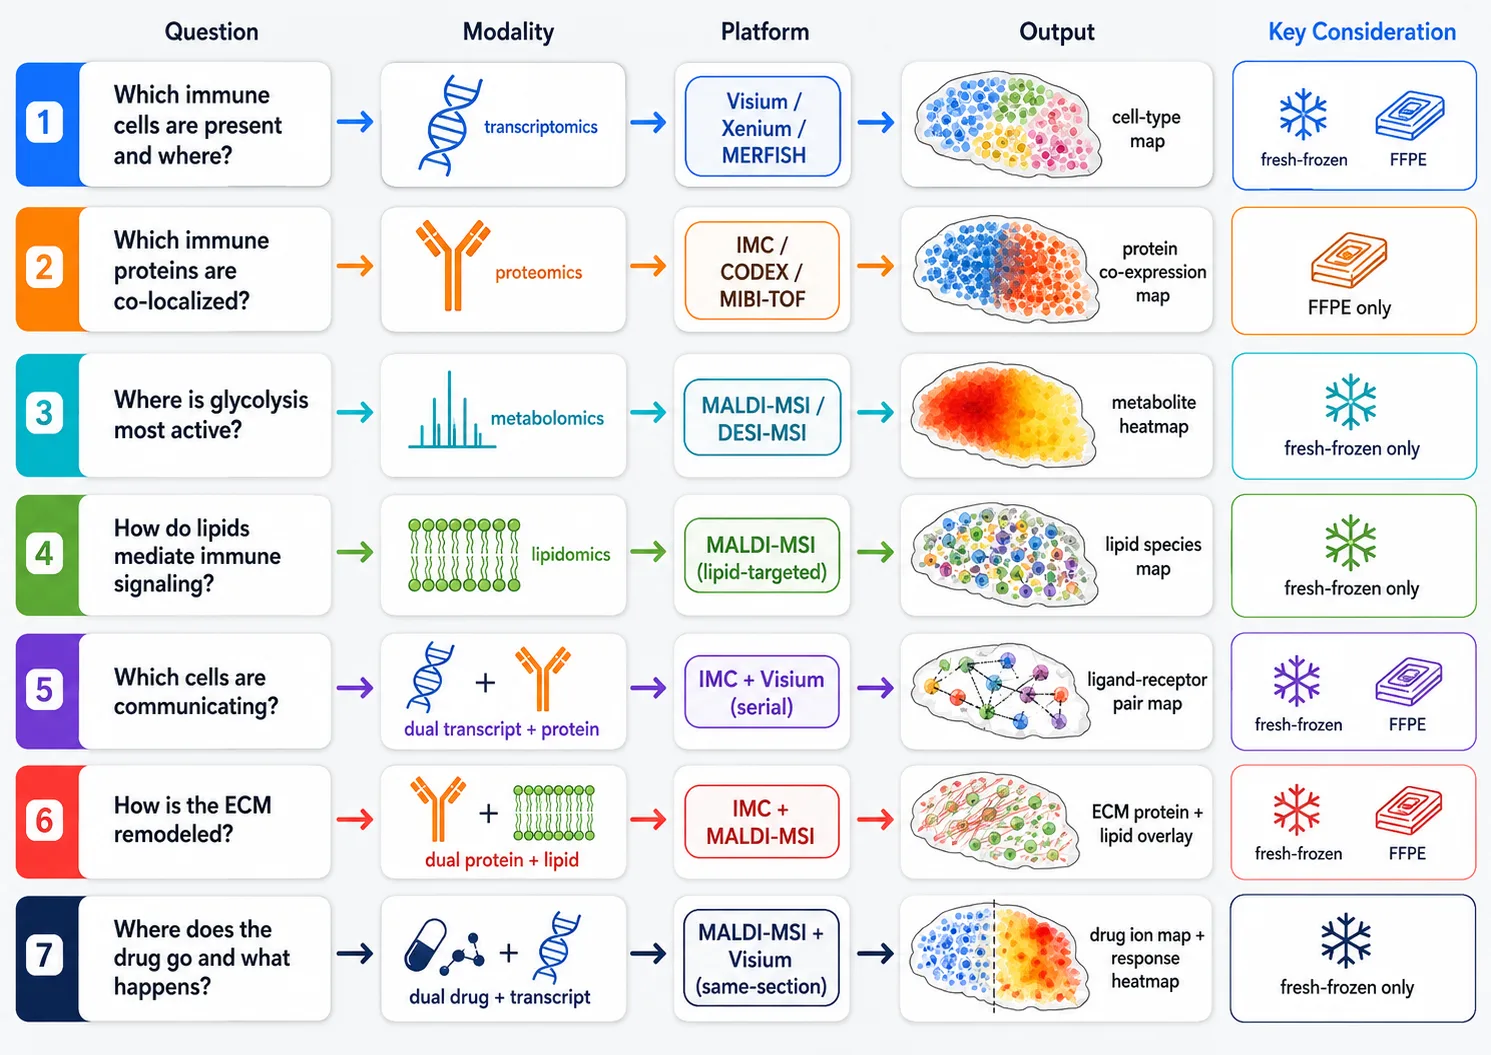 Figure 2: Spatial modality selection decision matrix for TME questions — a visual decision guide mapping seven TME research questions to recommended modalities, platforms, and expected outputs
Spatial Ecotypes and Recurrent Cellular Neighborhoods (RCNs)
Defining Spatial Ecotypes: Recurrent Cellular Neighborhood Analysis
A spatial ecotype — also called a recurrent cellular neighborhood (RCN) — is a stereotyped, spatially co-occurring assembly of cell types that recurs across multiple tumors and patients. Unlike a cell-type proportion, which counts how many cells of each type are present, an ecotype captures which cell types are physically adjacent in space, implying functional interaction. The foundational EcoTyper framework (Luca et al., 2021, Cell) established the ecotype discovery paradigm: (1) use single-cell RNA-seq to define discrete cell states within each major lineage, (2) apply CIBERSORTx to estimate cell-state abundances in bulk tumor transcriptomes, (3) identify co-occurring cell states using community detection algorithms, and (4) validate the spatial co-localization of ecotype members using spatial transcriptomics. Applied to 16 human carcinoma types across 5,946 tumors, EcoTyper identified 69 cell states organized into 10 multicellular ecotypes, several of which were independently prognostic across cancer types.
Computational Methods for Ecotype Detection
Beyond EcoTyper, several computational frameworks support spatial ecotype analysis. For spatial proteomics data, unsupervised clustering of cell-type composition vectors across spatial neighborhoods (k-means or Louvain community detection on spatial neighborhood graphs) identifies RCNs without requiring a pre-trained reference — this was the approach used by Salié et al. (2024) to define three immune neighborhoods in HCC. For spatial transcriptomics data, graph-based methods (Spatial-Louvain, BayesSpace, Giotto) construct spatial adjacency graphs where nodes are spots or cells and edges connect spatial neighbors, then apply community detection to identify transcriptionally coherent spatial domains. For integrated spatial multi-omics data, multi-view graph learning or coupled matrix factorization can identify ecotypes that are coherent across transcript, protein, and metabolite layers simultaneously (Chang et al., 2026).
Clinical Relevance: Spatial Ecotypes Predict Immunotherapy Response Better Than Bulk Composition
Across multiple cancer types, ecotype membership has emerged as a stronger predictor of immunotherapy response than bulk cell-type proportions or even conventional biomarkers such as PD-L1 expression and tumor mutational burden. In LUAD, the EC10 ecotype — defined by fibroblast TGF-β signaling, EMT enrichment, and exhausted CD8+ T cell co-localization — predicted ICB resistance across four independent treated cohorts, while the EC12 ecotype (NK cells, CD4/CD8 T cells, IFN-α/γ response) was ICB-responsive (Lee and Lee, 2025). In HCC, the spatial immunotype classification (depleted vs. compartmentalized vs. enriched) derived from IMC neighborhood analysis significantly stratified progression-free survival under checkpoint inhibitor therapy, and critically, the presence of a single immune-enriched region within an otherwise depleted tumor was sufficient to confer favorable outcomes (Salié et al., 2024). This finding has profound implications: sampling a single tumor region may misclassify patients in clinical trials, and multi-region spatial profiling should be the standard for TME biomarker studies.
Multi-Omics Ecotypes: Integrating Metabolic Layers into RCN Definition
Most ecotype studies to date use transcriptomics or proteomics alone. A major frontier is the integration of metabolic layers into ecotype definition — defining neighborhoods not only by "which cells co-locate" but also by "what metabolic environment they share." A tumor region with CD8+ T cells co-localized with high lactate and low glucose is functionally distinct from a region with the same T cell density but normal metabolic conditions — the former represents T cells trapped in an immunosuppressive metabolic sink, while the latter represents T cells in a supportive niche. For methodologies that bridge spatial multi-omics integration, see our integrated spatial multi-omics frameworks article.
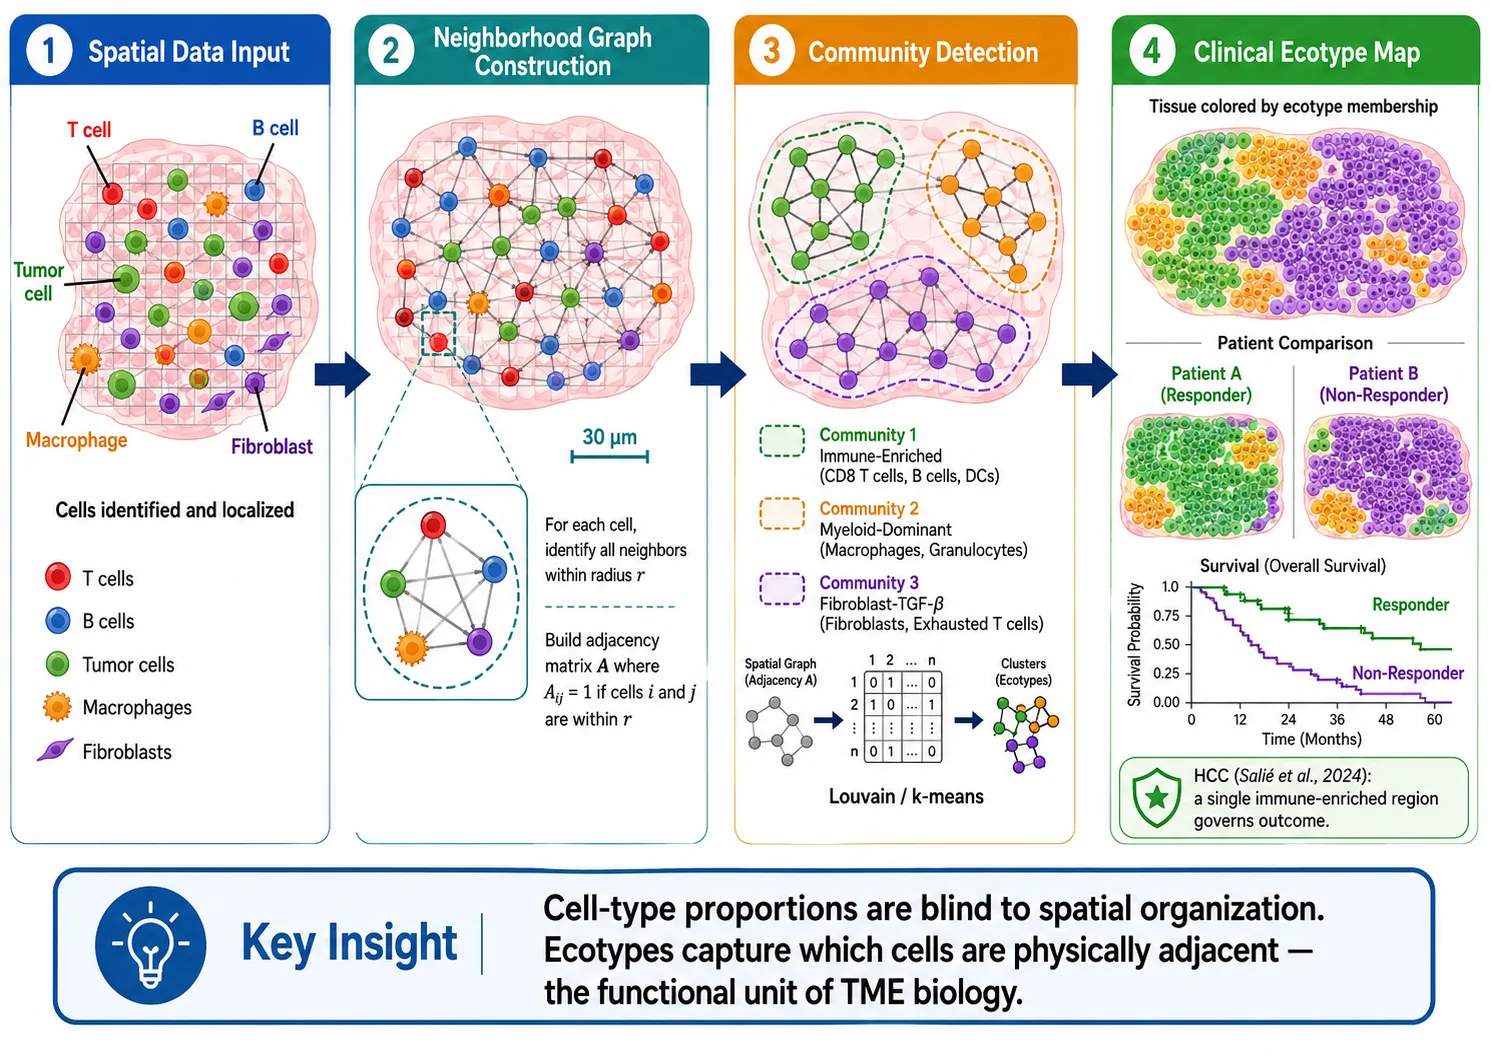 Figure 3: Spatial ecotype/RCN concept — a visual walkthrough from spatial neighborhood graph construction to community detection to clinically relevant ecotype identification, with the HCC immunotype example
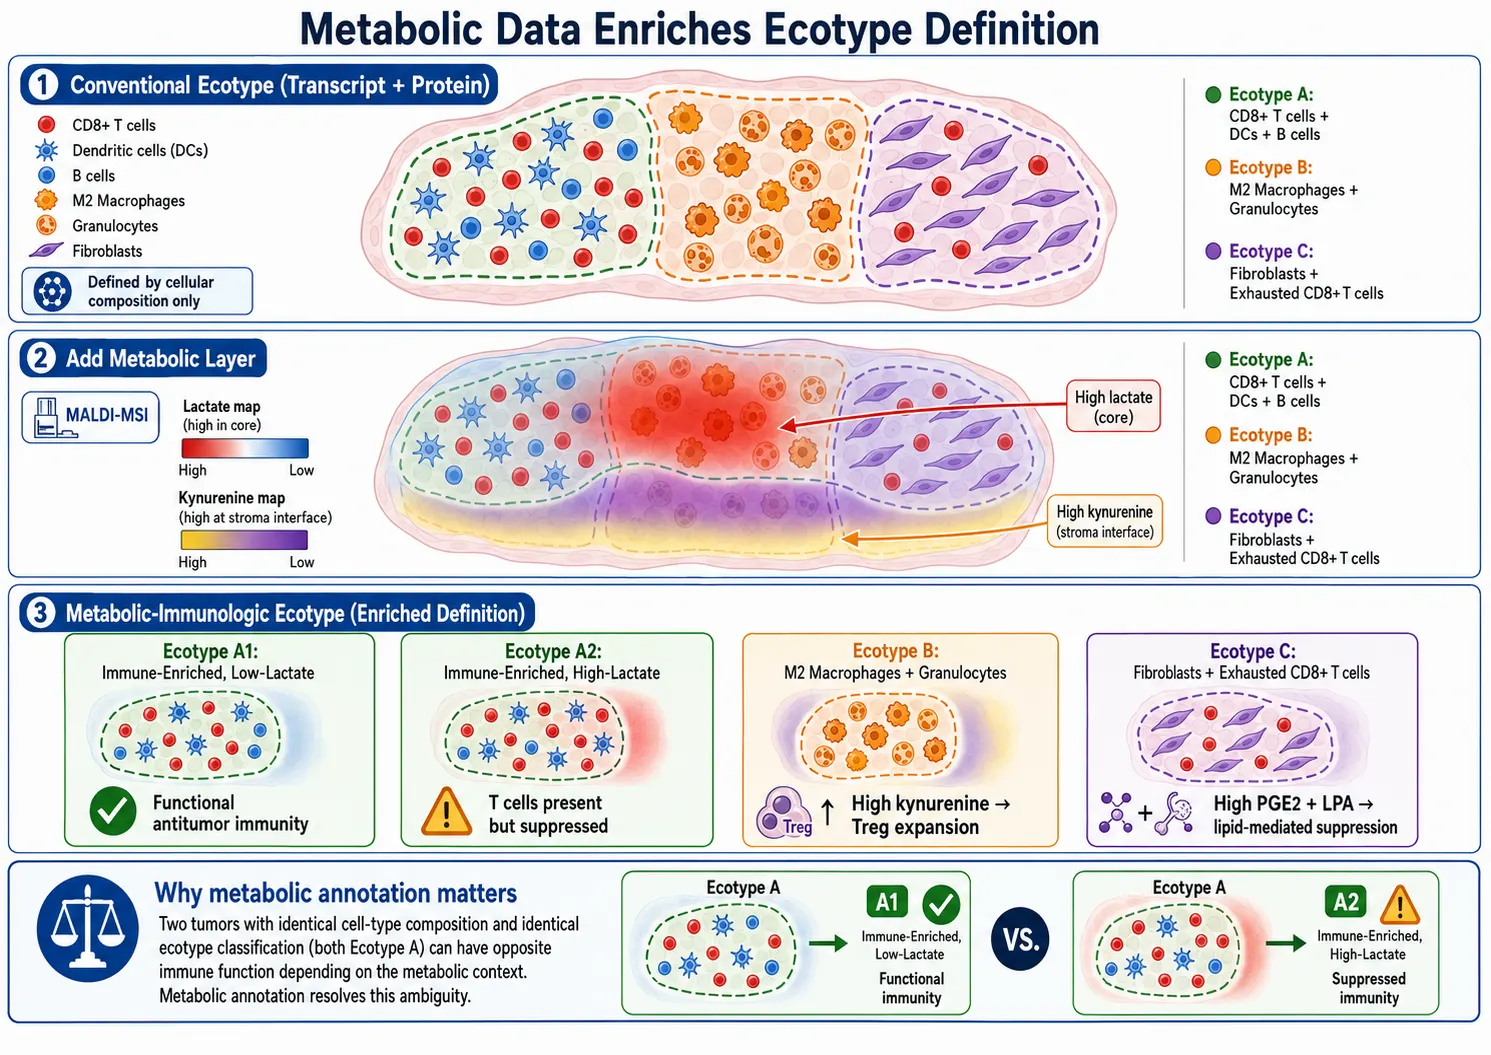 Figure 4: Multi-omics ecotype integration concept — adding metabolic layers (MALDI-MSI lactate, kynurenine maps) to transcript- and protein-based ecotype definitions to create functionally annotated metabolic-immunologic ecotypes
Spatial Metabolomics in the TME — The Missing Layer
The TME Metabolic Landscape
Spatial metabolomics is the most underutilized modality in TME profiling despite being the most functionally informative at the metabolic-immune interface. A bibliometric analysis of 182 publications from 2000-2025 found that spatial metabolomics in cancer research has accelerated sharply since 2018, with China, the USA, and Germany as the leading contributors, yet integration with immune profiling remains rare — fewer than 15% of spatial metabolomics cancer studies co-register metabolite maps with immune cell distributions (Chen et al., 2025). The core metabolic phenotypes in the TME — hypoxia-driven glycolysis in the tumor core, OXPHOS at the invasive margin, glutaminolysis supporting nucleotide biosynthesis in proliferating tumor cells, and lipid reprogramming (increased fatty acid synthesis, ceramide accumulation, phospholipid remodeling) — are now well-characterized, but their spatial relationships with specific immune cell populations and functions remain largely unmapped.
Immunometabolism In Situ: Lactate, Kynurenine, and Adenosine Gradients
The three dominant immunometabolic axes — lactate, kynurenine, and adenosine — each exhibit distinct spatial distributions in the TME that can now be measured by MALDI-MSI. Lactate is concentrated in hypoxic tumor cores, forming gradients that radiate outward; CD8+ T cells trapped in high-lactate zones show reduced Granzyme B and IFN-γ production, and the lactate-HIF-1α-PD-L1 axis creates a self-reinforcing immunosuppressive loop. Kynurenine, produced by IDO1/TDO2-expressing tumor cells and dendritic cells, diffuses across tissue and engages AhR on infiltrating T cells to suppress effector function and promote Treg differentiation — spatial mapping of kynurenine in ovarian cancer revealed elevated concentrations co-localized with FOXP3+ Treg-rich regions at the tumor-stroma interface (Wang et al., 2026). Adenosine, generated by the sequential action of CD39 and CD73 on extracellular ATP released from dying cells, accumulates in hypoxic and inflamed regions where ATP release is high and adenosine clearance is impaired, signaling through A2A receptors to broadly suppress innate and adaptive immunity.
Lipid-Mediated Immune Suppression in the TME
Beyond small polar metabolites, lipid species play increasingly recognized immunomodulatory roles that are accessible through MALDI imaging lipidomics. Prostaglandin E2 (PGE2), produced by COX-2 in tumor and stromal cells, suppresses dendritic cell maturation and promotes myeloid-derived suppressor cell (MDSC) expansion. Lysophosphatidic acid (LPA) and oxidized phospholipids signal through G-protein-coupled receptors to drive fibroblast activation and immune cell chemotaxis. Ceramide accumulation in the tumor-invasive margin has been linked to both apoptosis signaling and immune modulation. The integration of MALDI-MSI with Imaging Mass Cytometry on the same tissue sections — demonstrated on colorectal tumors in 2025 — has begun to directly link specific lipid species with specific immune cell phenotypes, such as the association of particular glycerophospholipid signatures with CD204+ tumor-associated macrophages (Hartmann, 2025).
MALDI-MSI for TME Metabolic Mapping: Practical Considerations
For TME applications, MALDI-MSI at 10-50 μm spatial resolution is the primary platform. Key practical considerations: fresh-frozen tissue is strongly preferred for metabolomics (FFPE processing removes most small metabolites), though protocols for FFPE lipid analysis are established. Matrix selection depends on the metabolite class of interest — DAN (1,5-diaminonaphthalene) for lipids in negative ion mode, DHB (2,5-dihydroxybenzoic acid) for positive-mode lipids, and 9-AA (9-aminoacridine) for small anionic metabolites including lactate and TCA cycle intermediates. Co-registration of MALDI-MSI data with H&E or IHC images from the same or adjacent sections is essential for linking metabolite gradients to histological features. For studies integrating metabolic and immune spatial data, bioinformatics analysis support is critical for cross-modality data alignment and interpretation.
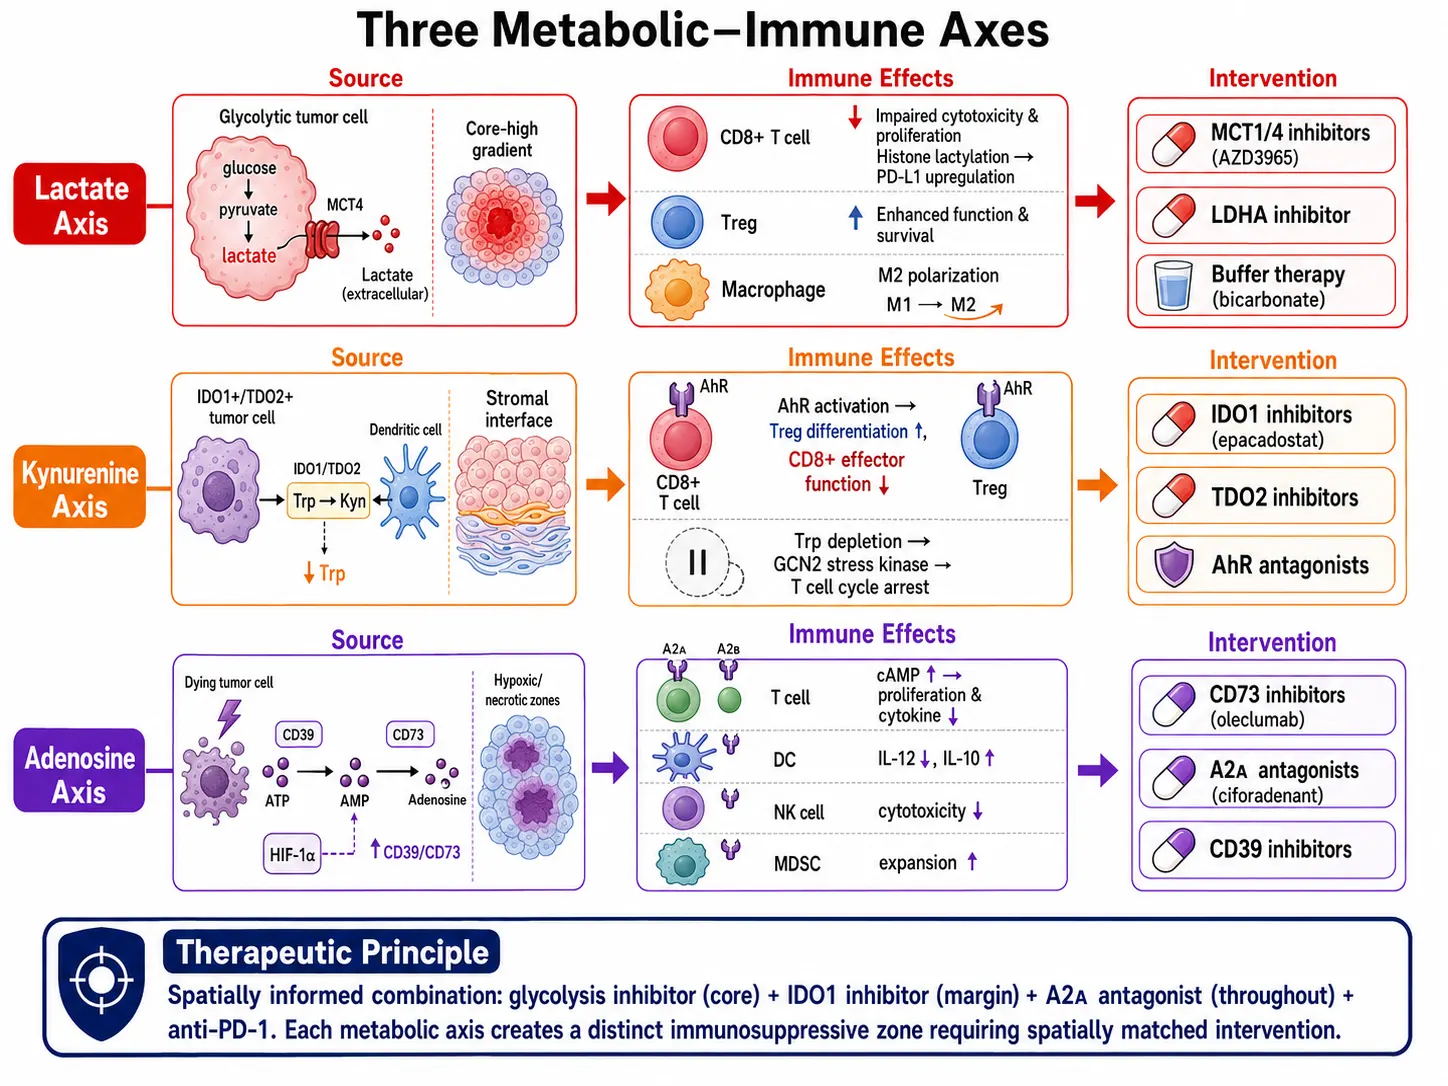 Figure 5: TME spatial metabolomics — the metabolic-immune axis concept diagram showing the three major immunoregulatory metabolite axes (lactate, kynurenine, adenosine) with their spatial distributions, immune targets, and therapeutic intervention points
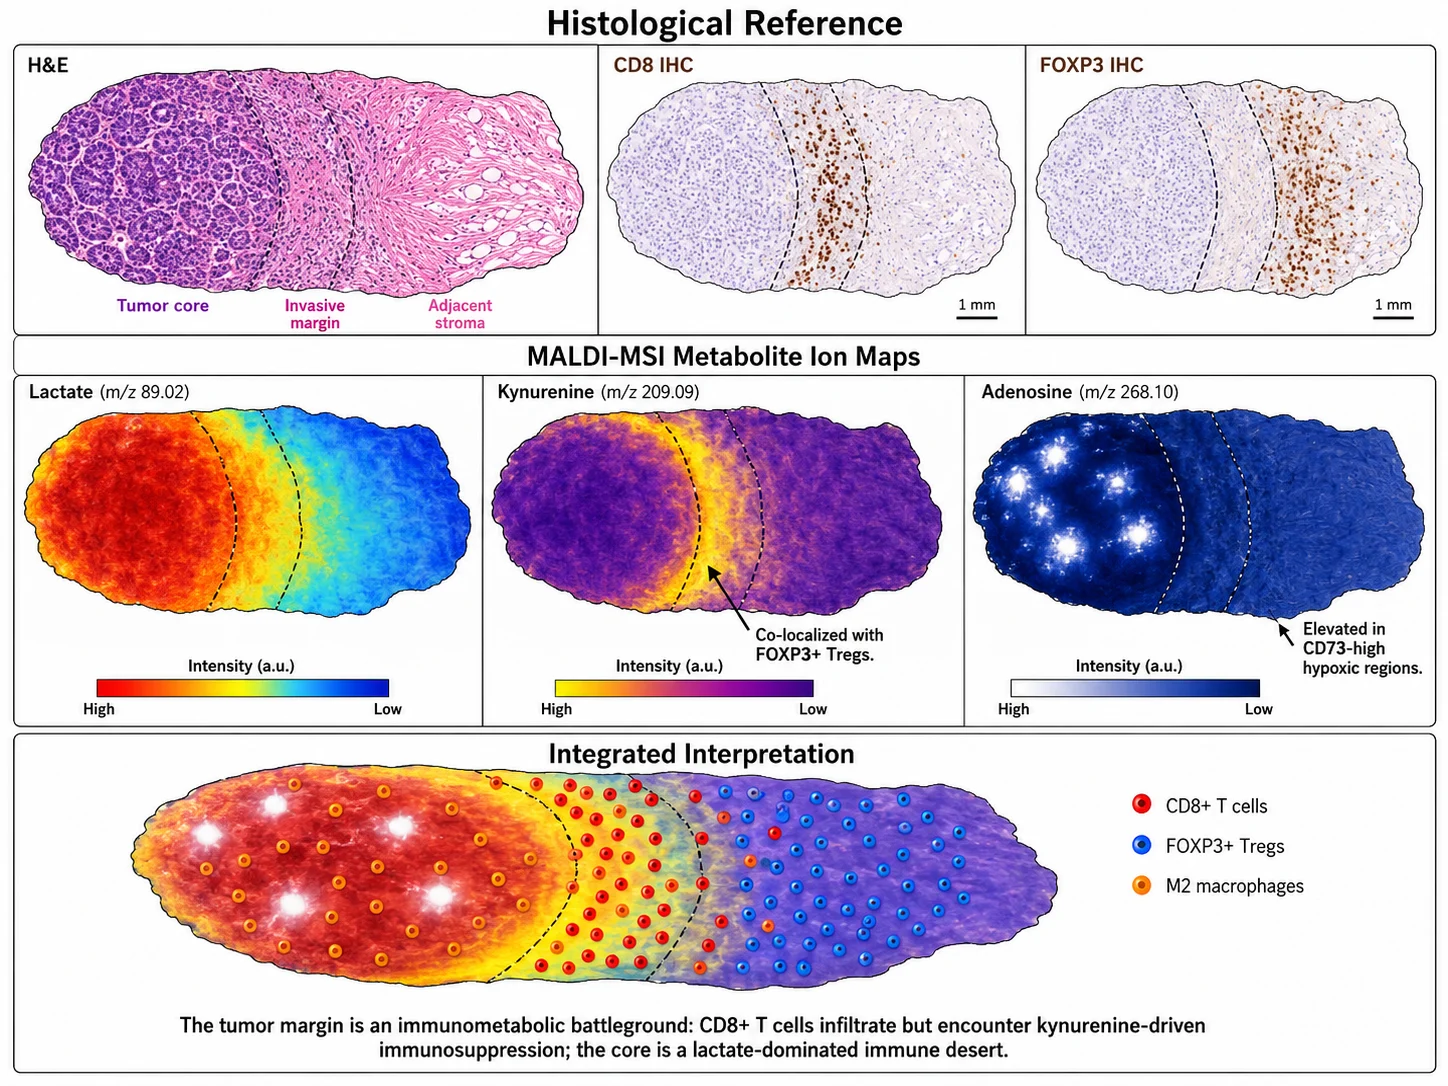 Figure 6: MALDI-MSI of TME metabolic gradients — a representative tumor tissue section with overlaid metabolite ion maps for lactate (core-high), kynurenine (stromal interface), and adenosine (hypoxic zones), with matched H&E and IHC for CD8 and FOXP3
Key TME Spatial Multi-Omics Discoveries (2025-2026)
Metabolic-Immune Spatial Gradients Across Tumor Margins
The tumor-invasive margin has emerged as the most biologically dynamic and clinically informative zone in the TME. A consistent finding across glioblastoma, lung, breast, ovarian, and pancreatic cancers in 2025 is that the margin represents a metabolic transition zone where tumor core glycolysis gives way to OXPHOS and fatty acid oxidation, and where immune infiltration is most intense yet most functionally compromised. Tan et al. (2025) used machine learning to integrate single-cell transcriptomics, spatial transcriptomics, spatial metabolomics, and immunofluorescence in LUAD, finding that lactate-enriched regions showed increased epithelial and fibroblast abundances, reduced T and NK cell infiltration, and endothelial cell angiogenic/stress signatures linked to poor prognosis — demonstrating that metabolic and immune spatial features can be jointly modeled for outcome prediction.
Immunotherapy Response Prediction from Spatial Ecotypes
The 2025-2026 literature establishes that spatial ecotype classification consistently outperforms bulk gene expression signatures for ICB response prediction. In LUAD, ecotype membership was predictive across four independent ICB-treated cohorts, with EC10 (fibroblast TGF-β-driven) uniformly associated with resistance (Lee and Lee, 2025). In HCC, the Salié et al. (2024) spatial immunotypes stratified survival independently of conventional markers. A 2025 deep learning analysis of spatial features from imaging mass cytometry in triple-negative breast cancer predicted treatment response in the NeoTRIP clinical trial, demonstrating that spatial TME features are competitive with and complementary to genomic biomarkers for patient stratification. These findings converge on a principle: the spatial organization of the TME, not just its composition, determines therapeutic outcome. For studies designed to discover spatially informed biomarkers from TME data, see our spatial biomarker discovery and validation article.
Drug Penetration and Metabolic Response: Spatial Pharmaco-TME
A nascent but rapidly growing subfield — spatial pharmaco-TME analysis — uses MALDI-MSI to map drug distribution in tumor tissue alongside the metabolic and transcriptional response to treatment. A 2025 study on palbociclib (CDK4/6 inhibitor) in medulloblastoma integrated MALDI-MSI spatial metabolomics with 10x Visium and Xenium on the same tissue sections, revealing spatially constrained drug resistance linked to metabolic niches at the tumor-brain interface. In 3D colorectal cancer spheroid models, MALDI-MSI combined with spatial proteomics revealed that doxorubicin penetration was limited to outer layers, with the hypoxic core upregulating hundreds of proteins involved in glycolysis, TCA cycle, and lipid synthesis — a spatially constrained metabolic adaptation that conventional bulk analysis would miss entirely. Spatial drug distribution analysis by MSI is increasingly deployed alongside TME profiling to understand why drugs that reach the tumor may still fail to reach every metabolically distinct subregion.
Tertiary Lymphoid Structures: Spatial Multi-Omics Characterization
Tertiary lymphoid structures (TLS) — organized aggregates of B cells, T cells, and dendritic cells that form in non-lymphoid tissues during chronic inflammation and cancer — have emerged as a major determinant of immunotherapy response across tumor types. Spatial multi-omics characterization of TLS in 2025-2026 has revealed their cellular composition, maturation states, and spatial relationship with tumor parenchyma at unprecedented resolution. In NSCLC, a multimodal spatial atlas combining transcriptomics, proteomics, and histology identified two divergent TLS-associated ecosystems: a mature germinal center niche (favorable prognosis) and a tumor-macrophage-fibroblast niche (unfavorable). In glioma, spatial transcriptome and proteome profiling identified three distinct TLS subtypes, with TLS harboring active immune features (clonal T/B cell expansion, IgA+/IgG+ plasma cells) correlated with improved overall survival. In pancreatic cancer, neoadjuvant immunotherapy has been shown to promote the formation of mature, functional intratumoral TLS associated with improved survival, a finding with immediate translational implications. Tumor-immune spatial interaction analysis enables detailed characterization of TLS and other immune structures within their native tissue context.
Experimental Design for TME Spatial Studies
Sample Requirements: Fresh-Frozen for Metabolomics, FFPE-Compatible Options
Sample preparation is the single greatest source of technical variation in spatial TME studies and must be matched to the modality. Fresh-frozen tissue is required for spatial metabolomics (MALDI-MSI, DESI-MSI) because formalin fixation and paraffin embedding remove and chemically modify most small metabolites; lipids are partially retained in FFPE and can be analyzed with established protocols. For spatial transcriptomics, both fresh-frozen (standard Visium) and FFPE (Visium FFPE, Xenium) workflows are available, with FFPE offering compatibility with clinical archives. For spatial proteomics, IMC and MIBI-TOF are compatible with FFPE, while some CODEX protocols are optimized for fresh-frozen. The optimal strategy is to collect fresh-frozen tissue for metabolomics and transcriptomics, with parallel FFPE blocks for spatial proteomics and histological reference — this enables the full multi-omics TME characterization workflow.
Multi-Region Sampling Strategy for Heterogeneous Tumors
Intratumoral heterogeneity is not an incidental feature — it is a defining characteristic of the TME that directly impacts clinical conclusions. The HCC finding that a single immune-enriched region can govern overall survival in an otherwise depleted tumor (Salié et al., 2024) underscores the necessity of multi-region sampling. For resected tumors, sample at minimum the tumor core, invasive margin, and adjacent normal tissue (3 regions); for larger specimens, add at least one geographically distant tumor region. For biopsy-based studies, acknowledge that a single biopsy may misclassify the dominant immune phenotype and, where possible, obtain multiple cores. Multi-region sampling adds cost and analytical complexity but is essential for studies where TME classification is a primary endpoint.
Paired Analysis: Tumor Core vs. Invasive Margin vs. Adjacent Normal
The core-margin-normal triad is the minimal comparative design for spatial TME studies. The tumor core typically shows the highest metabolic activity (glycolysis, nucleotide synthesis), the greatest degree of immune exclusion or depletion, and the worst drug penetration. The invasive margin is the immunological battleground — the site of highest immune infiltration, most active cell-cell communication, and the metabolic transition from glycolysis to OXPHOS. Adjacent normal tissue provides the baseline for defining tumor-specific alterations and, in many cancers, exhibits pre-malignant metabolic and immune changes that are themselves biologically informative. Pairing these three regions within the same patient controls for inter-individual variation and enables within-subject statistical comparisons that are substantially more powerful than cross-sectional tumor-vs-normal designs.
Clinical Cohort Design for Spatial TME Biomarker Studies
For studies aiming to discover or validate spatial TME biomarkers — whether for prognosis, therapy selection, or response prediction — cohort design must account for the unique statistical challenges of spatial data. Pilot phase: n=10-15 per group, focused on establishing spatial signatures and effect sizes. Discovery phase: n=30-50 per group, with multi-region sampling from each specimen and at least two spatial modalities (e.g., spatial transcriptomics + spatial metabolomics). Validation phase: n=50-100+ per group, ideally from an independent cohort or clinical trial with standardized sample collection, using a single validated spatial assay targeting the biomarkers identified in discovery. Throughout, the spatial biomarker discovery workflow should include pre-specified analysis plans, blinded assessment, and orthogonal validation — IHC or in situ hybridization on adjacent sections for 3-5 key markers — before spatial features are considered clinically actionable.
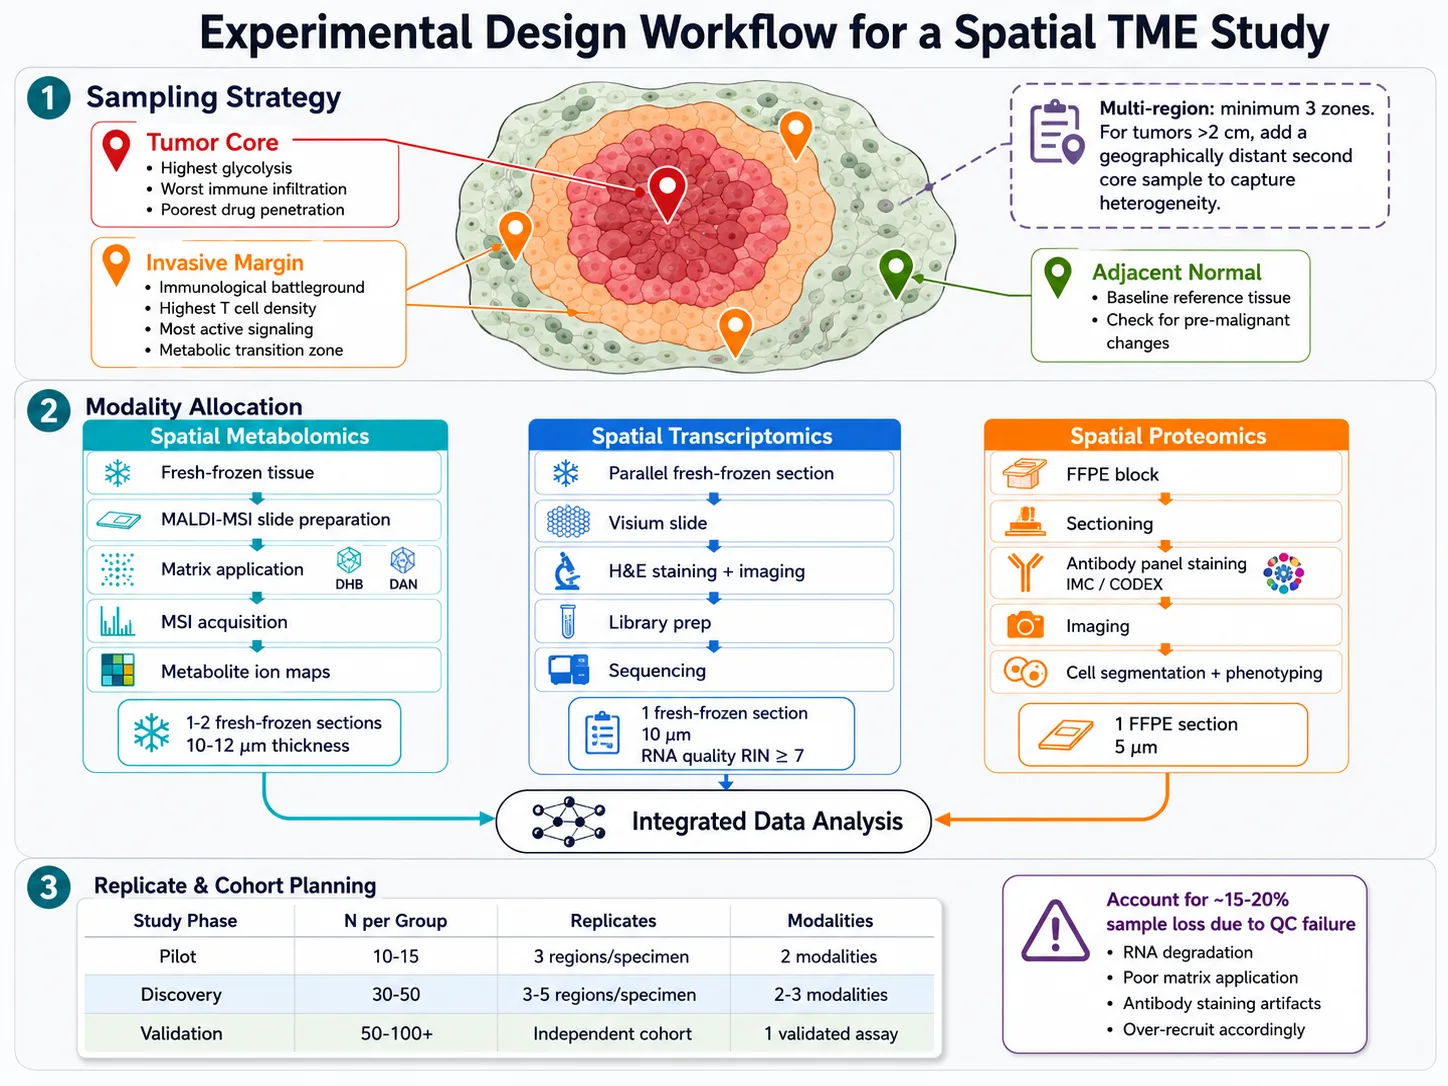 Figure 7: Experimental design for TME spatial study — sampling strategy diagram showing core vs. margin vs. normal regions, modality allocation, and replicate planning
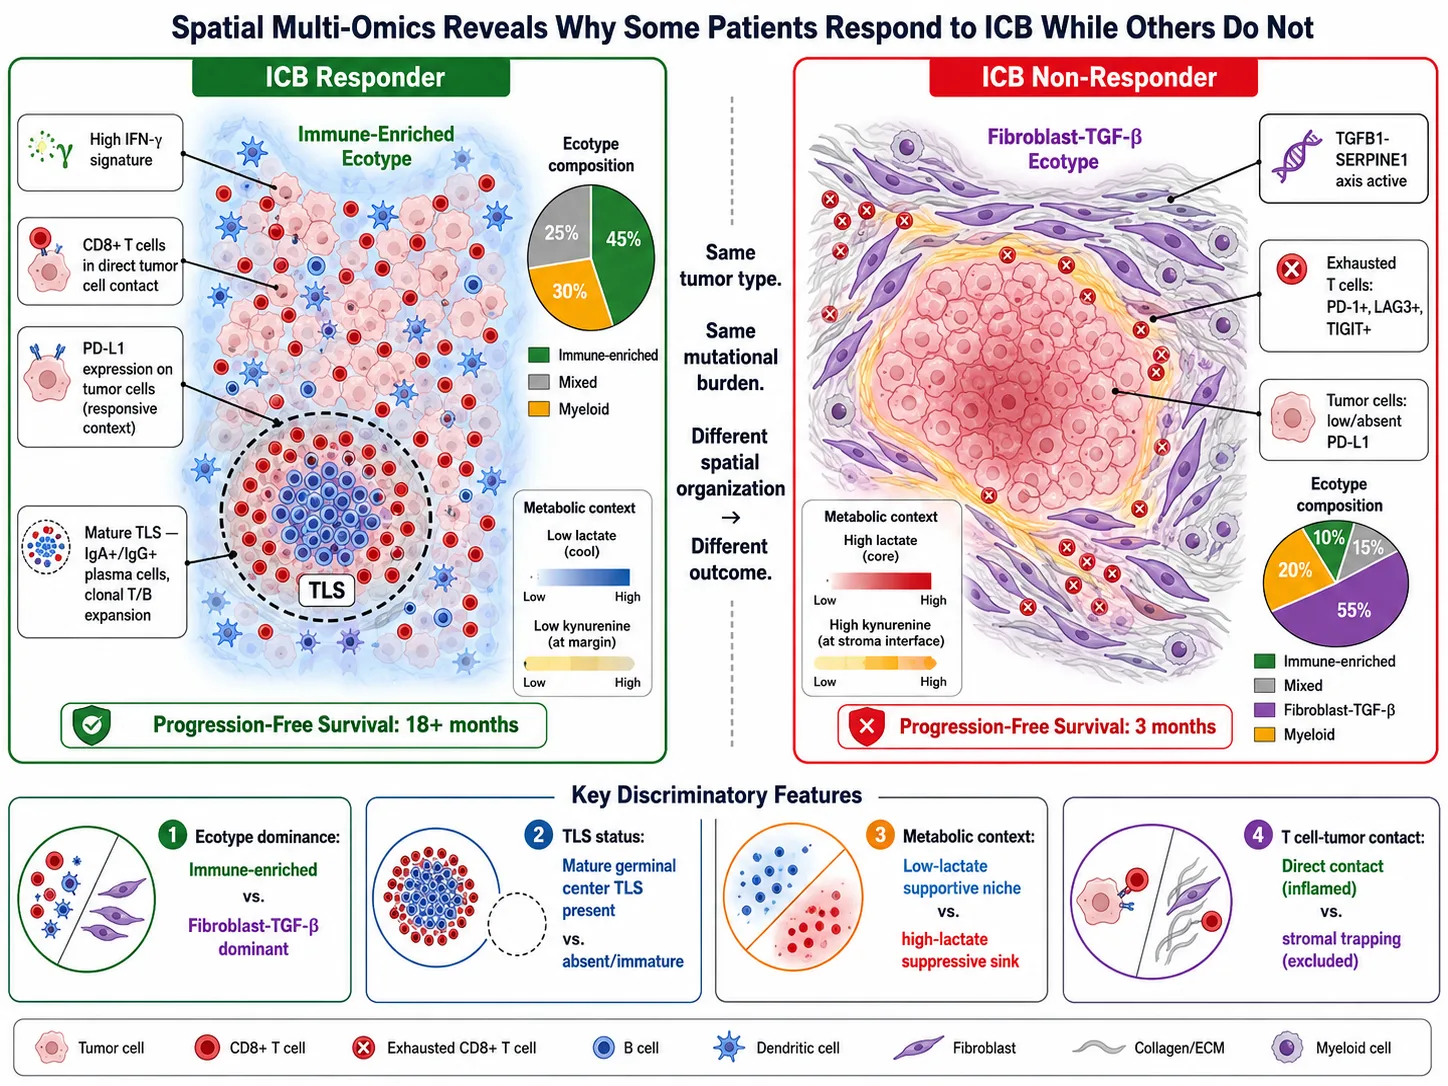 Figure 8: Immunotherapy response prediction from spatial ecotypes — a comparative visualization of responder vs. non-responder TME spatial architectures, highlighting the ecotype features (immune-enriched neighborhoods, TLS presence, metabolic gradients) that distinguish outcomes
FAQ
Which spatial modality should I use for my TME study?
It depends on your primary biological question. For immune cell identity and distribution: spatial transcriptomics (Visium for discovery, Xenium/MERFISH for single-cell resolution). For immune protein marker quantification: spatial proteomics (IMC, CODEX). For metabolic zonation and immunometabolism: spatial metabolomics (MALDI-MSI). For drug distribution and pharmacodynamic response: MALDI-MSI + spatial transcriptomics on the same or serial sections. Most comprehensive TME studies now combine at least two modalities. If budget permits only one, prioritize the modality that matches your primary endpoint — if you need to count and type immune cells, use spatial proteomics; if you need to understand the metabolic environment those immune cells are functioning in, use spatial metabolomics.
Can I use FFPE samples for spatial metabolomics in the TME?
For small polar metabolites (lactate, glucose, amino acids, TCA cycle intermediates), FFPE is not suitable — formalin fixation crosslinks and removes these metabolites, and paraffin embedding involves organic solvents that dissolve lipids. Fresh-frozen tissue is required. For lipid analysis, FFPE sections can be used with established protocols (deparaffinization followed by matrix application), though some lipid classes are partially lost during processing. If your study requires metabolomics and you only have FFPE blocks, consider spatial lipidomics as the metabolically informative layer and supplement with spatial transcriptomics for the gene expression complement. Prospective collection of fresh-frozen tissue alongside FFPE is strongly recommended for TME studies involving metabolomics.
How do spatial ecotypes differ from conventional cell-type proportions?
Cell-type proportions tell you how many cells of each type are present in a sample; spatial ecotypes tell you which cell types are physically adjacent and co-occurring as a functional unit. Two tumors can have identical CD8+ T cell proportions but opposite immunotherapy outcomes if, in one tumor, the T cells are adjacent to antigen-presenting dendritic cells (functional antitumor immunity) and, in the other, they are trapped in a TGF-β-rich fibroblast neighborhood (immune exclusion). Ecotype analysis captures this spatial-context information that proportions alone miss, which is why ecotype membership consistently outperforms bulk composition for clinical outcome prediction.
What is the minimum number of regions I should sample from each tumor?
Three regions — tumor core, invasive margin, and adjacent normal — is the minimum for a spatially informative study. For larger tumors (>2 cm), add at least one geographically distant tumor region to capture heterogeneity. For biopsy-based studies, two to three cores from different regions of the same lesion are recommended, though even this may under-sample the TME heterogeneity. The 2024 HCC IMC study demonstrated that sampling a single region can misclassify the dominant immune phenotype, and that multi-region spatial profiling should be the standard for TME biomarker studies.
How do I integrate spatial metabolomics data with spatial transcriptomics or proteomics data from the same TME sample?
Integration strategies depend on whether the data are from the same section, serial sections, or different samples. Same-section integration (e.g., MALDI-MSI followed by Visium on the same tissue section) provides exact spatial co-registration and is the gold standard, though it requires careful protocol sequencing — the first modality must not damage the tissue for the second. Serial-section integration uses computational image registration (landmark-based or mutual information) to align adjacent sections; this is the most common approach and works well when sections are cut at 10 μm intervals. For cross-platform or cross-sample integration, tools such as SpatialCOC, SMART, and SpatialFuser provide frameworks for aligning data without exact spatial correspondence. See our integrated spatial multi-omics frameworks article for a comprehensive guide to computational integration methods.
References:
- Chang W, Li K, Huang P. Integrative Spatial Multi-Omics Reveals the Tumor Ecosystem: From Mechanistic Insights to Therapeutic Strategies. iScience 2026;29(7):116349. DOI: 10.1016/j.isci.2026.116349
- Chen S, Zhang Y, Li X, Zhang Y, Zeng Y. Driving Innovations in Cancer Research Through Spatial Metabolomics: A Bibliometric Review of Trends and Hotspot. Front Immunol 2025;16:1589943. DOI: 10.3389/fimmu.2025.1589943
- Luca BA, Steen CB, Matusiak M, Azizi A, Varma S, Zhu C, et al. Atlas of Clinically Distinct Cell States and Ecosystems Across Human Solid Tumors. Cell 2021;184(21):5482-5496.e28. DOI: 10.1016/j.cell.2021.09.014
- Zheng S, Wang W, Shen L, Yao Y, Xia W, Ni C. Tumor Battlefield Within Inflamed, Excluded or Desert Immune Phenotypes: The Mechanisms and Strategies. Exp Hematol Oncol 2024;13:80. DOI: 10.1186/s40164-024-00543-1
- Wang ZB, Long MH, Yu P, et al. Spatial Profiling of the Metabolism-Immune Axis in Ovarian Cancer. Front Pharmacol 2026;16:1672020. DOI: 10.3389/fphar.2025.1672020
- Hartmann FJ. Spatial Immunometabolism: Integrating Technologies to Decode Cellular Metabolism in Tissues. Eur J Immunol 2025;55(11):e70094. DOI: 10.1002/eji.70094
- Salié H, Wischer L, D'Alessio A, Godbole I, Suo Y, Otto-Mora P, et al. Spatial Single-Cell Profiling and Neighbourhood Analysis Reveal the Determinants of Immune Architecture Connected to Checkpoint Inhibitor Therapy Outcome in Hepatocellular Carcinoma. Gut 2024;74(3):451-466. DOI: 10.1136/gutjnl-2024-332837
- Lee SY, Lee Y. Fibroblast TGF-β Signaling Defines Spatial Tumor Ecosystems Linked to Immune Checkpoint Blockade Resistance. Commun Biol 2025;8:1730. DOI: 10.1038/s42003-025-09087-4
- Tan Y, Tan W, Liang Y, Long Y, Chen S, Hu Q, et al. Machine Learning-Enabled Spatial Multi-Omics Uncovers Lactate-Driven Targets and Tumor Microenvironmental Reprogramming in Cancer. npj Digit Med 2025;8:686. DOI: 10.1038/s41746-025-02286-7
- Kim H, Choi JH, Lim Y, Yoon SJ, Jang KT, Ock CY, et al. Artificial Intelligence-Powered Spatial Analysis of Immune Phenotypes in Resected Pancreatic Cancer. JAMA Surg 2025;160(8):884-892. DOI: 10.1001/jamasurg.2025.1999
















