

Spatial biology has transformed how we discover biomarkers — no longer from homogenized tissue lysates that average away spatial information, but from precisely mapped molecular coordinates that preserve which molecules are expressed, where they localize, and which cells they neighbor. Yet the gap between a list of differentially abundant m/z features from a MALDI-MSI experiment and a clinically deployable biomarker assay remains wide, and the majority of spatial biomarker studies stop at the discovery phase. This article provides a practical, end-to-end framework for spatial biomarker development: from multi-modal discovery through candidate prioritization, orthogonal validation across independent platforms, and the emerging role of AI-enabled virtual spatial omics in accelerating each step. We focus on the 2025-2026 evidence base and emphasize actionable experimental design principles that bridge the gap between spatial discovery data and a validated biomarker ready for clinical translation.
The Spatial Biomarker Pipeline — From Discovery to Clinical Relevance
Why Spatial Context Matters for Biomarker Discovery
Conventional biomarker discovery workflows — bulk tissue homogenization followed by LC-MS/MS or RNA-seq — destroy tissue architecture and average molecular signals across heterogeneous cell populations. A metabolite that is highly abundant in the tumor-invasive margin but absent from the tumor core may appear at moderate abundance in bulk analysis and be discarded as uninteresting. A protein that is selectively expressed at the interface between CD8+ T cells and tumor cells may be a potent immune checkpoint regulator, but this spatial relationship is invisible in dissociated tissue. Spatial omics technologies — spatial metabolomics, spatial proteomics, and spatial transcriptomics — solve these problems by preserving the tissue coordinates of every molecular measurement, enabling biomarker discovery that is inherently spatially resolved. This spatial context is especially critical for tumor microenvironment biomarkers, where the functional significance of a molecule depends critically on its location relative to tumor cells, immune infiltrates, and stromal compartments. For a comprehensive overview of TME spatial profiling strategies, see our article on spatial tumor microenvironment profiling.
The Four-Stage Biomarker Pipeline
The spatial biomarker pipeline can be organized into four sequential stages, each with distinct goals, technologies, and deliverables. Stage 1 — Discovery: Multi-modal spatial screening generates hundreds to thousands of candidate features (metabolites, proteins, transcripts, lipids) that differ between conditions of interest (e.g., tumor vs. normal, responder vs. non-responder). Stage 2 — Candidate Prioritization: Statistical filtering, biological contextualization, and machine learning-based feature selection narrow the candidate list to 10-30 high-priority targets that are spatially robust and biologically interpretable. Stage 3 — Orthogonal Validation: Each candidate is confirmed using an independent analytical platform (e.g., MALDI-IHC, multiplexed immunofluorescence, targeted LC-MS/MS on laser-microdissected regions) applied to an independent sample cohort, ensuring that the signal is real and not a platform artifact. Stage 4 — Clinical Translation: Validated biomarkers are converted into assays compatible with routine clinical pathology workflows — typically IHC, chromogenic in situ hybridization (CISH), or targeted multiplex IF panels on FFPE sections. The entire pipeline, from tissue to clinically actionable biomarker, is the subject of this article (Goossen et al., 2025; Horvath and Coscia, 2025).
Discovery Phase — Multi-Modal Spatial Screening
MALDI-MSI as the Primary Untargeted Discovery Engine
Untargeted MALDI mass spectrometry imaging (MALDI-MSI) is the most versatile discovery tool in the spatial biomarker arsenal. It detects hundreds to thousands of molecular features — lipids, metabolites, peptides, and small proteins — directly from tissue sections at 5-100 μm spatial resolution without requiring prior knowledge of target identity. Unlike antibody-based spatial methods, which are limited to 20-60 pre-selected protein targets, MALDI-MSI can discover entirely unanticipated biomarkers. In the 2025 SIMO (Single-Section Integrative Multi-Omics) workflow, a single tissue section yielded approximately 60 imaged lipids, approximately 60 imaged metabolites, and over 5,000 region-specific proteins when MALDI-MSI was combined with laser microdissection and LC-MS/MS — all from the same tissue slice (Hau et al., 2026). This single-section capability eliminates the alignment errors inherent in serial-section multi-omics and represents the current state of the art for integrated spatial discovery. For lipid-focused discovery, MALDI imaging lipidomics provides complementary coverage of the tissue lipidome, which is particularly informative for metabolic and immune biomarkers.
Integrating Spatial Transcriptomics and Spatial Proteomics for Multi-Omic Discovery
While MALDI-MSI excels at unbiased molecular discovery, its metabolite annotation rates remain low (5-15% of features identified) and it does not directly provide cell-type context — a m/z feature at a coordinate tells you what is present, but not which cell type produced it. Integrating MALDI-MSI with spatial transcriptomics and multiplexed spatial proteomics addresses both limitations. Spatial transcriptomics (Visium, Xenium, MERFISH) provides cell-type identity and pathway-level gene expression at each coordinate, while imaging mass cytometry or CODEX provides 40-60 protein markers with single-cell resolution. The 2025-2026 literature has converged on a best-practice discovery design: untargeted MALDI-MSI for molecular feature discovery on fresh-frozen tissue, complemented by spatial proteomics on adjacent FFPE sections for cell-type annotation, with computational co-registration of both datasets to the same histological reference — an approach comprehensively reviewed by Chang et al. (2026) in their survey of the spatial multi-omics technology and integration landscape. The same-section MALDI-MSI + Xenium workflow — demonstrated in mouse brain and human glioblastoma — achieved pixel-scale co-registration and enabled per-cell multi-omics, though a ~30% transcript count reduction after MALDI matrix application must be accounted for in experimental design.
Practical Considerations for Multi-Modal Discovery Studies
Discovery-phase sample requirements: fresh-frozen tissue for MALDI-MSI metabolomics and lipidomics (FFPE processing removes most small metabolites), with parallel FFPE blocks for spatial proteomics and histological reference. For spatial transcriptomics, the choice of Visium (55 μm spot resolution, whole-transcriptome) vs. Xenium/MERFISH (single-cell resolution, targeted gene panels) depends on whether discovery breadth or spatial resolution is prioritized — Visium for broad pathway-level discovery, Xenium or MERFISH for resolving cell-type-specific expression at single-cell resolution. Minimum cohort size for discovery: n=10-15 per group, with multi-region sampling (core, margin, normal) from each specimen. Bioinformatics analysis support is essential for cross-modality data alignment, feature extraction, and statistical analysis at this stage. For a more detailed guide to the underlying computational frameworks, see our article on spatial cell-type deconvolution methods and our comprehensive guide to spatial metabolomics.
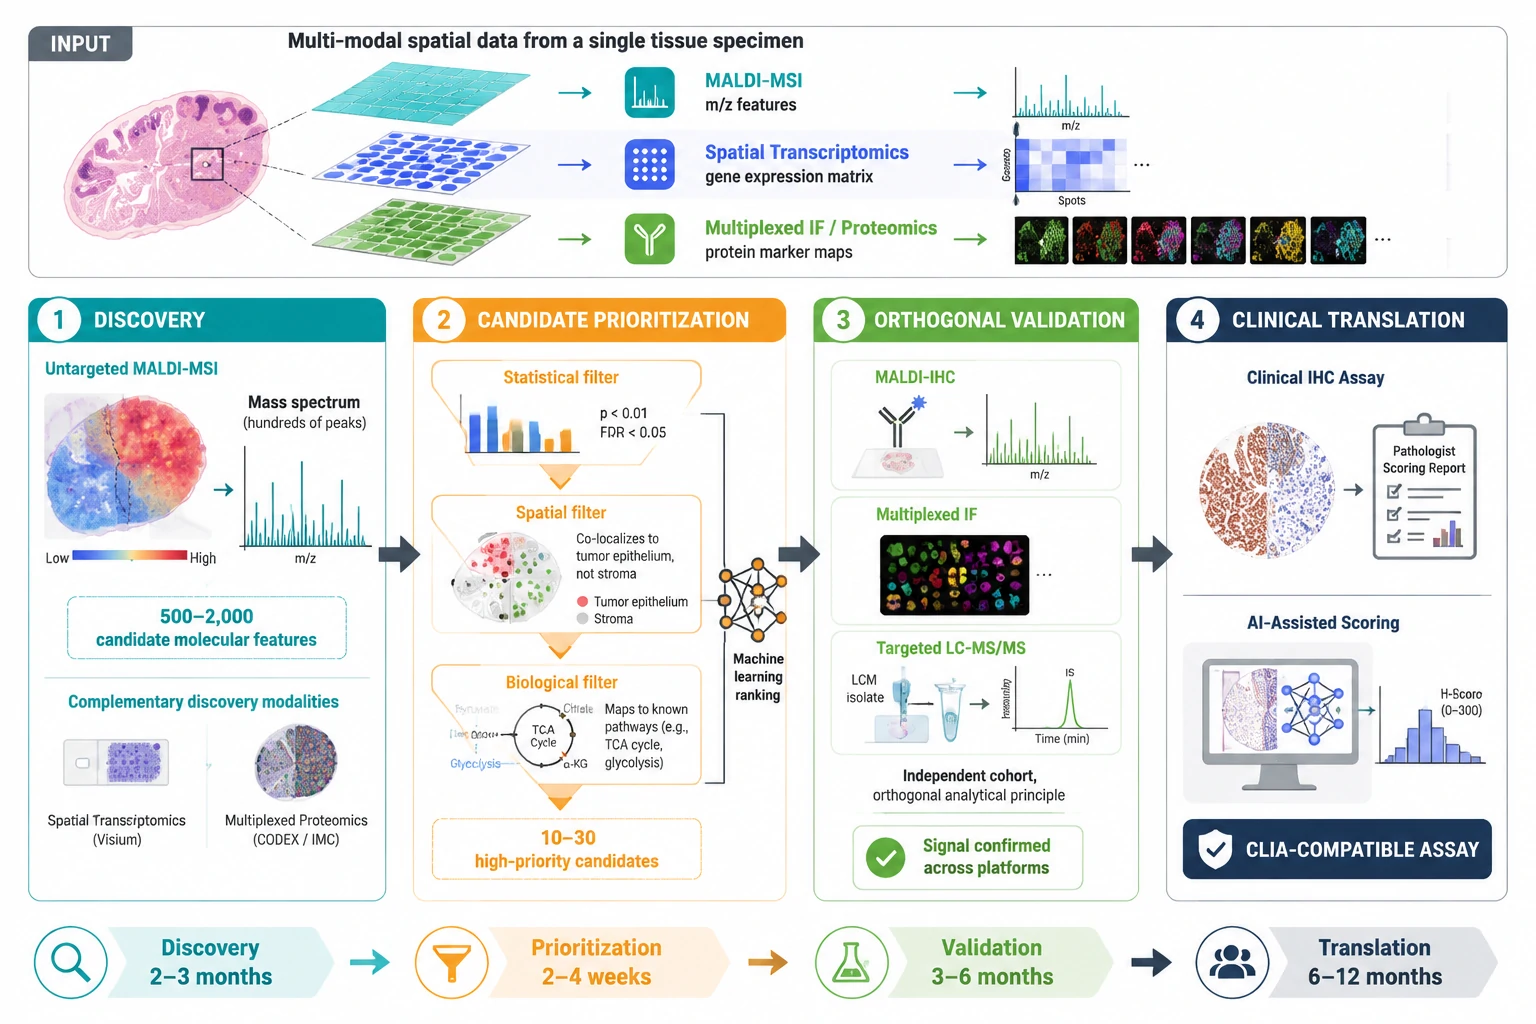 Figure 1: The spatial biomarker discovery pipeline — four sequential stages from multi-modal discovery through clinical translation, with key technologies and deliverables at each stage
Candidate Selection and Prioritization
From Thousands of Features to a Short List: Statistical and Biological Filters
A typical untargeted MALDI-MSI discovery experiment detects 500-2,000 molecular features per tissue section. Most are not biomarkers — they are background ions, matrix adducts, technical artifacts, or genuinely expressed molecules that do not differ between conditions. Shrinking this list to the 10-30 candidates worth investing in for orthogonal validation requires a structured prioritization cascade. The first filter is statistical: features must show statistically significant differential abundance between conditions (adjusted p < 0.05 after multiple testing correction), with spatial coherence — the differential effect must be reproducible across multiple tissue regions and biological replicates, not driven by a single atypical pixel or section. The second filter is effect size: fold-changes should be at least 1.5-2.0 between conditions, and the spatial distribution of the feature should co-localize with a histologically or biologically relevant tissue compartment (e.g., tumor epithelium, immune infiltrate, necrotic core), not diffuse background. The third filter is biological plausibility: candidate metabolites should map to pathways relevant to the disease biology, and candidate proteins should have known or inferred functional roles compatible with the phenotype under study.
Machine Learning-Driven Feature Selection and Spatial Pattern Recognition
Machine learning methods are increasingly used to augment statistical filtering for spatial biomarker prioritization. Unsupervised approaches — principal component analysis (PCA), non-negative matrix factorization (NMF), self-organizing maps (SOM) — reduce the dimensionality of MSI data while preserving spatial structure, identifying molecular components that co-vary across tissue regions and correspond to histological features. Supervised approaches — random forest classifiers, support vector machines, LASSO regression — rank features by their ability to discriminate between conditions, providing a quantitative importance score for each candidate. In the MSIght platform (Fields et al., 2025), an open-source Python pipeline, MALDI-MSI features are linked to LC-MS/MS-based peptide identifications and co-registered with H&E histology, enabling pathologists to assess whether a candidate biomarker localizes to the expected histological compartment — a critical sanity check before advancing to validation. The DVSTP framework applied to colorectal cancer used H&E-image-based deep learning to predict spatial protein expression, identifying SRSF6 as a top-1% heterogeneity marker whose high expression spatially correlated with CD4+ and CD8+ T cell exclusion — a finding confirmed by functional knockdown experiments (Lei et al., 2026). This exemplifies the ideal prioritization outcome: a candidate biomarker with strong statistical support, clear spatial localization, plausible biological mechanism, and initial functional validation.
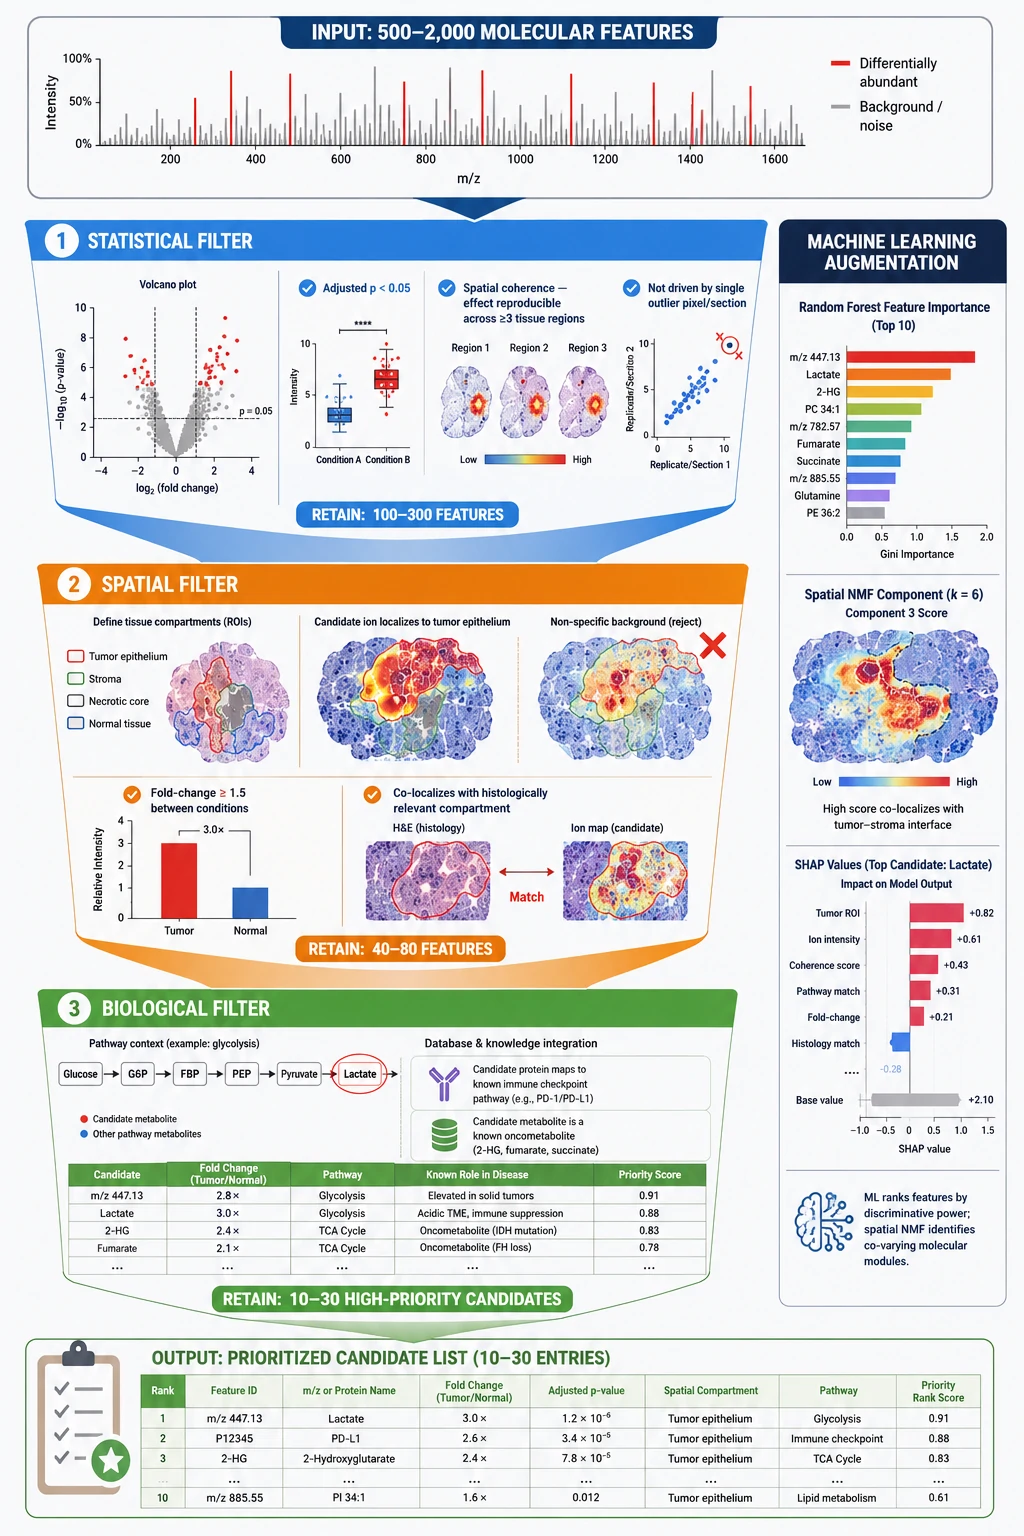 Figure 2: Candidate prioritization cascade — from hundreds of MALDI-MSI features through statistical, spatial, and biological filters to a short list of 10-30 validated biomarker candidates, with machine learning integration
Orthogonal Validation — Multi-Platform Verification
The Orthogonal Validation Principle
The central principle of orthogonal validation is that a true biomarker should be detectable by at least two independent analytical platforms, ideally operating on different physicochemical principles, applied to an independent sample cohort. If MALDI-MSI identifies a metabolite as elevated in tumor vs. normal tissue, and targeted LC-MS/MS on laser-microdissected regions from a different patient cohort confirms the same elevation, the finding is unlikely to be a MALDI matrix effect, an ionization artifact, or a batch-specific false positive. Three tiers of evidence strength define the validation hierarchy: Tier 1 — Technical Replication: the same platform, same samples, different sections — confirms within-platform reproducibility. Tier 2 — Orthogonal Platform Validation: different platform operating on a different analytical principle (e.g., MALDI-MSI + multiplexed IHC/IF; untargeted MSI + targeted LC-MS/MS on LCM isolates) — confirms that the signal is not a platform artifact. Tier 3 — Independent Cohort Validation: the validated assay applied to an independent patient cohort, ideally from a different institution — confirms that the biomarker generalizes beyond the discovery cohort. Only when all three tiers are satisfied should a spatial biomarker be considered clinically actionable (Horvath and Coscia, 2025).
MALDI-IHC: Built-In Orthogonal Validation on the Same Tissue Section
The most rigorous orthogonal validation design available in 2025-2026 combines untargeted MALDI-MSI with targeted MALDI-IHC (immunohistochemistry with photocleavable mass-tagged antibodies) on the same tissue section. In this workflow, untargeted MALDI-MSI is performed first for discovery, then the MALDI matrix is washed off, and mass-tagged antibodies against the candidate protein biomarkers are applied and imaged on the same instrument — providing exact spatial co-registration between discovered molecular features and validated protein targets. Crucially, the 2025 single-cell study by Krestensen et al. demonstrated that prior MALDI-MSI measurement and matrix removal had no significant effect on subsequent MALDI-IHC ion intensities, formally validating the sequential same-section workflow for glioblastoma single cells (Krestensen et al., 2025). At the tissue level, a 2025 SITC presentation demonstrated a combined MALDI-MSI + MALDI-IHC + MALDI-ISH workflow detecting 646 biomarkers (lipids, proteins, transcripts) from a single lung cancer TMA section on a single instrument — a level of multi-omic integration that exemplifies the orthogonal validation concept in practice.
Practical Orthogonal Validation Designs
The optimal validation design depends on the biomarker class. For metabolite biomarkers discovered by MALDI-MSI, the gold-standard orthogonal validation is targeted LC-MS/MS on laser-microdissected (LCM) tissue regions from serial sections of independent specimens — this confirms both molecular identity (via retention time and fragmentation matching) and abundance difference. For protein biomarkers, validation starts with multiplex IHC or immunofluorescence (mIHC/IF) on FFPE sections from an independent cohort, ideally using two independent antibody clones targeting different epitopes of the same protein to rule out antibody cross-reactivity. For lipid biomarkers, validation uses targeted MRM-based LC-MS/MS on lipid extracts from LCM tissue isolates, with stable isotope-labeled internal standards for absolute quantification. For the most rigorous protein biomarker validation — particularly when translating to clinical assays — standard monoplex IHC remains the accepted clinical reference method, and MALDI-IHC results should be benchmarked against it.
Cross-Platform Data Integration Tools
Several computational tools have emerged in 2025 to facilitate cross-platform spatial data integration for validation studies. MSIght (Fields et al., 2025) automates the co-registration of H&E histology with MALDI-MSI data and integrates LC-MS/MS peptide identifications from serial sections to confirm MSI annotations, all within a Jupyter notebook interface accessible to users with basic Python familiarity. The Goossen et al. (2025) review comprehensively catalogs emerging platforms including tissue-expansion strategies, LCM-microPOTS (microscale proteomic sample processing from laser-microdissected tissue), and machine learning-based pixel classification that maps each tissue coordinate to a molecularly defined tissue type for cross-platform comparison. For studies that require integrated spatial multi-omics analysis, these computational frameworks are essential — manual cross-platform comparison is infeasible at the scale of modern spatial datasets.
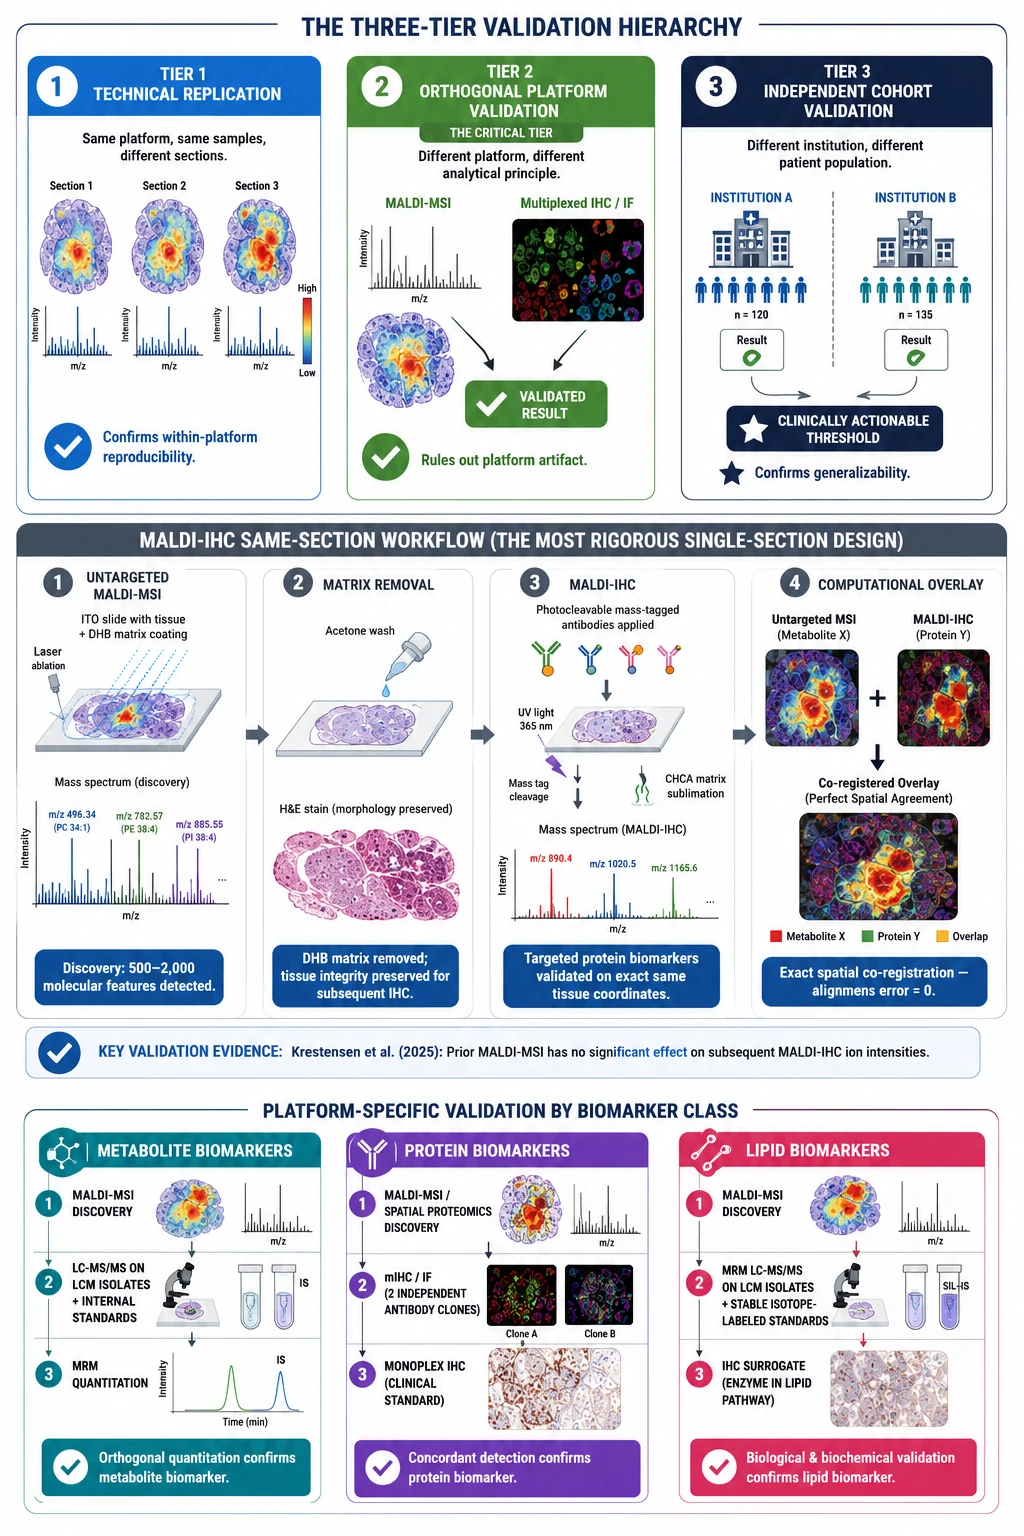 Figure 3: Orthogonal validation design — the three-tier validation hierarchy (technical replication, orthogonal platform, independent cohort) combined with the MALDI-IHC same-section workflow: untargeted MALDI-MSI for discovery followed by targeted MALDI-IHC on the same tissue section, with platform-specific strategies for metabolite, protein, and lipid biomarkers
AI-Enabled Virtual Spatial Omics — The 2025-2026 Breakthrough
From H&E to Virtual Spatial Proteomics: The Concept
The most transformative development in spatial biomarker research in 2025-2026 is the emergence of AI models that predict spatially resolved protein expression directly from routine H&E-stained histopathology slides — effectively generating "virtual spatial proteomics" at near-zero marginal cost. These models are trained on paired datasets where the same tissue section has been imaged by both H&E and a multiplexed protein imaging platform (CODEX, mIF, or mass spectrometry-based proteomics). Once trained, the model can infer protein expression maps from H&E images alone, without requiring any specialized reagents or instruments. Because every cancer patient already has an H&E slide as part of standard diagnostic pathology, this technology has the potential to democratize spatial biomarker analysis — turning every archived clinical slide into a potential spatial proteomics dataset. Three landmark studies in 2025-2026 define the current state of the art.
HEX: Virtual Spatial Proteomics for Lung Cancer Biomarker Discovery
The HEX (H&E-to-protein expression) model from Stanford University, published in Nature Medicine (Li et al., 2026), was trained on 819,000 H&E image tiles paired with 40-plex CODEX protein expression data from 382 tumor samples. Using a pathology foundation model (MUSK) backbone with feature distribution smoothing and adaptive loss, HEX predicts 40 immune, structural, and functional protein biomarkers from H&E, achieving an average Pearson correlation of 0.79 with measured CODEX data and a structural similarity index (SSIM) of 0.95 against ground truth. In external pan-cancer validation across 206 samples from 34 tissue types with different staining protocols and scanners, HEX achieved a Pearson r of 0.66 without any fine-tuning — evidence of robust generalization. The companion MICA framework, which fuses original H&E morphology with HEX-predicted virtual CODEX features, improved prognosis prediction by 22% and immunotherapy response prediction by 24-39% across six independent NSCLC cohorts totaling 2,298 patients, substantially outperforming PD-L1 (AUC 0.66) and tumor mutational burden (AUC 0.59).
GigaTIME: Population-Scale Virtual Tumor Microenvironment Profiling
GigaTIME (Valanarasu et al., 2026, Cell), a collaboration between Microsoft Research, Providence Health, and the University of Washington, was trained on 40 million cells with paired H&E and 21-plex mIF data. Applied to 14,256 patients from 51 hospitals across 7 US states, GigaTIME generated 299,376 virtual mIF slides spanning 24 cancer types and 306 subtypes, uncovering 1,234 significant protein-biomarker associations with staging, survival, and molecular subtypes. Independent validation on 10,200 TCGA patients achieved a Spearman correlation of 0.88 between virtual and measured protein expression, and the method outperformed CycleGAN on 15 of 21 protein channels. This study demonstrates that virtual spatial proteomics can operate at population scale — a capability that experimental spatial proteomics, constrained by throughput and cost (~$1,500 per mIF test vs. $20-50 for H&E), cannot match.
TileDVP: Mass Spectrometry-Grade Proteome Prediction from H&E
TileDVP (Mathian et al., 2026) addresses a distinct challenge: predicting mass spectrometry-derived protein expression rather than antibody-based protein measurements. Using a high-throughput tile-level MS proteomics pipeline paired with H&E images from gastric cancer biopsies, TileDVP demonstrated that tumor regions were enriched for clinically relevant proteins including HMGB1, LGALS3 (Galectin-3), and ERBB2 (HER2) — proteins with established roles as prognostic markers and therapeutic targets. Unlike HEX and GigaTIME, which predict a fixed antibody panel restricted to 21-40 targets, the TileDVP approach lays the groundwork for predicting thousands of proteins from H&E — a foundation model vision that would truly unlock the proteomic information latent in routine pathology images.
Limitations and Practical Guidance
Despite their transformative potential, virtual spatial omics models have important limitations that must be understood before they can be incorporated into biomarker validation workflows. They predict, rather than measure, protein expression — prediction errors at the level of individual cells or tissue microdomains may be clinically consequential, and the regulatory framework for AI-predicted biomarkers in clinical decision-making does not yet exist. Performance varies by protein subcellular localization (nuclear and cytoplasmic proteins are predicted more accurately than membrane proteins) and degrades when applied to tissue types, staining protocols, or scanner platforms not represented in training data. The DVSTP study (Lei et al., 2026) found an average Spearman correlation of only 0.37 between mRNA and protein levels in colorectal cancer — underscoring that protein abundance cannot be reliably inferred from transcript-level data and that virtual proteomics models must be trained on proteomic, not transcriptomic, ground truth. For the foreseeable future, virtual spatial omics is best deployed as a screening tool to prioritize candidate biomarkers for experimental validation — not as a replacement for direct measurement.
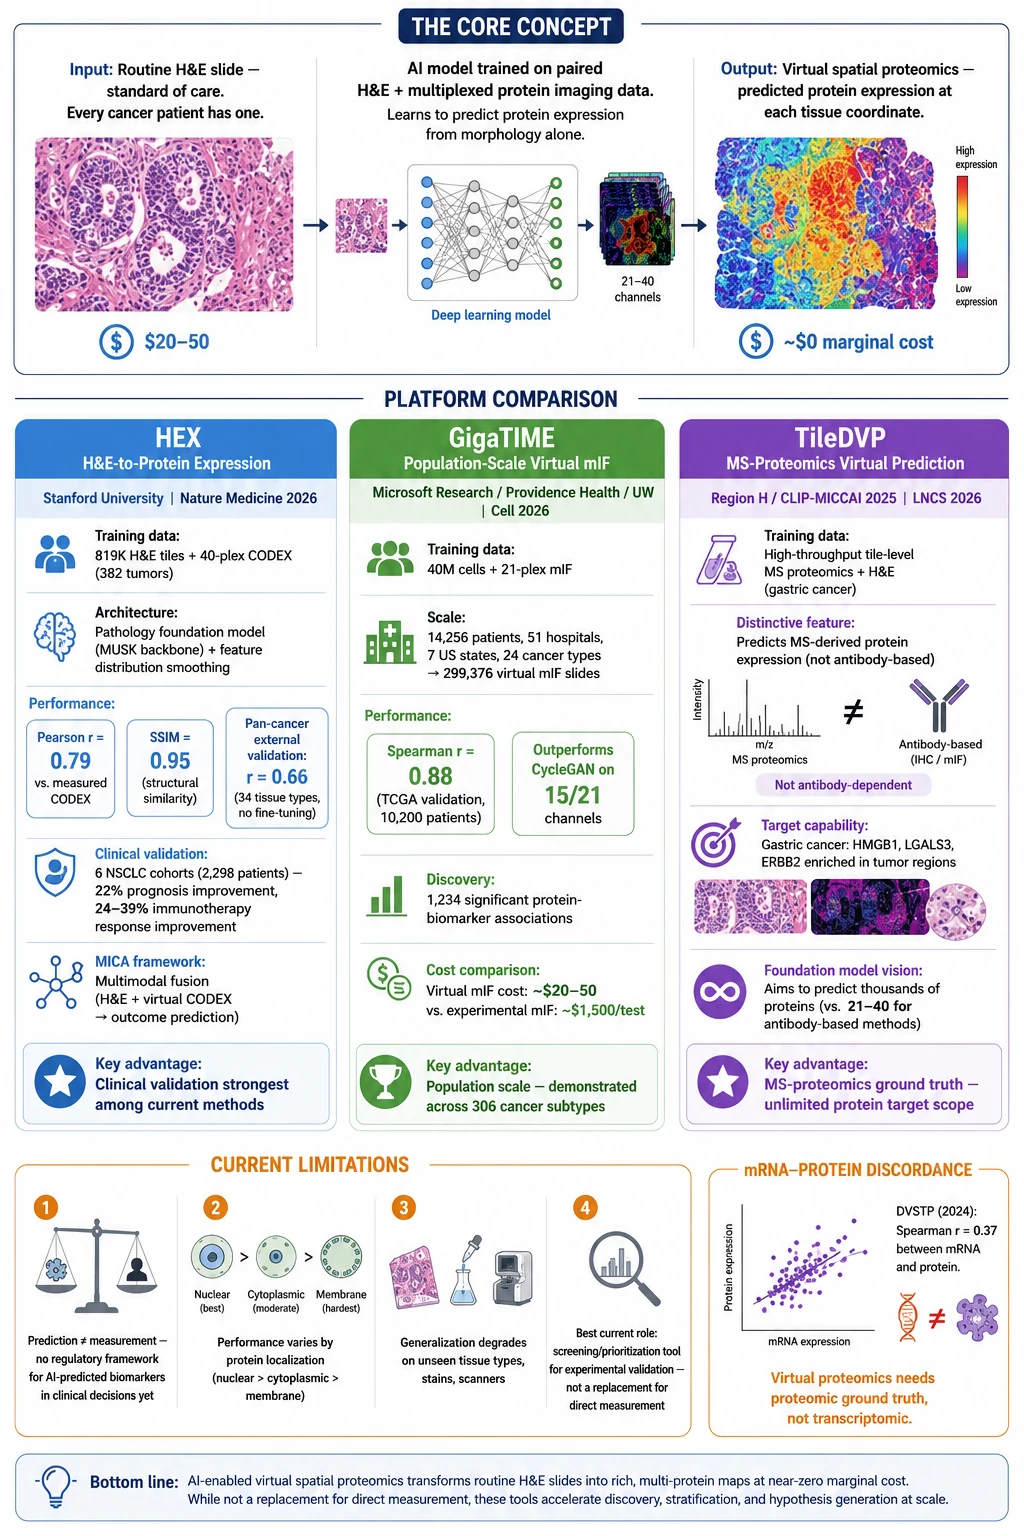 Figure 4: AI-enabled virtual spatial omics — H&E input to virtual protein expression output, comparing three leading platforms (HEX, GigaTIME, TileDVP) with training data, predicted analytes, performance metrics, and clinical validation status
From Spatial Biomarker to Clinical Assay
The Translational Cascade: MSI Discovery to IHC Deployment
The translational trajectory from a MALDI-MSI-discovered biomarker to a clinical-grade assay follows a well-defined cascade. A metabolite biomarker (m/z feature with differential spatial abundance) is identified by tandem MS/MS and/or matched to an LC-MS/MS library, then a targeted LC-MS/MS assay with a stable isotope-labeled internal standard is developed for absolute quantification in tissue extracts. A protein biomarker identified by MALDI-MSI or spatial proteomics is confirmed by MALDI-IHC, then a monoplex or duplex IHC assay using a clinically validated antibody is developed on FFPE sections — the same format pathologists use for HER2, ER, PR, and PD-L1 scoring. A lipid biomarker discovered by MALDI-MSI is validated by targeted MRM-based LC-MS/MS on LCM isolates, and if a suitable antibody exists against an enzyme in the lipid's biosynthetic pathway, an IHC surrogate marker can be developed. Throughout this cascade, the key principle is that each step reduces multiplexing capacity while increasing clinical compatibility — from untargeted discovery (thousands of features, research-grade) to a single or dual-marker clinical assay (one to two markers, CLIA/CAP-compatible).
Cohort Design for Clinical Validation Studies
Clinical validation of a spatial biomarker requires a fundamentally different study design than discovery. Validation cohorts must be adequately powered for the intended clinical endpoint: n=50-100+ per group for prognostic biomarkers, n=80-150+ per group for predictive biomarkers (treatment effect modification), all with pre-specified analysis plans, blinded assessment, and independent replication in an external cohort whenever possible. Specimen collection must follow standardized protocols (cold ischemia time ≤ 30 minutes for metabolomics, standardized fixation time for IHC), and the biomarker assay must demonstrate acceptable analytical performance (intra- and inter-assay CV < 15%, inter-operator reproducibility, lot-to-lot reagent consistency). The analytical validation should compare the spatial biomarker assay against the current clinical gold standard for the same intended use — for example, a novel spatial immune exclusion biomarker for immunotherapy response prediction should be benchmarked against PD-L1 IHC. The translational trajectory and regulatory pathway for spatial biomarkers have been comprehensively reviewed by Horvath and Coscia (2025), who emphasize that the most efficient path to clinical adoption is often through surrogate IHC markers that can be scored by pathologists using existing workflows and scoring systems.
The Role of Digital Pathology and AI in Clinical Deployment
Digital pathology infrastructure and AI-based image analysis tools are increasingly bridging the gap between spatial biomarker research and clinical deployment. Whole-slide imaging enables computational analysis of IHC-stained slides at scale, and AI-based quantification of biomarker expression — already FDA-approved for PD-L1 and Ki-67 scoring in certain indications — provides objective, reproducible readouts that are essential for biomarker standardization across laboratories. For spatial biomarkers, where the relevant readout is often a spatial relationship (e.g., CD8+ T cell density within 20 μm of tumor cells) rather than a bulk expression level, AI-based spatial analysis is not merely a convenience — it is a necessity. Spatial biomarker discovery and validation services that incorporate AI-driven image analysis can accelerate the transition from research-grade spatial data to a validated, deployable clinical assay.
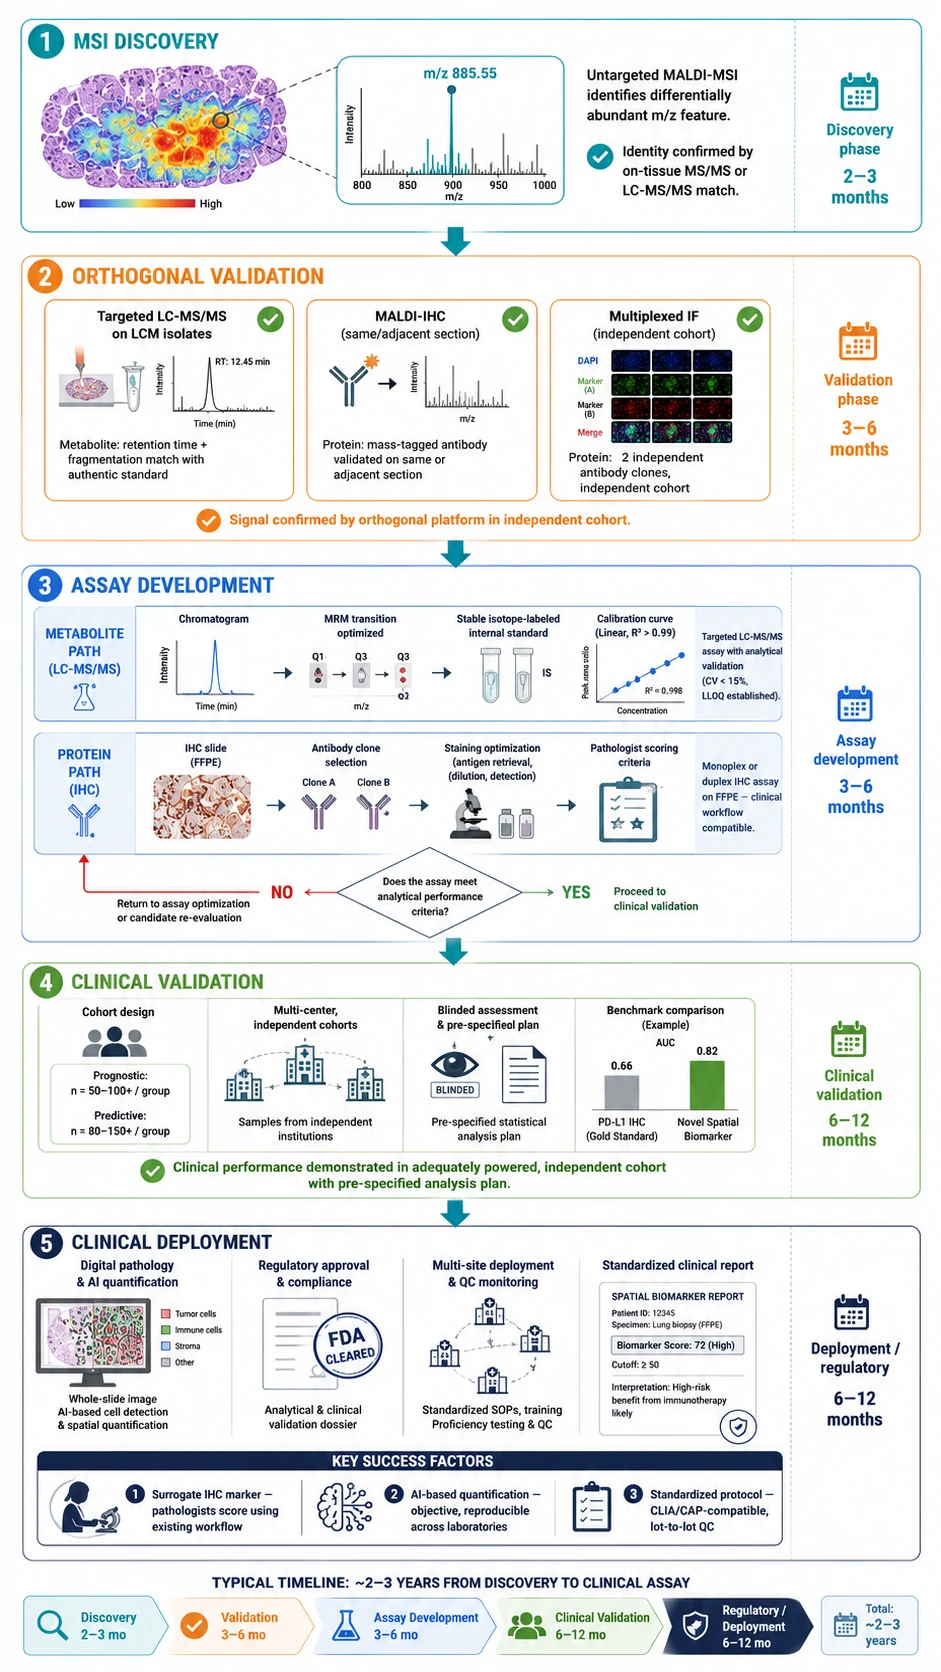 Figure 5: From spatial biomarker to clinical assay — the translational cascade from MALDI-MSI discovery through orthogonal validation to a clinical-grade IHC assay, with AI-based scoring, digital pathology integration, and multi-center deployment milestones
FAQ
How many biomarker candidates should I advance from discovery to validation?
Take 10-30 candidates from a typical discovery experiment (500-2,000 features) into orthogonal validation. Fewer than 10 risks missing true positives due to overly aggressive filtering; more than 30 makes validation logistically and financially impractical — multiplexed IHC panels, targeted LC-MS/MS assays, and independent cohorts are expensive. The prioritization cascade described above (statistical → spatial → biological → machine learning ranking) is designed to produce a short list of this size. For resource-constrained studies, validating the top 5-10 candidates thoroughly is preferable to validating 30 candidates superficially.
What is the minimum evidence required before a spatial biomarker can be considered clinically actionable?
Three independent lines of evidence: (1) technical replication on the same platform (within-platform reproducibility), (2) orthogonal platform validation (different analytical principle, e.g., MALDI-MSI discovery confirmed by IHC or targeted LC-MS/MS), and (3) independent cohort validation (different institution, different patient population). For biomarkers intended to guide treatment decisions (predictive biomarkers), an additional requirement is demonstration in a randomized clinical trial or a prospectively designed retrospective analysis of a trial cohort. A single-platform, single-cohort finding — no matter how statistically significant — is not sufficient for clinical actionability.
Can AI-predicted virtual spatial proteomics replace experimental validation?
Not at present. Virtual spatial proteomics models (HEX, GigaTIME, TileDVP) predict protein expression; they do not measure it. Prediction errors at the level of individual tissue microdomains may be clinically consequential, and no regulatory framework currently exists for AI-predicted biomarkers in clinical decision-making. These tools are best deployed as screening instruments — to prioritize which biomarkers are worth investing in for experimental validation — and as hypothesis generators for biological discovery. For clinical-grade biomarkers, direct experimental measurement by an orthogonal platform remains the standard.
Which orthogonal validation platform is most appropriate for metabolite biomarkers discovered by MALDI-MSI?
Targeted LC-MS/MS on laser-microdissected (LCM) tissue regions from serial sections of independent specimens is the gold standard. This approach confirms both molecular identity (via retention time and MS/MS fragmentation matching against authentic standards) and quantitative abundance difference between conditions. For metabolites where an LCM-LC-MS/MS assay is impractical (e.g., very low abundance or labile metabolites), in situ mass spectrometry imaging at higher mass resolution (FT-ICR or Orbitrap-based MSI) on an independent sample set provides an alternative, though it is less definitive for molecular identification than LC-MS/MS with standards.
Can I use FFPE tissue for spatial biomarker discovery and validation?
It depends on the biomarker class. For protein biomarkers: yes — FFPE is the standard for IHC, multiplexed IF, and imaging mass cytometry, and on-tissue tryptic digestion protocols enable MALDI-MSI of peptides from FFPE sections. For metabolite biomarkers: no — formalin fixation and paraffin embedding remove and chemically modify most small polar metabolites. Fresh-frozen tissue is required for metabolomics discovery. For lipid biomarkers: partially — some lipid classes are retained in FFPE and can be analyzed with established deparaffinization and matrix application protocols, though others are lost during processing. The most robust strategy is to prospectively collect both fresh-frozen tissue (for metabolomics/lipidomics) and FFPE blocks (for proteomics/IHC) from the same specimen, enabling the full multi-omics validation pipeline.
References:
- Li Z, Li Y, Li R, et al. AI-Enabled Virtual Spatial Proteomics from Histopathology for Interpretable Biomarker Discovery in Lung Cancer. Nat Med 2026;32(1):231-244. DOI: 10.1038/s41591-025-04060-4
- Valanarasu JMJ, Robicsek AA, Bifulco C, Poon H, Wang S, et al. Multimodal AI Generates Virtual Population for Tumor Microenvironment Modeling. Cell 2026;189(2):386-400.e19. DOI: 10.1016/j.cell.2025.11.016
- Mathian E, Oldenburg L, Chelebian E, Schweizer L, Zonderland G, Egebjerg K, Ummat I, Mund A, Strauss MT. TileDVP: Decoding the Tissue Proteome from H&E Images. In: Clinical Image-Based Procedures (CLIP 2025), Lecture Notes in Computer Science 2026;16126:21-31. DOI: 10.1007/978-3-032-05479-1_3
- Fields L, Miles HN, Adrian AE, Patrenets E, Ricke WA, Li L. MSIght: A Modular Platform for Improved Confidence in Global, Untargeted Mass Spectrometry Imaging Annotation. J Proteome Res 2025;24:2478-2490. DOI: 10.1021/acs.jproteome.4c01140
- Krestensen KK, Hendriks TFE, Grgic A, Derweduwe M, De Smet F, Heeren RMA, Cuypers E. Molecular Profiling of Glioblastoma Patient-Derived Single Cells Using Combined MALDI-MSI and MALDI-IHC. Anal Chem 2025;97(7):3846-3854. DOI: 10.1021/acs.analchem.4c03821
- Goossen A, Lagache L, Salzet M, Fournier I. MS-Based Spatial Proteomics: Deciphering Tissue Microenvironment by Bridging MS Imaging and Large-Scale Proteomics. Trends Chem 2025;7(11):659-677. DOI: 10.1016/j.trechm.2025.09.002
- Hau K, Fecke A, Hormann FL, Groba AC, Melo LMN, Cansiz F, Allies G, Hentschel A, Chen J, Heiles S, Tasdogan A, Sickmann A, Smith K. SIMO — Single Section Integrative Multi-Omics — Spatial Mapping of Metabolites and Lipids Combined with Region-Specific Proteomics in a Single Tissue Slice. bioRxiv 2026. DOI: 10.64898/2026.04.17.719206
- Horvath P, Coscia F. Spatial Proteomics in Translational and Clinical Research. Mol Syst Biol 2025;21:526-530. DOI: 10.1038/s44320-025-00101-9
- Lei S, Ning W, Zhang H, Chen Q, Wang Z, Wang L, Wang G, et al. Deep Visual Multi-Omics Reveals Intra-Tumor Heterogeneity of Gene Expression and Immunophenotype in Colorectal Cancer. Sci Bull 2026;71(11). DOI: 10.1016/j.scib.2026.04.047
- Chang W, Li K, Huang P. Integrative Spatial Multi-Omics Reveals the Tumor Ecosystem: From Mechanistic Insights to Therapeutic Strategies. iScience 2026;29(7):116349. DOI: 10.1016/j.isci.2026.116349


















