

Most widely used spatial transcriptomics platforms — notably 10x Genomics Visium — do not capture individual cells. Each 55-μm-diameter spot on a Visium capture area contains mRNA from 1 to 10 cells depending on tissue density, meaning the raw output is a mixture of transcriptomes from multiple cell types at every spatial coordinate. Computational deconvolution solves this problem: it computationally separates the mixed signal at each spot into its constituent cell types and estimates their relative proportions. The result transforms a spatial gene expression map into a spatial cell-type composition map — a prerequisite for answering questions like "which immune cells infiltrate the tumor border?" or "what cell types define this histologically ambiguous tissue region?" This article provides a practical guide to selecting and applying cell-type deconvolution methods, choosing appropriate single-cell references, and interpreting deconvolution results with an awareness of the method's limitations at sub-spot resolution and beyond the transcriptomic domain.
Why Deconvolve? The Cell-Type Assignment Problem in Spatial Omics
Spatial Transcriptomics Spots Contain Multiple Cells: The Mixture Problem
Spatial transcriptomics technologies fall into two broad categories: imaging-based methods (MERFISH, Xenium, CosMx) that resolve single cells directly, and capture-based methods (Visium, Slide-seq, Stereo-seq) where each spatial measurement unit contains transcripts from multiple cells. For Visium — the most widely deployed platform with tens of thousands of datasets in public repositories — the 55-μm spot diameter means each spot reports a weighted average of gene expression from the cells within its boundary. In dense tissues like lymphoid organs or tumors, a single spot may capture 5-10 cells of distinct lineages. The raw count matrix therefore answers "what genes are expressed at this location?" but not "which cells are expressing them?" — a distinction with major biological consequences.
Why Cell-Type Composition Matters
Cell-type composition is not merely a metadata annotation; it is often the primary biological variable of interest. In tumor immunology, the proportion of CD8+ cytotoxic T cells at the tumor-invasive margin, relative to immunosuppressive Tregs and MDSCs, is a stronger predictor of immunotherapy response than bulk tumor gene expression. In neurodegeneration, the ratio of homeostatic to disease-associated microglia at amyloid plaque boundaries changes with disease progression in ways invisible to tissue-level transcriptomics. In developmental biology, cell-type proportions shift dramatically across space and time during organogenesis, and deconvolution of spatial data provides a quantitative readout of these shifts at each tissue coordinate. Our spatial cell-type mapping service is built to extract precisely this type of compositional information from spatial transcriptomics data.
Deconvolution vs Segmentation: When to Use Computational vs Imaging-Based Methods
For researchers with access to single-cell-resolution spatial platforms (Xenium, MERFISH), cell-type assignment is achieved through cell segmentation — delineating individual cell boundaries from DAPI or membrane stains and assigning transcripts within each boundary to a single cell. Deconvolution is unnecessary when segmentation works. Deconvolution becomes necessary when: (a) the spatial platform does not achieve single-cell resolution (Visium, Slide-seq V1), (b) tissue autofluorescence or density precludes reliable segmentation even on single-cell platforms, or (c) the research question requires integrating legacy Visium datasets with newer single-cell-resolution data. The choice between deconvolution and segmentation is therefore not a methodological preference but a function of data resolution and tissue quality.
The scRNA-seq Reference: The Foundation of Deconvolution
Single-Cell Reference Selection: Tissue-Matched, Atlas-Level, or Multi-Tissue?
Reference-based deconvolution methods require a single-cell RNA-seq dataset with annotated cell types as input. The quality of this reference is the single most important determinant of deconvolution accuracy — more important than the choice of deconvolution algorithm itself. Three reference strategies are commonly used. Tissue-matched references — scRNA-seq from the same tissue type and comparable biological condition (e.g., scRNA-seq of treatment-naive human colorectal tumors for deconvolving a colorectal cancer Visium dataset) — provide the most accurate cell-type signatures because cell-type transcriptional profiles are tissue-context-dependent. Atlas-level references — large-scale, multi-tissue cell atlases such as the Human Cell Atlas, Tabula Sapiens, or the Allen Brain Atlas — offer comprehensive cell-type coverage but may include cell types irrelevant to the tissue under study, diluting deconvolution specificity. Multi-tissue or universal references trade precision for convenience and are generally discouraged for focused tissue-specific studies. The Spotless benchmarking study (Sang-aram et al., 2024) demonstrated that reference quality — specifically, having a sufficient number of genes distinguishing each cell type — is a stronger determinant of deconvolution accuracy than the choice of algorithm among top-performing methods.
Reference Quality Matters: Annotation Granularity, Batch Effects, Coverage
Three reference quality dimensions determine deconvolution performance. First, cell-type annotation granularity: a reference that distinguishes "T cell" as a single category will produce coarser deconvolution than one distinguishing CD4+ naive, CD4+ memory, CD8+ effector, CD8+ exhausted, Treg, and gamma-delta T cells. However, overly granular annotation (e.g., 50+ subtly distinct neuronal subtypes) can introduce noise if the transcriptional differences between subtypes are small relative to technical variation. Second, batch effects between the scRNA-seq reference and the spatial transcriptomics target data — arising from different sample processing protocols, sequencing platforms, or laboratories — introduce systematic bias. RCTD explicitly models platform effects as gene-specific random effects (Cable et al., 2022), while cell2location uses a hierarchical Bayesian framework that partially absorbs batch variation through its per-gene sensitivity parameters (Kleshchevnikov et al., 2022). Third, gene coverage: scRNA-seq references must contain enough genes per cell type to generate robust signatures. The Spotless benchmark found that methods performed significantly worse when reference cell types had fewer than 20 distinguishing marker genes (Sang-aram et al., 2024).
When No Reference Exists: Reference-Free Deconvolution
In some scenarios — for example, studying a poorly characterized tissue, a non-model organism, or a novel disease state — no suitable annotated scRNA-seq reference is available. STdeconvolve (Miller et al., 2022) addresses this gap as the leading reference-free method. It uses latent Dirichlet allocation (LDA) — a topic modeling approach originally developed for text analysis — to discover transcriptional "topics" (putative cell types) directly from the spatial transcriptomics data itself, without any external reference. Each topic consists of a co-expressed gene program, and each spatial spot is modeled as a mixture of topics. The method then assigns biological identities to topics post hoc by examining topic-specific marker genes against existing databases. The key limitation is interpretability: the discovered topics may correspond to true cell types, cell states, or technical artifacts, and the researcher must validate each topic's biological meaning. For well-studied tissues with abundant reference data, reference-based methods are preferred; for exploratory studies in novel biological contexts, STdeconvolve provides a principled starting point.
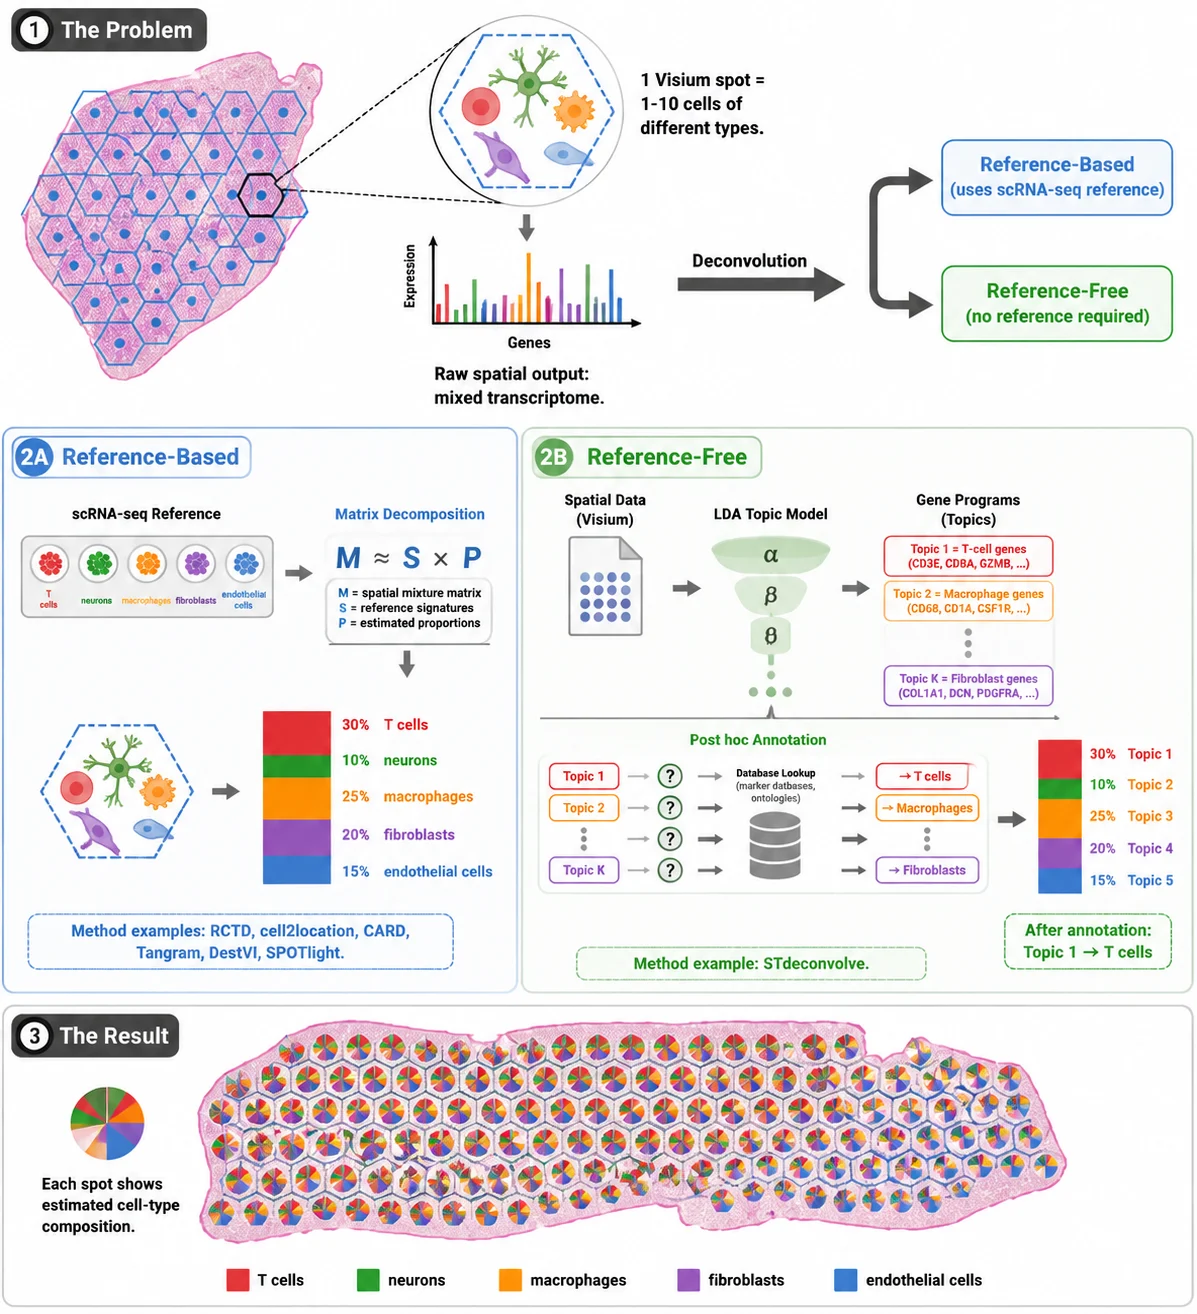 Figure 1: The deconvolution concept — each Visium spot as a mixture of cell types, and how reference-based and reference-free methods resolve the mixture
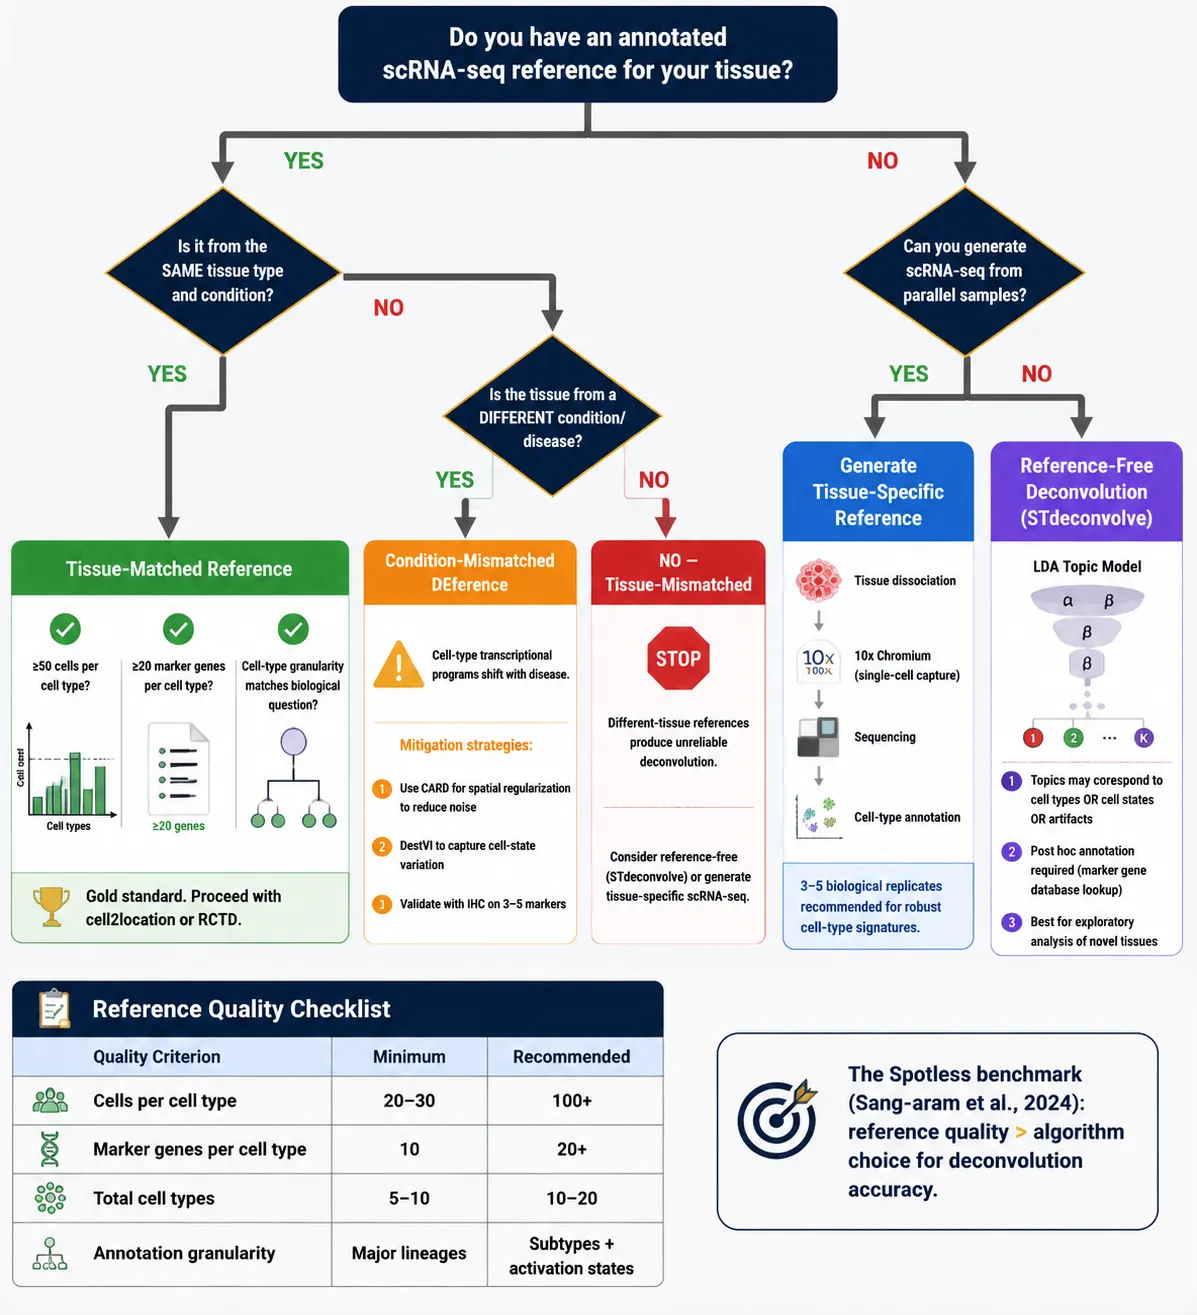 Figure 2: scRNA-seq reference selection decision tree — tissue-matched vs atlas-level vs reference-free, with quality criteria at each branch
Deconvolution Methods: Comparative Analysis
Over 20 computational methods for spatial transcriptomics deconvolution have been published, spanning probabilistic, regression-based, deep learning, matrix factorization, and spatial-aware approaches. A comprehensive 2025 review (Saqib and Kim, 2025) classified these into five algorithmic families and provided a methodological handbook for researchers navigating the landscape. Here, we focus on seven methods that consistently rank as top performers across independent benchmarks and span the major algorithmic categories — organized by how they handle the core challenge of mapping scRNA-seq signatures to spatial mixtures.
RCTD: Regression-Based Modeling of Platform Effects
RCTD (Robust Cell Type Decomposition; Cable et al., 2022) uses a maximum-likelihood framework with a Poisson error model, explicitly accounting for platform effects — systematic differences between scRNA-seq and spatial transcriptomics gene expression measurements that arise from technical rather than biological variation. RCTD models these as gene-specific random effects, meaning genes that are systematically over- or under-detected by the spatial platform relative to scRNA-seq are corrected for during deconvolution. The method operates in two modes: "doublet mode," which assumes each spot contains exactly two cell types (appropriate for low-density tissues at 10x Visium resolution), and "full mode," which estimates unrestricted cell-type proportions (appropriate for dense tissues). RCTD is distinguished by its computational efficiency (2-15 minutes per sample) and its simplicity — it requires fewer dependencies and less hyperparameter tuning than probabilistic alternatives. In the cardiovascular disease benchmark by Slabowska et al. (2024), RCTD achieved the highest accuracy (0.734) with the fastest runtime.
cell2location: Probabilistic Modeling with Spatial Regularization
cell2location (Kleshchevnikov et al., 2022) uses a hierarchical Bayesian model with negative binomial likelihood to estimate cell-type abundances at each spatial location, incorporating spatial information through a neighborhood-aware prior. Its key innovation is the decomposition of technical variation into gene-specific detection sensitivities (learned from the data) and location-specific scaling factors, allowing the model to adapt to different spatial transcriptomics platforms without manual parameter tuning. Across multiple independent benchmarks — including the Spotless study (63 silver standards, 3 gold standards) and the cardio-renal disease evaluation — cell2location consistently achieves the highest overall accuracy and best rare-cell-type detection (AUROC of 0.98 for rare podocyte identification). The trade-off is computational: cell2location requires 35 minutes to 2.5 hours per sample and benefits from GPU acceleration. It is the method of choice when reference data are limited (it converges with as few as 30-100 cells per cell type) and when the detection of rare cell populations is a priority.
CARD: Spatially Informed Deconvolution with Conditional Autoregression
CARD (Conditional Autoregressive-based Deconvolution; Ma and Zhou, 2022) combines scRNA-seq-derived cell-type signatures with a conditional autoregressive (CAR) spatial prior that encourages neighboring spots to have similar cell-type compositions — a biologically reasonable assumption given that cells of the same type tend to cluster in tissue. This spatial regularization is CARD's distinguishing feature: it smooths deconvolution results across tissue space, reducing noise and producing more biologically coherent cell-type maps. CARD can also impute cell-type compositions at locations between measured spots (spatial interpolation), effectively increasing the resolution of the deconvolution output. Validated on human pancreatic cancer, CARD identified spatial gradients of acinar, ductal, and cancer-associated fibroblast populations whose cell-type proportions tracked with known tumor histopathology (Ma and Zhou, 2022).
Tangram and DestVI: Deep Learning Approaches
Tangram (Biancalani et al., 2021) uses a deep learning framework to align scRNA-seq profiles onto spatial coordinates by minimizing the divergence between the spatial gene expression and a learned combination of single-cell profiles, with spatial entropy regularization. Its key strength is the ability to map individual cells — not just cell types — to spatial locations, enabling single-cell-resolution spatial reconstructions. DestVI (Lopez et al., 2022) extends the scVI (single-cell variational inference) framework to the spatial domain, using a deep generative model to simultaneously infer cell-type proportions and cell-state variations (e.g., activation, differentiation, metabolic state) across spatial locations. This dual capability — deconvolving cell types AND continuous cell states — makes DestVI uniquely suited for studies where cellular activation or differentiation gradients are the primary biological question, such as T-cell exhaustion gradients across tumor zones. Both methods require substantial computational resources (GPU recommended) and benefit from large, well-annotated scRNA-seq references.
SPOTlight: Enrichment-Based Deconvolution via Seeded NMF
SPOTlight (Elosua-Bayes et al., 2021) takes a different approach from the probabilistic and deep learning methods: it uses seeded non-negative matrix factorization (NMF), initialized with cell-type-specific marker genes identified from the scRNA-seq reference, to decompose each spatial spot into cell-type proportions. The seeded initialization is the key — by starting the NMF factorization from known cell-type gene signatures, SPOTlight constrains the solution to biologically interpretable components. The method is fast (minutes per dataset), requires no hyperparameter tuning, and produces interpretable outputs. Its limitation is sensitivity to the quality of the initial marker gene set: poor marker selection leads to poor deconvolution.
Method Selection Decision Framework
| Method | Algorithmic Family | Reference Required? | Runtime | Best For |
|---|---|---|---|---|
| RCTD | Regression (Poisson ML) | Yes | 2-15 min | Fast, robust, routine deconvolution |
| cell2location | Bayesian hierarchical | Yes | 35 min-2.5 hr | Rare cell types, limited reference data |
| CARD | Conditional autoregressive | Yes | 10-30 min | Spatially smooth maps, interpolation |
| Tangram | Deep learning | Yes | 30-60 min (GPU) | Single-cell mapping to space |
| DestVI | Deep generative | Yes | 30-60 min (GPU) | Cell-type + cell-state deconvolution |
| SPOTlight | Seeded NMF | Yes | 5-15 min | Fast, interpretable, marker-driven |
| STdeconvolve | LDA (topic modeling) | No | 10-20 min | No reference available |
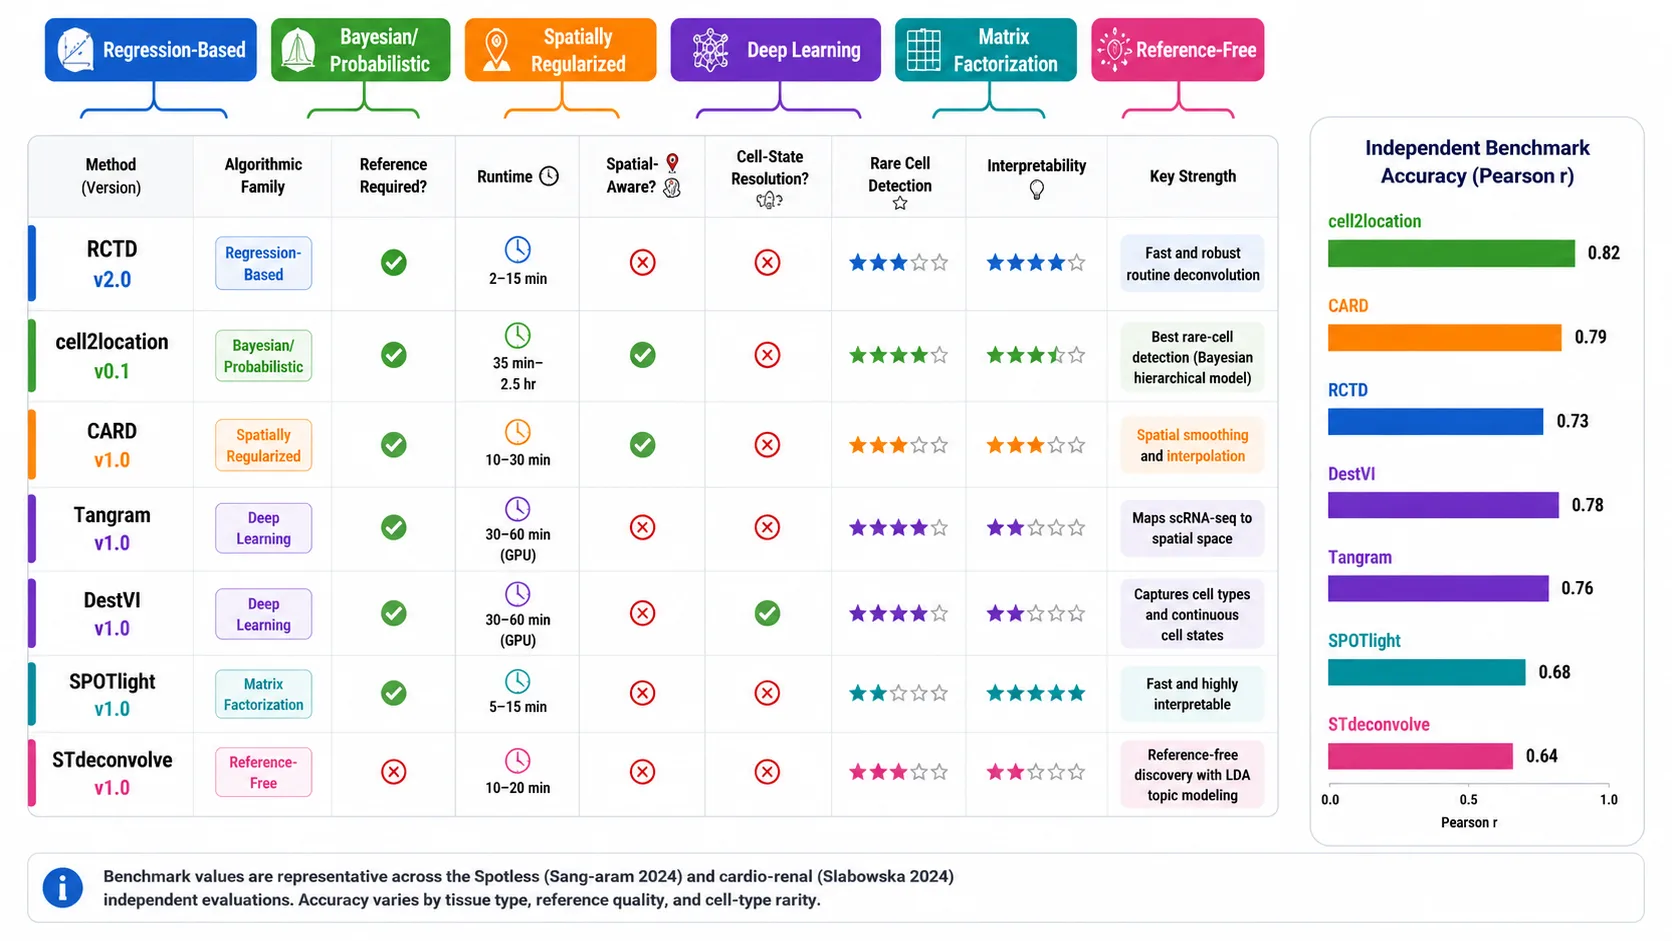 Figure 3: Seven deconvolution methods compared — capability matrix with algorithmic categories, input requirements, and performance characteristics
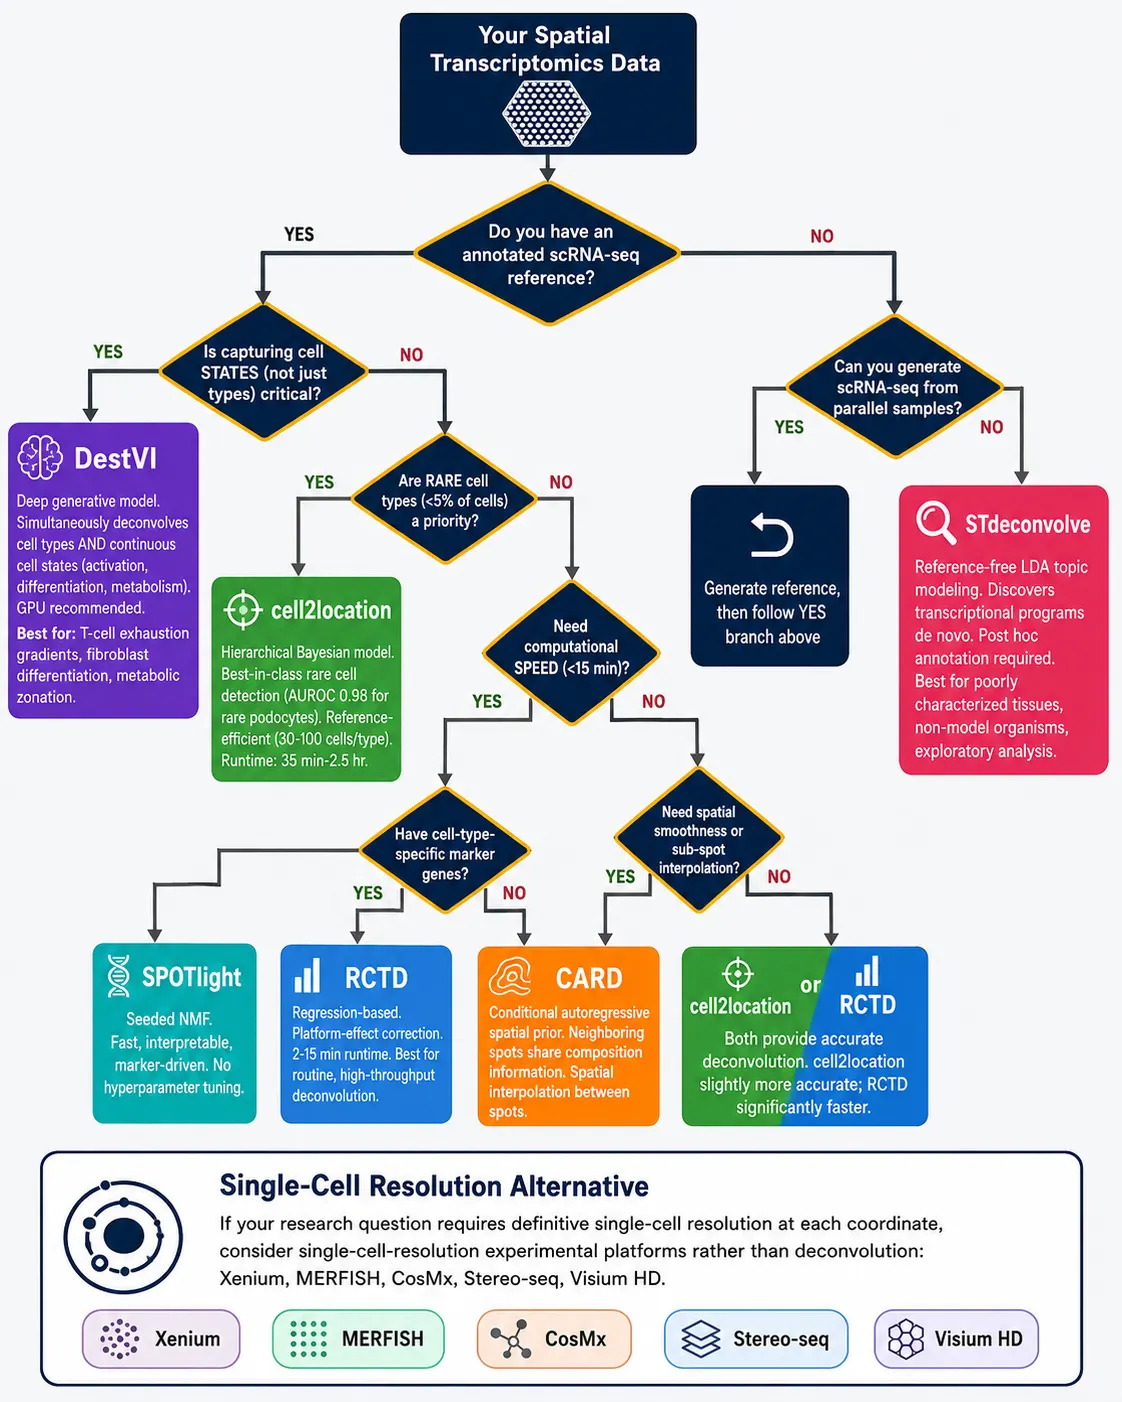 Figure 4: Method selection decision flowchart — data type, reference availability, and research question leading to recommended method
Sub-Spot Resolution: Deconvolving Below the Visium Spot Size
The 55-μm Spot Problem
All the deconvolution methods discussed above estimate cell-type proportions at the resolution of the measurement unit — the Visium spot, approximately 55 μm in diameter. But many biological questions require finer spatial resolution: a 55-μm spot in the tumor-invasive margin may straddle the boundary between tumor parenchyma and surrounding stroma, mixing two fundamentally different tissue compartments within a single measurement. Sub-spot deconvolution aims to computationally increase resolution beyond the physical spot size — predicting what the cell-type composition would look like if the tissue were measured at 10-μm or single-cell resolution.
Super-Resolution Deconvolution: Approaches and Limitations
Several strategies achieve sub-spot resolution. CARD's spatial interpolation capability uses the conditional autoregressive model to predict cell-type proportions at coordinates between measured spots, effectively generating a higher-resolution cell-type map (Ma and Zhou, 2022). BayesSpace (Zhao et al., 2021) uses a Bayesian model with a Markov random field spatial prior to partition each spot into sub-spots whose gene expression is then estimated from neighboring information. Deep learning methods such as DeepSpot2Cell predict virtual single-cell transcriptomes directly from H&E images with spot-level supervision. These methods increase spatial granularity but do not create new information — the sub-spot predictions are interpolations constrained by the original spot-level measurements, and their accuracy degrades in regions with sharp cell-type boundaries where interpolation assumptions break down. For studies requiring true single-cell resolution, higher-resolution experimental platforms (Xenium, MERFISH, Stereo-seq, Visium HD) are the definitive solution. Our single-cell spatial transcriptomics service supports these platforms for studies where deconvolution alone is insufficient.
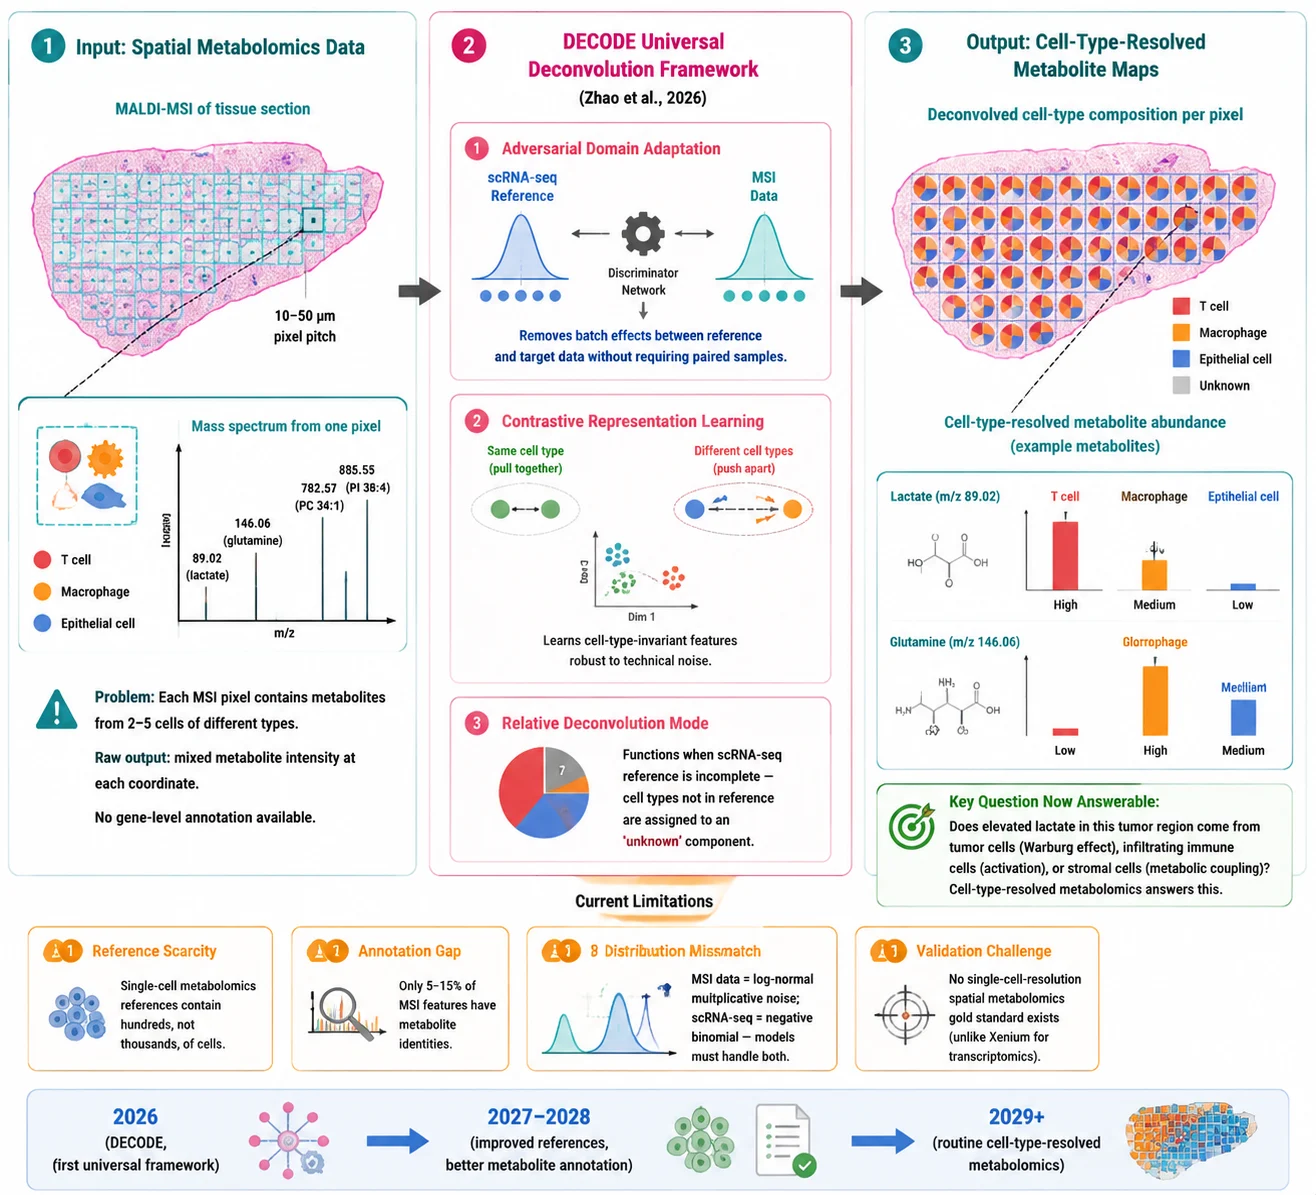 Figure 5: Sub-spot deconvolution concept — from a 55 μm Visium spot grid to computationally enhanced sub-spot cell-type maps
Beyond Transcriptomics: Deconvolution for Spatial Proteomics and Metabolomics
Spatial Proteomics Deconvolution: A Different Problem
Most spatial proteomics platforms (MIBI-TOF, CODEX, CyCIF) already operate at single-cell resolution through antibody-based detection of 20-60 protein targets with cell segmentation via DAPI or membrane stains. In these workflows, cell-type annotation is achieved through clustering of per-cell protein expression profiles — a simpler task than transcriptomic deconvolution because each measurement corresponds to exactly one cell. However, for lower-resolution proteomics approaches (GeoMx DSP at the ROI level, or bulk tissue proteomics), deconvolution remains necessary. The principles are analogous to transcriptomic deconvolution, with the critical difference that protein reference panels — single-cell proteomics by mass cytometry or CITE-seq — are smaller (20-200 targets vs 20,000 genes) and noisier.
The Spatial Metabolomics Frontier: DECODE and Universal Deconvolution
The extension of deconvolution to spatial metabolomics data represents the field's most significant emerging frontier. Unlike transcriptomics, where each gene has a known identity and cell-type expression pattern, metabolite features in spatial metabolomics by MALDI-MSI or DESI-MSI lack gene-level annotation, have fundamentally different data distributions, and suffer from batch effects that complicate cross-modality integration. For a broader introduction to the spatial metabolomics technology landscape, see our guide to spatial metabolomics by mass spectrometry imaging. The 2026 publication of DECODE (Zhao et al., 2026, Nature Methods) represents a breakthrough: the first universal deep learning-based deconvolution framework that operationalizes across transcriptomics, proteomics, and metabolomics data using a unified architecture. This builds on advances in single-cell spatial metabolomics, where subcellular-resolution MSI provides the foundational data that deconvolution methods ultimately aim to resolve into cell-type-specific metabolic profiles. DECODE uses adversarial training to remove batch effects between reference single-cell data and target spatial data, contrastive learning for robustness against noise, and a relative deconvolution mode that functions even when the single-cell reference is incomplete — a common scenario in metabolomics where not all cell types present in the tissue have been profiled at single-cell resolution. DECODE successfully deconvolved single-cell metabolomics data from mouse liver, bone marrow, and human colorectal cancer (Zhao et al., 2026). This capability opens the door to cell-type-resolved analysis of metabolic phenotypes — for example, determining whether elevated lactate in a tumor region originates from tumor cells (Warburg effect), infiltrating immune cells (activation), or stromal cells (metabolic coupling) — directly from spatial metabolomics data. Our integrated spatial multi-omics service and bioinformatics analysis platform support these emerging multi-omics deconvolution workflows.
Validation and Best Practices
Validating Deconvolution Results with Orthogonal Methods
A deconvolution result is a computational prediction, not a measurement. Validation against an orthogonal experimental method is essential for any study where cell-type composition is a primary endpoint. Three validation strategies, in increasing order of rigor: (1) Immunohistochemistry or immunofluorescence for 2-5 cell-type markers on adjacent tissue sections, providing qualitative spatial confirmation that predicted cell-type distributions match known marker distributions. (2) Fluorescence in situ hybridization (RNAScope, MERFISH) for cell-type-specific transcripts, enabling single-cell-resolution validation on the same or adjacent sections. (3) Single-cell-resolution spatial platforms (Xenium, CosMx) applied to an adjacent section, providing the gold-standard ground truth — every cell is individually typed, and the deconvolution prediction at each Visium spot can be compared to the actual cell-type composition of the cells within that spot boundary.
Common Pitfalls
Three pitfalls recur across deconvolution studies. Reference mismatch: using a scRNA-seq reference from a different tissue, developmental stage, or disease state than the spatial data. A mouse brain reference will not deconvolve a human glioblastoma sample, and neither will a healthy lung reference deconvolve an IPF lung — cell-type transcriptional programs change with disease. Over-interpretation of sub-spot predictions: sub-spot deconvolution methods interpolate between measurements; they do not create new measurements. Interpreting a sub-spot prediction as having the same confidence as a direct single-cell measurement is a common error. Ignoring cell states: methods that deconvolve only discrete cell types (RCTD, SPOTlight, cell2location) miss continuous variation within cell types — T-cell activation gradients, fibroblast differentiation trajectories, metabolic zonation — that may be the most biologically relevant signal. When cell-state variation is of interest, methods that capture continuous states (DestVI, DECODE) should be preferred.
Reporting Standards
Minimal reporting standards for a deconvolution study include: the scRNA-seq reference dataset and its accession identifier, cell-type annotation method and granularity, the deconvolution algorithm and version (with all non-default parameter settings), validation method and results, and software environment (R/Python version, key package versions). The Spotless Nextflow pipeline (Sang-aram et al., 2024) provides a reproducible framework that generates these reporting elements automatically, and its use is encouraged for studies where deconvolution is a primary analysis endpoint.
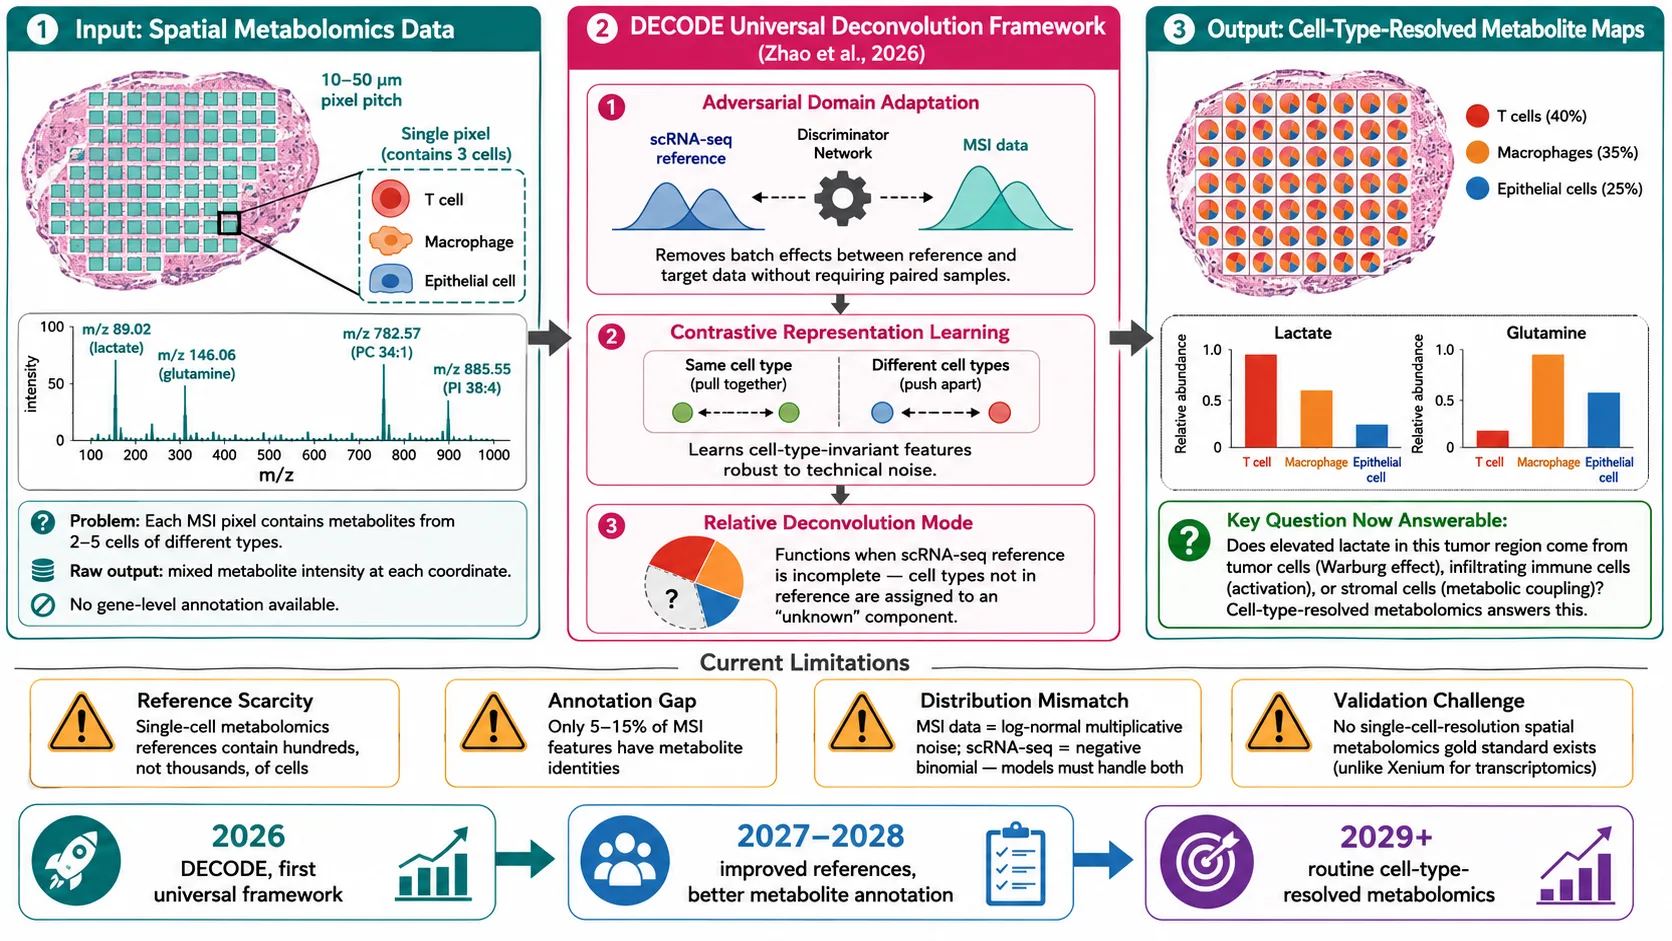 Figure 6: Spatial metabolomics deconvolution — the emerging frontier concept, from MALDI-MSI pixels to cell-type-resolved metabolite abundance maps via DECODE
FAQ
Which deconvolution method should I use for my Visium data?
If you have a well-annotated, tissue-matched scRNA-seq reference: cell2location provides the highest overall accuracy, especially for rare cell types, at the cost of longer runtime. RCTD is a strong alternative when computational resources are limited or when speed is a priority — it achieves comparable accuracy on common cell types and runs in minutes rather than hours. If your reference is from a different tissue or condition, or if you suspect cell types in your tissue are not represented in the reference, use a method with spatial regularization (CARD) to reduce noise from reference mismatch, or consider DestVI for its ability to capture cell-state variation that may partially compensate for reference gaps.
Can I do deconvolution without a scRNA-seq reference?
Yes — STdeconvolve performs reference-free deconvolution using latent Dirichlet allocation to discover transcriptional programs directly from the spatial data. However, the discovered "topics" require post hoc biological interpretation (examining topic marker genes against known databases), and topics may correspond to cell types, cell states, technical variation, or mixtures of these. Reference-free deconvolution is best suited for exploratory analysis of poorly characterized tissues; for well-studied tissues, reference-based methods provide more interpretable and validated results.
How many cells per cell type do I need in my scRNA-seq reference?
cell2location converges reliably with as few as 30-100 cells per cell type. RCTD is more demanding, requiring 50-200 cells per type for robust platform-effect estimation. Across all methods, performance degrades when cell types in the reference are represented by fewer than 20 cells, and rare cell types (<10 cells) are not reliably detected by any method. The Spotless benchmark confirmed that the number of distinguishing genes per cell type — not just cell count — is critical: cell types with fewer than 20 differentially expressed marker genes relative to all other types are difficult to deconvolve regardless of cell count (Sang-aram et al., 2024).
Does deconvolution work for spatial metabolomics data?
Until 2026, the answer was essentially no — metabolomics lacked dedicated deconvolution tools. The publication of DECODE (Zhao et al., 2026, Nature Methods) changed this, providing the first universal deconvolution framework that handles metabolomics alongside transcriptomics and proteomics. However, the metabolomics deconvolution ecosystem remains nascent: single-cell metabolomics references are scarce (hundreds of cells, not thousands), metabolite annotation rates in MSI data are low (5-15% of detected features), and the statistical properties of MSI data (log-normal, multiplicative noise) differ fundamentally from UMI-based transcriptomics data. Metabolomics deconvolution is an active research frontier, not yet a routine workflow — but the trajectory is clear.
How do I validate that my deconvolution results are correct?
The gold standard is comparison against a single-cell-resolution spatial platform applied to an adjacent tissue section: Xenium, CosMx, or MERFISH provide per-cell cell-type calls, and the deconvolution prediction at each Visium spot can be compared to the ground-truth composition of cells falling within that spot boundary. For studies without access to these platforms, orthogonal validation by multiplexed immunofluorescence (3-5 cell-type markers) on an adjacent section provides qualitative confirmation. At minimum, deconvolution results should be checked for internal consistency: predicted cell-type distributions should match known tissue architecture (e.g., neurons in gray matter, not white matter), and cell types known to co-localize should show correlated spatial distributions.
References:
- Saqib J, Kim J. From Pixels to Cell Types: A Comprehensive Review of Computational Methods for Spatial Transcriptomics Deconvolution. Genomics Inform 2025;23:22. DOI: 10.1186/s44342-025-00055-2
- Cable DM, Murray E, Zou LS, Goeva A, Macosko EZ, Chen F, Irizarry RA. Robust Decomposition of Cell Type Mixtures in Spatial Transcriptomics. Nat Biotechnol 2022;40(4):517-526. DOI: 10.1038/s41587-021-00830-w
- Kleshchevnikov V, Shmatko A, Dann E, Aivazidis A, King HW, Li T, et al. Cell2location Maps Fine-Grained Cell Types in Spatial Transcriptomics. Nat Biotechnol 2022;40(5):661-671. DOI: 10.1038/s41587-021-01139-4
- Ma Y, Zhou X. Spatially Informed Cell-Type Deconvolution for Spatial Transcriptomics. Nat Biotechnol 2022;40(9):1349-1359. DOI: 10.1038/s41587-022-01273-7
- Miller BF, Huang F, Atta L, Sahoo A, Fan J. Reference-Free Cell Type Deconvolution of Multi-Cellular Pixel-Resolution Spatially Resolved Transcriptomics Data. Nat Commun 2022;13:2339. DOI: 10.1038/s41467-022-30033-z
- Zhao T, Liu R, Sun Y, Wang B, Zhang L, Chen Q, et al. DECODE: Deep Learning-Based Common Deconvolution Framework for Various Omics Data. Nat Methods 2026;23(3):596-608. DOI: 10.1038/s41592-026-03007-y
- Sang-aram C, Browaeys R, Seurinck R, Saeys Y. Spotless, a Reproducible Pipeline for Benchmarking Cell Type Deconvolution in Spatial Transcriptomics. eLife 2024;12:e88431. DOI: 10.7554/eLife.88431
- Biancalani T, Scalia G, Buffoni L, Avasthi R, Lu Z, Sanger A, et al. Deep Learning and Alignment of Spatially Resolved Single-Cell Transcriptomes with Tangram. Nat Methods 2021;18(11):1352-1362. DOI: 10.1038/s41592-021-01264-7
- Lopez R, Li B, Keren-Shaul H, Boyeau P, Kedmi M, Pilzer D, et al. DestVI Identifies Continuums of Cell Types in Spatial Transcriptomics Data. Nat Biotechnol 2022;40(9):1360-1369. DOI: 10.1038/s41587-022-01272-8
- Elosua-Bayes M, Nieto P, Mereu E, Gut I, Heyn H. SPOTlight: Seeded NMF Regression to Deconvolute Spatial Transcriptomics Spots with Single-Cell Transcriptomes. Nucleic Acids Res 2021;49(9):e50. DOI: 10.1093/nar/gkab043
- Slabowska AO, Pyke C, Hvid H, Jessen LE, Baumgart S, Das V. A Systematic Evaluation of State-of-the-Art Deconvolution Methods in Spatial Transcriptomics: Insights from Cardiovascular Disease and Chronic Kidney Disease. Front Bioinform 2024;4:1352594. DOI: 10.3389/fbinf.2024.1352594
- Zhao E, Stone MR, Ren X, Guenthoer J, Smythe KS, Pulliam T, et al. Spatial Transcriptomics at Subspot Resolution with BayesSpace. Nat Biotechnol 2021;39(11):1375-1384. DOI: 10.1038/s41587-021-00935-2














