

Spatial biology has undergone a fundamental transformation. Five years ago, a "spatial multi-omics" study meant running two separate experiments on adjacent tissue sections and manually comparing the images side by side. Today, the field has advanced to the point where researchers can acquire transcriptomic, proteomic, and metabolomic data from the same tissue section, then feed these multi-layered datasets into dedicated computational frameworks — tools that emerged primarily in 2025-2026 — for integrated, spatially aligned analysis. This article provides a comprehensive guide to the integrated spatial multi-omics landscape: the experimental strategies for generating multi-modal spatial data, the computational frameworks that fuse heterogeneous data types, the unique challenges of integrating mass spectrometry-based metabolomics with sequencing-based transcriptomics, and a decision framework for selecting the right integration approach for a given biological question.
What Is Integrated Spatial Multi-Omics?
From One-Molecule-at-a-Time to Systems-Level Spatial Biology
Traditional spatial biology — whether spatial transcriptomics, spatial metabolomics, or spatial lipidomics — maps the distribution of a single molecular class across tissue coordinates. These unimodal approaches have yielded transformative insights: tumor-immune boundaries defined by gene expression gradients, metabolic zonation in the liver mapped by MALDI-MSI, and lipid remodeling at atherosclerotic plaque margins. But they each capture only one dimension of a fundamentally multi-layered biological reality. A gene expression gradient at the tumor margin acquires functional meaning only when paired with the corresponding protein abundance and the local metabolite concentrations that reflect actual enzymatic activity. No single omics layer tells the complete story, because biological regulation operates across all three layers simultaneously — transcriptional programs set the potential, protein expression determines the machinery, and metabolite concentrations reflect the functional output.
The Integration Imperative: Why Individual Omics Layers Tell Incomplete Stories
The gap between transcript-level prediction and metabolic reality is well documented. mRNA abundance explains only 30-50% of protein abundance variance, and protein abundance explains an even smaller fraction of metabolite concentration variance, because metabolite levels are governed by enzyme kinetics, substrate availability, cofactor redox state, and transport — factors invisible to transcriptomics and proteomics. In the tumor microenvironment, lactate concentration at a given spatial coordinate is determined not by the expression of a single gene but by the integrated activity of glycolysis (tumor cells), consumption (oxidative cancer cells and M2 macrophages), and vascular clearance — a multi-cellular, multi-enzymatic system that only a multi-omics approach can resolve. Our multi-omics integrative analysis services are designed to bridge precisely these layers.
The Spatial Dimension: Why Integration Must Preserve Tissue Coordinates
Integrating omics data without spatial coordinates — for instance, correlating bulk RNA-seq with bulk metabolomics from the same tumor — loses the very information that makes spatial biology powerful: the geometric relationships between molecularly distinct tissue compartments. A lipid gradient that spans 200 μm from the hypoxic core to the vascular periphery carries biologically crucial information about metabolic adaptation to oxygen availability. A gene-metabolite correlation that is strong in the tumor core but absent at the invasive margin reveals a spatially constrained regulatory mechanism. Preserving spatial coordinates during multi-omics integration is both the central challenge and the central value proposition of this field. For a deeper treatment of individual MSI platforms that generate these spatially resolved datasets, see our guide to spatial metabolomics by mass spectrometry imaging and our foundational article on MALDI mass spectrometry imaging workflows.
The Spatial Multi-Omics Data Landscape
Spatial Transcriptomics: Visium, MERFISH, Xenium, Slide-seq — Data Structure and Scale
Spatial transcriptomics encompasses the broadest range of technologies in the spatial multi-omics ecosystem. 10x Genomics Visium captures the whole transcriptome from 55-μm-diameter spots, each containing 1-10 cells, yielding data in the form of an m × n gene expression matrix with associated (x, y) spot coordinates — typically 2,000-5,000 spots per capture area, each with 20,000+ genes. MERFISH (Vizgen) and Xenium (10x Genomics) operate at true single-cell resolution, imaging hundreds to thousands of pre-selected genes via sequential fluorescence hybridization or in situ sequencing, respectively, producing cell-segmented expression matrices with subcellular spatial coordinates for millions of cells per sample. Slide-seq and Stereo-seq push resolution further using spatially barcoded oligonucleotide arrays to capture RNA at near-cellular (10 μm) to subcellular (500 nm) resolution. The key structural feature of spatial transcriptomics data is that each measured entity (gene) is linked to a known biological identity through genome annotation — a property that metabolomics data notably lacks.
Spatial Proteomics: MIBI-TOF, CODEX, GeoMx DSP — Protein-Level Spatial Data
Spatial proteomics platforms detect 20-60+ proteins simultaneously at single-cell or regional resolution. MIBI-TOF (multiplexed ion beam imaging) uses metal-tagged antibodies and secondary ion mass spectrometry to achieve 260 nm resolution with 40+ protein targets. CODEX (co-detection by indexing) uses DNA-barcoded antibodies with iterative fluorophore hybridization for 50+ targets at single-cell resolution. GeoMx Digital Spatial Profiler (DSP) takes a different approach — UV-photocleavable oligonucleotide tags on antibodies are released from user-selected regions of interest (ROIs) for downstream quantification, enabling whole-transcriptome or 100+ protein panels from spatially defined compartments. Proteomics data benefits from well-validated antibodies and established cell-type markers, making cell-type annotation relatively straightforward compared to metabolomics.
Spatial Metabolomics and Lipidomics: MALDI-MSI, DESI-MSI — Metabolite-Level Spatial Data
Spatial metabolomics and lipidomics, primarily executed through MALDI mass spectrometry imaging and DESI-MSI, generate fundamentally different data structures from sequencing-based spatial omics. Each pixel (typically 10-50 μm for MALDI, 50-200 μm for DESI) contains a full mass spectrum with 10,000-50,000 m/z features, of which only a fraction can be annotated as specific metabolites or lipids. The data are stored as a 3D hypercube (x × y × m/z), where each spatial coordinate maps to an intensity value for each m/z bin. Critically, m/z features lack the built-in biological annotation that gene identifiers provide — a peak at m/z 782.57 could be PC 34:1, PE 36:4, or an unrelated species. This annotation gap, combined with spectral batch effects, creates unique challenges for multi-omics integration. For an introduction to the lipid-focused dimension, see our guide to spatial lipidomics by mass spectrometry imaging, and for the single-cell resolution frontier, our article on single-cell spatial metabolomics.
The Data Structure Mismatch: Pixels vs Spots vs Single Cells
The fundamental computational challenge of spatial multi-omics integration is that these three data modalities — MSI pixels, Visium spots, and single-cell transcriptomes — exist at different spatial scales, have different coordinate systems, and represent fundamentally different measurement entities. A single 55-μm Visium spot may overlap with 4-25 MALDI pixels (depending on MSI resolution) and contain 1-10 cells. Aligning these disparate data structures requires either (a) spatially registering the data to a common coordinate system and aggregating/disaggregating to a shared grid, or (b) using computational methods that can handle un-paired, cross-resolution data without requiring pixel-to-spot correspondence. The 2025-2026 generation of integration tools is built specifically to address this mismatch.
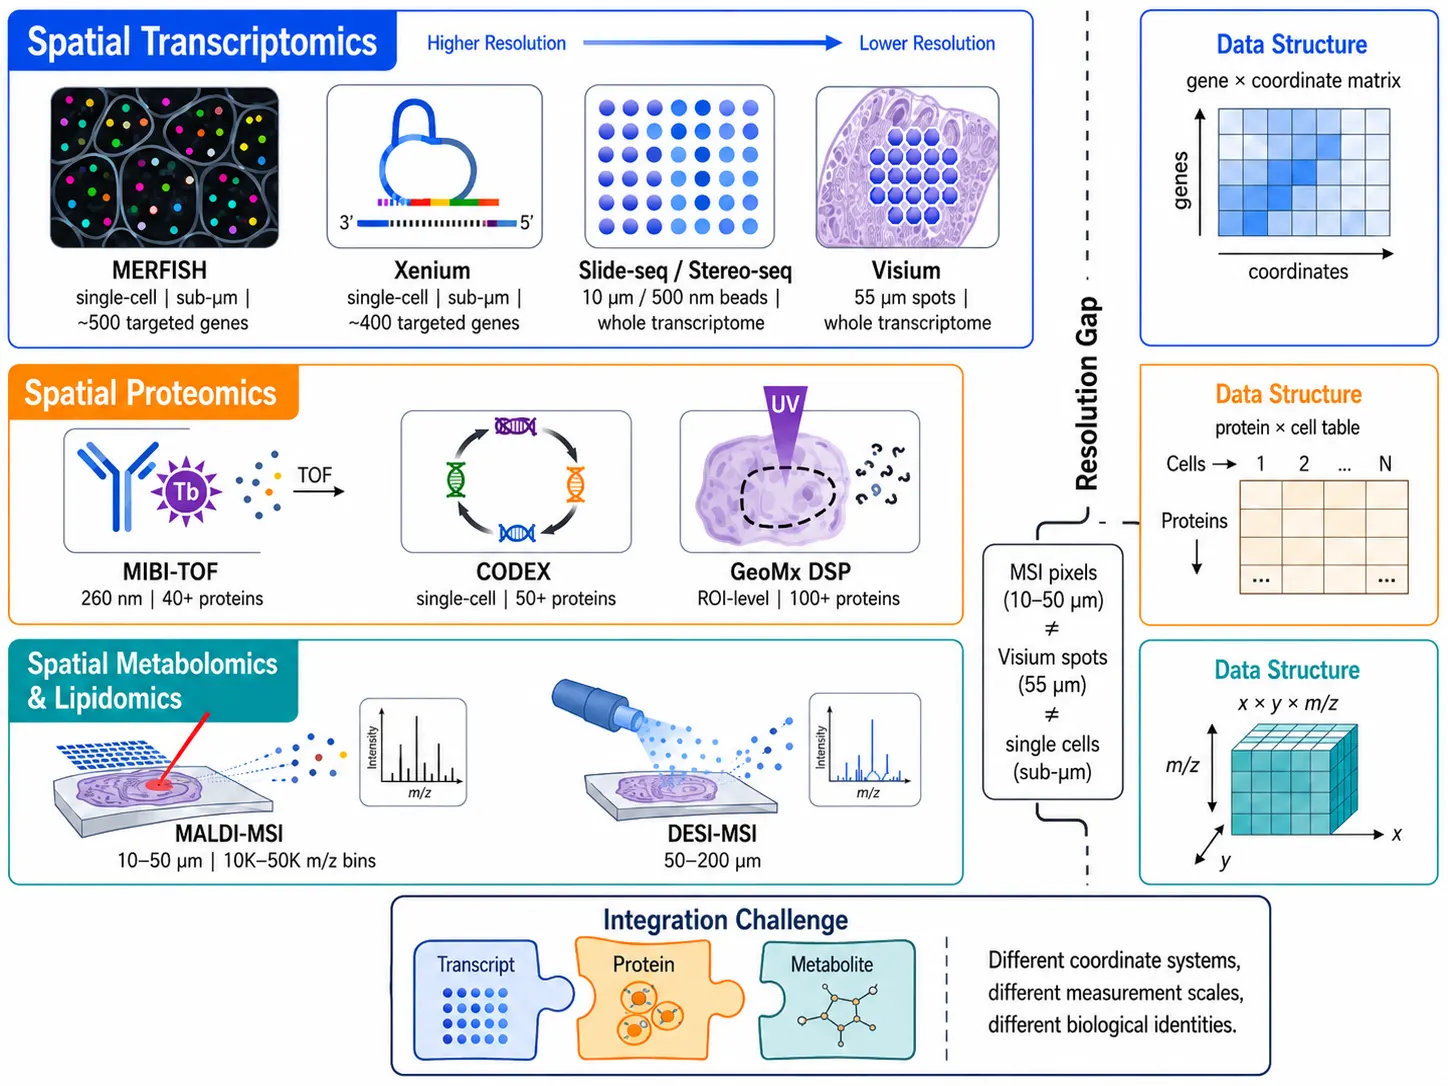 Figure 1: Spatial multi-omics data landscape — modalities, resolution scales, and data structures across transcriptomics, proteomics, and metabolomics platforms
Experimental Design for Integrated Spatial Multi-Omics
Same-Section Multi-Omics: DESI+Visium and MALDI+Xenium — What Is Now Possible
The gold standard of spatial multi-omics is the acquisition of two or more omics layers from the same tissue section, eliminating between-section registration uncertainty. Two landmark 2025 demonstrations established the feasibility: Godfrey et al. demonstrated a sequential DESI-MSI followed by Visium spatial transcriptomics workflow on the same tissue section, showing that ambient ionization MSI leaves the tissue section sufficiently intact for subsequent transcriptomic analysis when applied with controlled spray parameters — the DESI solvent spray removed only the top ~1 μm of the section surface for lipid extraction while preserving mRNA integrity in the remaining tissue depth for Visium capture (Godfrey et al., 2025). Hendriks et al. established the complementary MALDI-MSI followed by Xenium in situ sequencing protocol, using a reduced MALDI laser fluence and minimal matrix application to preserve RNA quality for subsequent Xenium probe hybridization, achieving spatially concordant lipid profiles and single-cell transcriptomes from the same section (Hendriks et al., 2025). The MAGPIE computational framework (Multimodal Alignment of Genes and Peaks for Integrative Exploration) complements these same-section strategies with a computational pipeline for co-registering MALDI-MSI or DESI-MSI metabolomics data with spatial transcriptomics from the same or consecutive tissue sections, enabling spatially integrated multi-omics analysis even when the data are acquired on separate platforms (Williams et al., 2026).
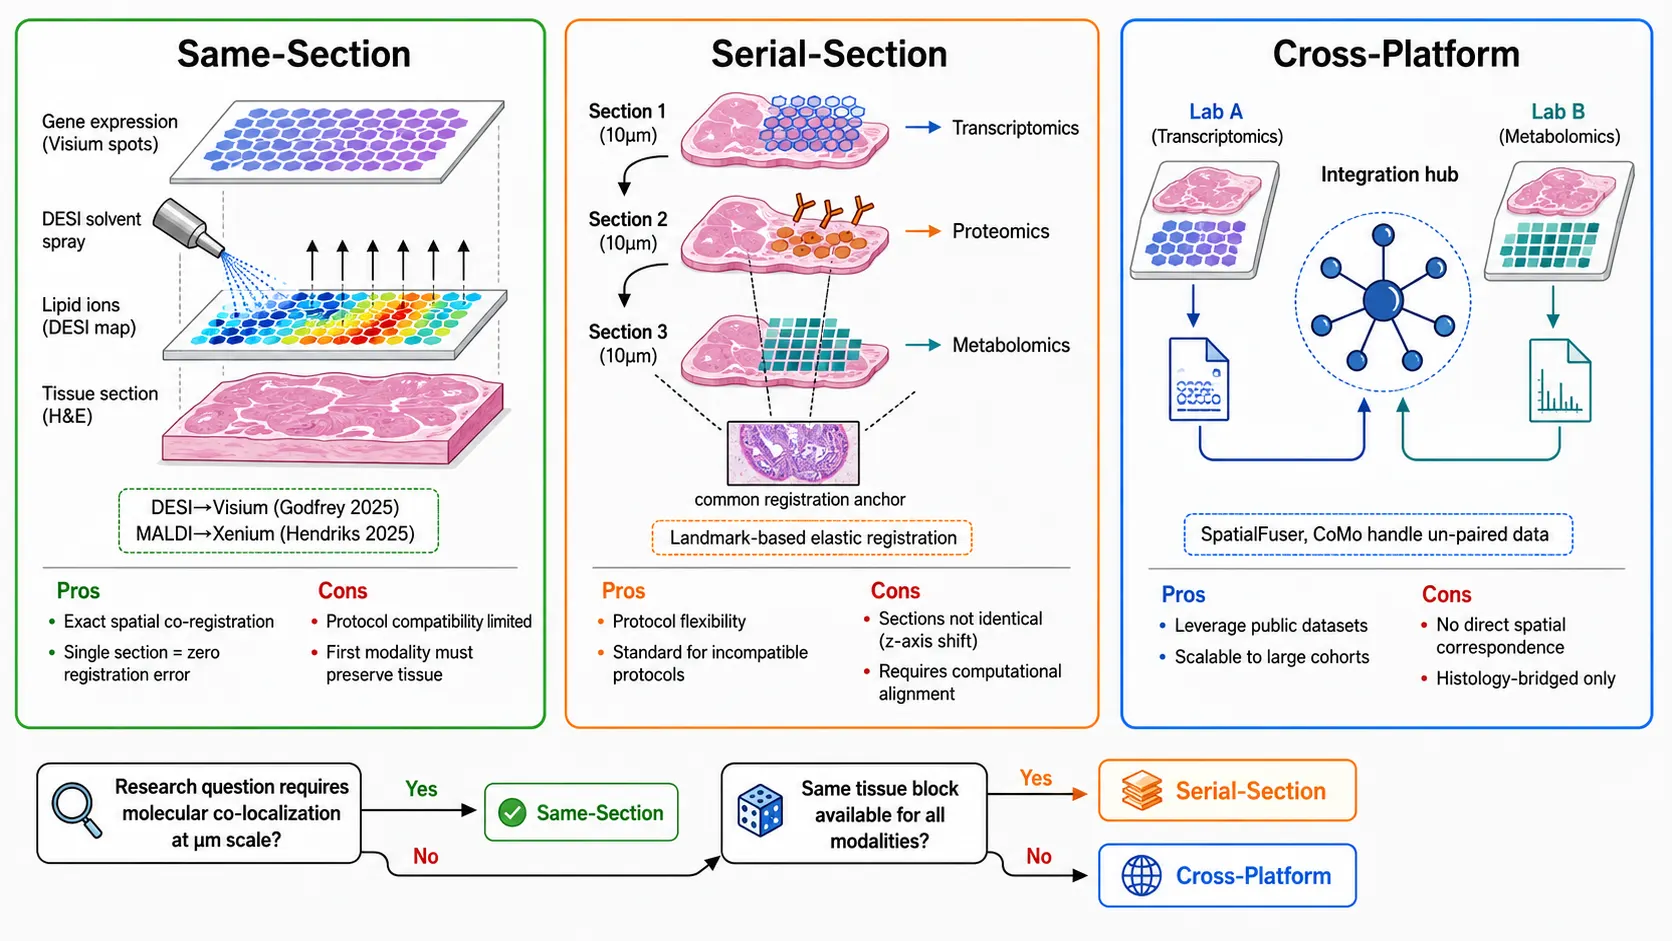 Figure 2: Same-section vs serial-section vs cross-platform integration strategies — side-by-side comparison of experimental designs
Serial-Section Multi-Omics: When Same-Section Is Not Feasible
When same-section integration is precluded — for example, when the transcriptomics protocol requires FFPE fixation that delipidates tissue (making it incompatible with lipid imaging), or when the proteomics panel requires fresh-frozen tissue while the metabolomics protocol needs specific quenching conditions — serial-section multi-omics becomes the practical alternative. In this approach, consecutive tissue sections (typically 10-12 μm thick) are collected, each dedicated to a different omics modality. The critical requirement is computational alignment: because sequential sections are not identical (cellular composition changes every 10-12 μm), integration frameworks must register the sections to a common spatial coordinate system, typically using histological features (H&E images) as anchoring references. The SMART framework (Du et al., 2026) was specifically designed with multi-section integration capabilities, using a graph neural network architecture that accounts for section-to-section variability during integration. For quantitative studies requiring absolute concentration measurements across omics layers, our article on quantitative mass spectrometry imaging calibration strategies provides essential methodological context.
Cross-Platform Integration: Separate Instruments, Separate Samples
The most challenging but also the most scalable experimental design involves integrating spatial omics data acquired on entirely different instrument platforms, from different tissue samples of the same biological condition, potentially in different laboratories. This is the scenario that the 2025-2026 generation of computational integration tools was primarily built to address. SpatialFuser (Cai and Li, 2025) explicitly handles un-paired data — that is, spatial transcriptomics from one set of tissue sections and spatial metabolomics from a different set — without requiring pixel-to-spot correspondence. CoMo (Gui, Xu, and Li, 2026) uses cross-modal contrastive learning to project transcriptomics and metabolomics data into a shared latent space where corresponding biological states cluster together regardless of which modality they were measured in. The cross-platform integration paradigm is essential for leveraging the growing corpus of publicly available spatial omics datasets, where data from different modalities exist for the same tissue type but were never collected from the same sample — let alone the same section.
Decision Framework: Which Integration Strategy for Which Research Question
The choice of integration strategy — same-section, serial-section, or cross-platform — should be driven by the research question, not by platform availability. For studies requiring direct molecular-mechanistic linkage at micrometer resolution (e.g., "does PI3K pathway activation spatially co-localize with phosphoinositide lipid accumulation?"), same-section multi-omics is essential because the molecular events must be co-registered at the same spatial coordinate. For studies requiring multi-omics characterization of tissue architecture across larger regions (e.g., "do spatial metabolomic ecotypes correspond to transcriptional cell-type neighborhoods?"), serial-section integration with computational alignment is sufficient and often more practical. For meta-analyses and atlas-building efforts that aggregate data across multiple studies, cross-platform integration with newer tools like CoMo or SpatialFuser is the appropriate strategy.
Biological Replicate Requirements for Multi-Omics Studies
Multi-omics studies amplify the replication challenge: each biological replicate must generate usable data across multiple modalities, and the failure rate compounds across modalities. If spatial transcriptomics has a 10% failure rate and MALDI-MSI has a 15% failure rate, approximately 23% of samples will fail at least one modality — a calculation that must factor into study design. For discovery-phase multi-omics studies, a minimum of 5-6 biological replicates per condition is recommended; for biomarker validation studies, 20-30 replicates per group are standard. Technical replicates (multiple sections from the same biological sample) are valuable for assessing within-sample variability but cannot substitute for biological replication in statistical inference. Our tissue sectioning services support multi-omics workflows with optimized sectioning protocols for each modality.
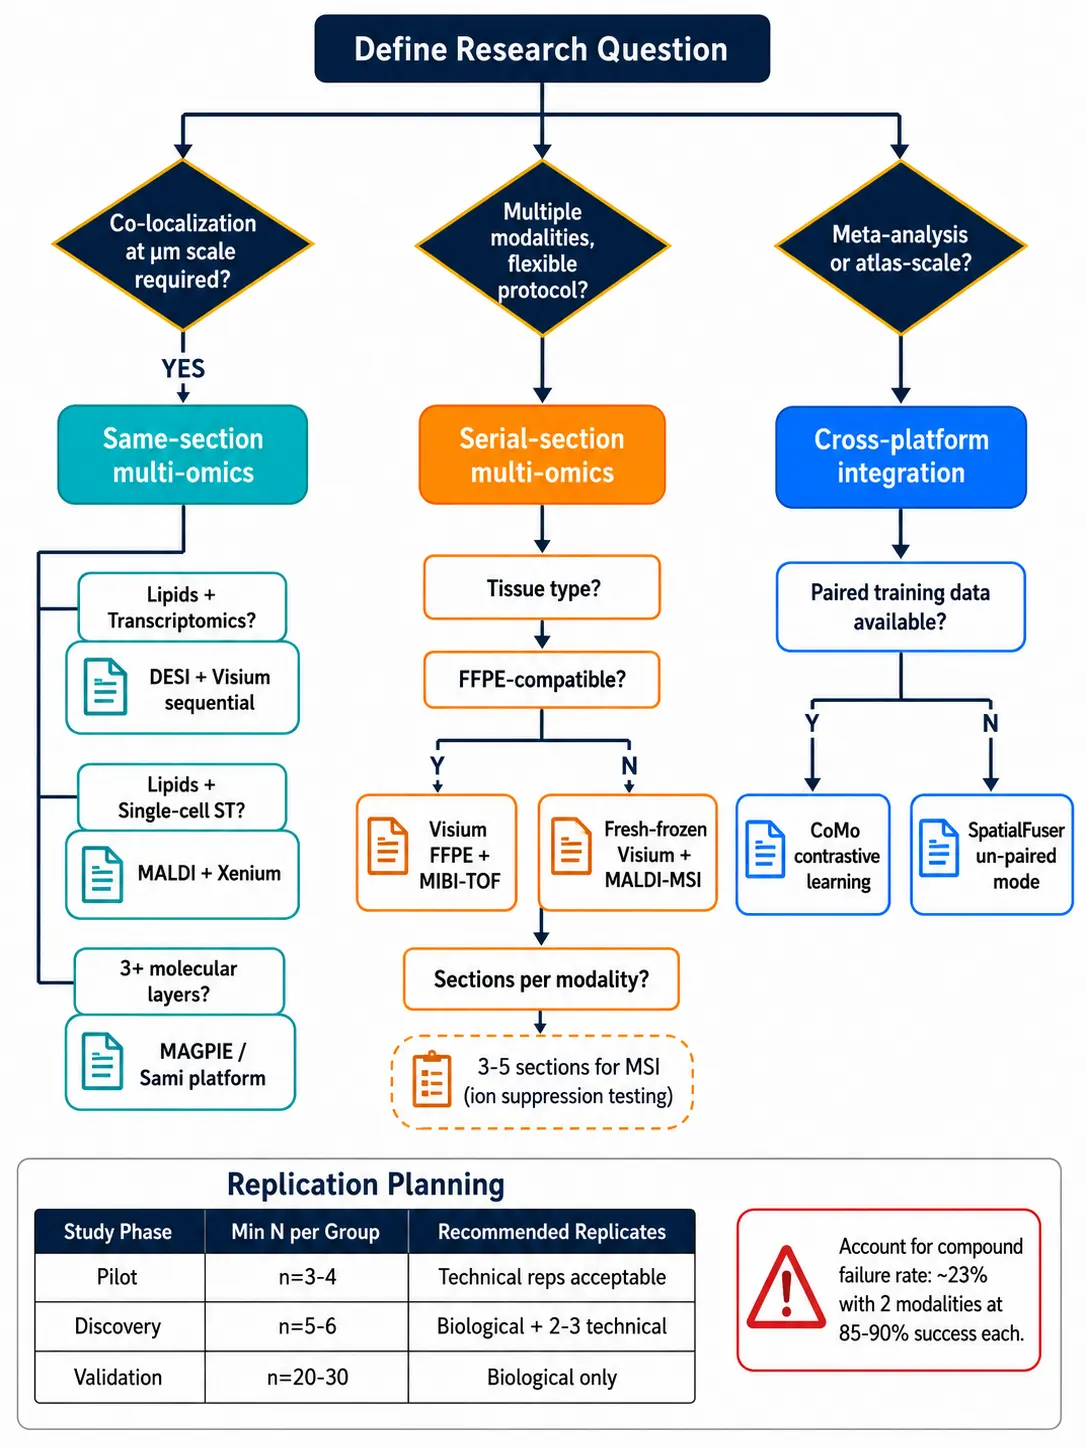 Figure 3: Experimental design decision framework — same-section vs serial-section vs cross-platform integration strategy selection flowchart
Computational Integration Frameworks: The 2025-2026 Landscape
The computational core of integrated spatial multi-omics lies in frameworks that can take two or more spatially resolved datasets — potentially from different platforms, at different resolutions, with different molecular coverage — and produce a unified representation that preserves the spatial organization of the tissue while revealing cross-modality relationships that neither dataset could reveal alone. The 2025-2026 period has seen an explosion of such tools, representing a paradigm shift from simple concatenation or correlation-based integration to methods employing deep learning, graph neural networks, and nonlinear correction. Six frameworks represent the current state of the art, each with distinct strengths.
SpatialCOC: Cross-Omics Correction with Nonlinear Correlation
SpatialCOC (Li M et al., 2026, Nature Communications) introduces a cross-omics correction framework that explicitly models nonlinear relationships between modalities while preserving spatial smoothness constraints. Unlike earlier linear integration approaches that assume a simple correlation structure between gene expression and metabolite abundance, SpatialCOC uses a nonlinear embedding that captures the reality of biological regulation — for instance, a metabolite concentration might show a threshold-dependent relationship with enzyme expression (no correlation below a certain expression level, strong correlation above it). The method also incorporates spatial autocorrelation as a regularization term, penalizing integration solutions that produce biologically implausible discontinuities in the spatial domain. SpatialCOC has been validated on paired MALDI-MSI and Visium datasets from human colorectal cancer and mouse brain, demonstrating improved cross-omics predictive accuracy compared to linear canonical correlation analysis baselines (Li M et al., 2026).
SMART: Graph Neural Networks for Multi-Section, 3+ Omics Integration
SMART (Spatial Multi-omics Alignment with Relational Transformer; Du Z et al., 2026, Nature Communications) is built on a graph neural network architecture that models each spatial measurement (pixel, spot, or cell) as a node in a graph, with edges representing both spatial proximity and cross-modality relationships. The key innovation of SMART is its ability to handle three or more omics modalities simultaneously — for instance, integrating Visium transcriptomics, MIBI-TOF proteomics, and MALDI-MSI metabolomics from the same tissue block. The graph structure naturally accommodates different spatial scales, because edges can connect nodes at different levels of the resolution hierarchy without requiring them to be on the same grid. SMART was validated on triple-omics datasets from ovarian cancer and demonstrated that three-modality integration improved cell-type deconvolution accuracy by 17% compared to transcriptomics-only analysis (Du Z et al., 2026).
SpatialFuser: Un-Paired Data and Cross-Resolution Integration
SpatialFuser (Cai and Li, 2025, bioRxiv) addresses what is perhaps the most practically common scenario in spatial multi-omics: the need to integrate datasets that were never acquired from the same tissue sample. Its architecture uses a conditional generative approach that learns the joint distribution of spatial transcriptomics and spatial metabolomics data from paired training examples, then extends to un-paired inference — predicting what the metabolomics profile "would look like" at transcriptomics coordinates, and vice versa. SpatialFuser also handles cross-resolution integration, where one modality may have much finer spatial resolution than the other, by incorporating a resolution-matching module that can upsample or aggregate data as needed. The framework was validated across four tissue types and three omics modalities, showing robust performance even when modalities were weakly correlated (Pearson r < 0.3) (Cai and Li, 2025).
CoMo: Cross-Modal Graph Contrastive Learning
CoMo (Gui, Xu, and Li, 2026, Briefings in Bioinformatics) employs graph contrastive learning — a self-supervised learning paradigm — to project spatial transcriptomics and spatial metabolomics data into a shared latent representation space. In this space, spatially proximal regions with similar multi-omics profiles are embedded close together regardless of which modality they were measured in, while regions with genuinely different biological states are embedded far apart. The contrastive learning objective (pulling "positive pairs" together, pushing "negative pairs" apart) is defined using spatial proximity as the positive-pair criterion: two measurements from spatially adjacent regions in the same tissue are assumed to represent the same biological state and should therefore have similar latent representations. The method is computationally efficient (processing a full Visium slide plus MALDI-MSI dataset in under 30 minutes on a single GPU) and handles missing modalities gracefully — a region measured only by transcriptomics can still be embedded in the shared space and compared with regions measured only by metabolomics (Gui, Xu, and Li, 2026).
COSIE: Modality Prediction and Histology Integration
COSIE (Cross-Omics Spatial Inference Engine; Li W et al., 2026, bioRxiv, Shalek Lab, MIT) was validated across 12 diverse datasets — the broadest validation of any spatial multi-omics integration tool to date. Its distinctive feature is the incorporation of histology images (H&E or IHC) as a third data channel that bridges transcriptomics and metabolomics. Because histological features are preserved in both transcriptomics and metabolomics workflows (both typically image the tissue before molecular analysis), histology provides a universal spatial reference frame. COSIE uses a convolutional neural network to extract histological features, aligns them with the spatial coordinates of each omics modality, and then performs modality prediction — inferring metabolite abundance from transcriptomics + histology, or gene expression from metabolomics + histology. The histology bridge improved cross-modality prediction accuracy by 12-18% across datasets compared to omics-only integration (Li W et al., 2026).
spammR: End-to-End Spatial Multi-Omics R Package for MS Data
spammR (Mahlich et al., 2026, Bioinformatics Advances) is the first R/Bioconductor package explicitly designed for MS-centric spatial multi-omics analysis. Unlike the Python-centric ecosystem of most other tools, spammR provides an R-native workflow that integrates with the Cardinal and MoleculeExperiment packages for MSI data handling and with Seurat/SpatialExperiment for spatial transcriptomics data. The package implements normalization, spatial alignment via landmark-based registration, univariate cross-modality correlation testing, and multivariate integration via multi-block partial least squares and multi-omics factor analysis (MOFA). For experimental researchers who prefer the R environment, spammR lowers the computational barrier to spatial multi-omics analysis significantly — the entire workflow, from raw imzML and spaceranger outputs to integrated visualizations, can be executed in a single R script with ~50 lines of code. Our bioinformatics analysis for metabolomics service supports these computational workflows for researchers who need expert analytical support (Mahlich et al., 2026).
Decision Matrix: Selecting the Right Computational Framework
| Framework | Best For | Requires Paired Data? | 3+ Omics | Language | Key Strength |
|---|---|---|---|---|---|
| SpatialCOC | Nonlinear cross-omics relationships | Yes | No | Python | Nonlinear correction + spatial smoothness |
| SMART | Three or more omics layers | Yes | Yes | Python | GNN architecture handles multi-section |
| SpatialFuser | Un-paired datasets | No | No | Python | Cross-resolution, weakly correlated modalities |
| CoMo | Missing modalities, fast integration | Flexible | No | Python | Contrastive learning, 30-min runtime |
| COSIE | Histology-bridged integration | Flexible | No | Python | H&E image integration, most validated |
| spammR | MS-centric, R-native workflows | Yes | No | R | End-to-end R pipeline, Cardinal+Seurat |
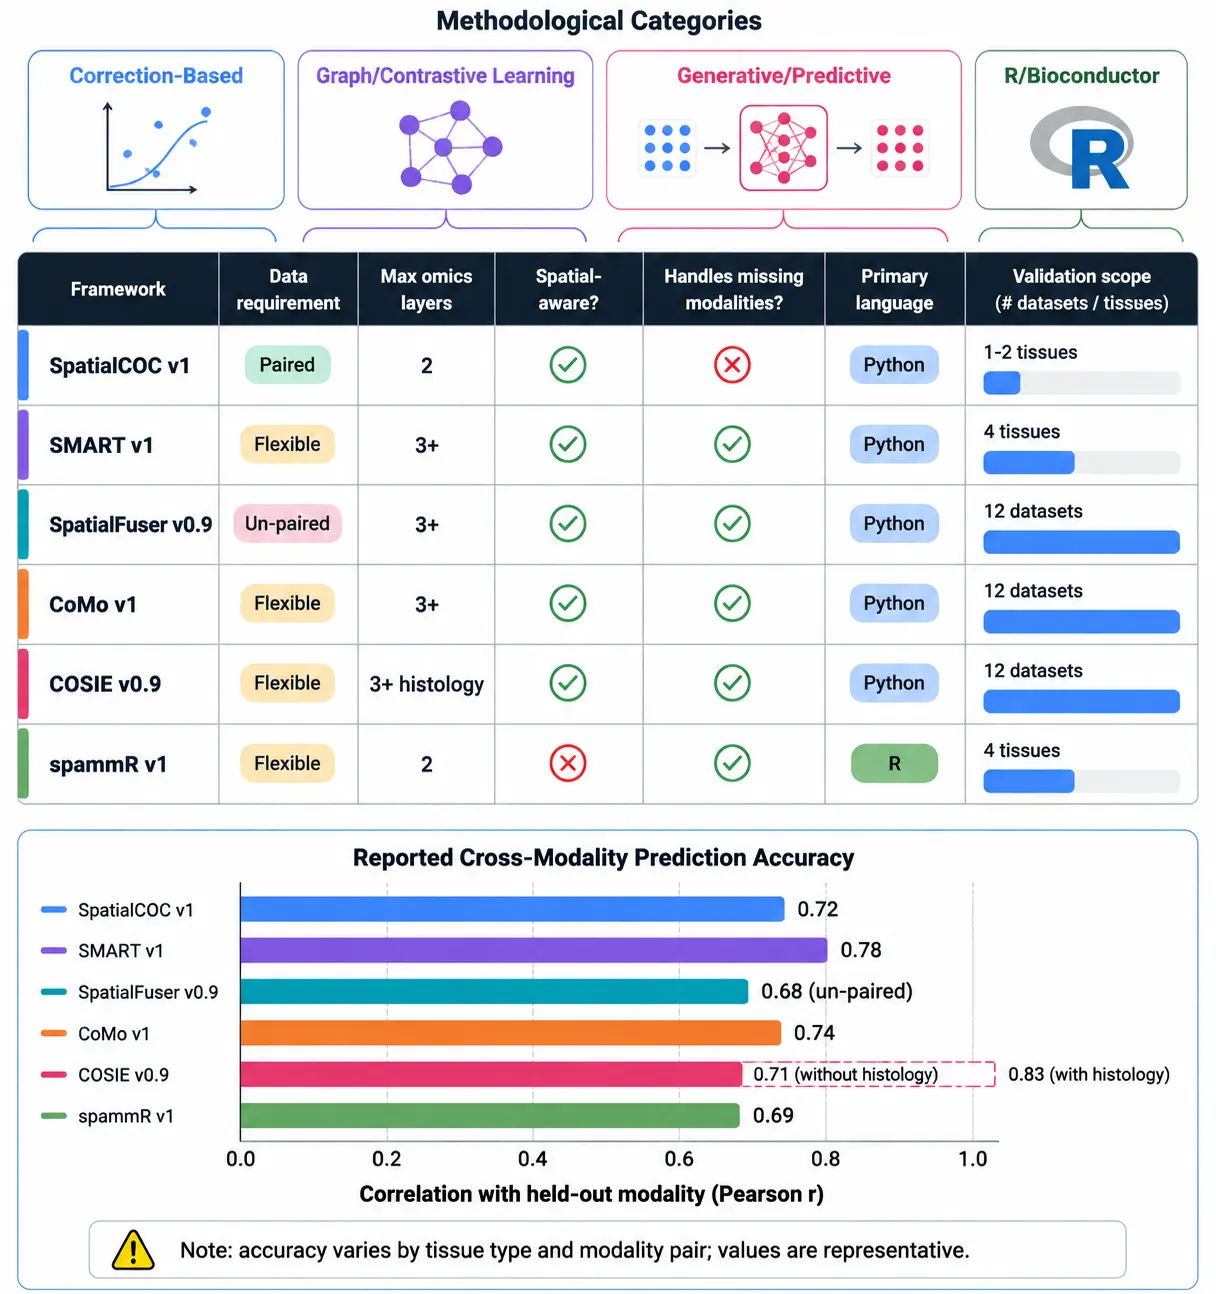 Figure 4: Six computational integration frameworks — capability comparison matrix with key features and validation benchmarks
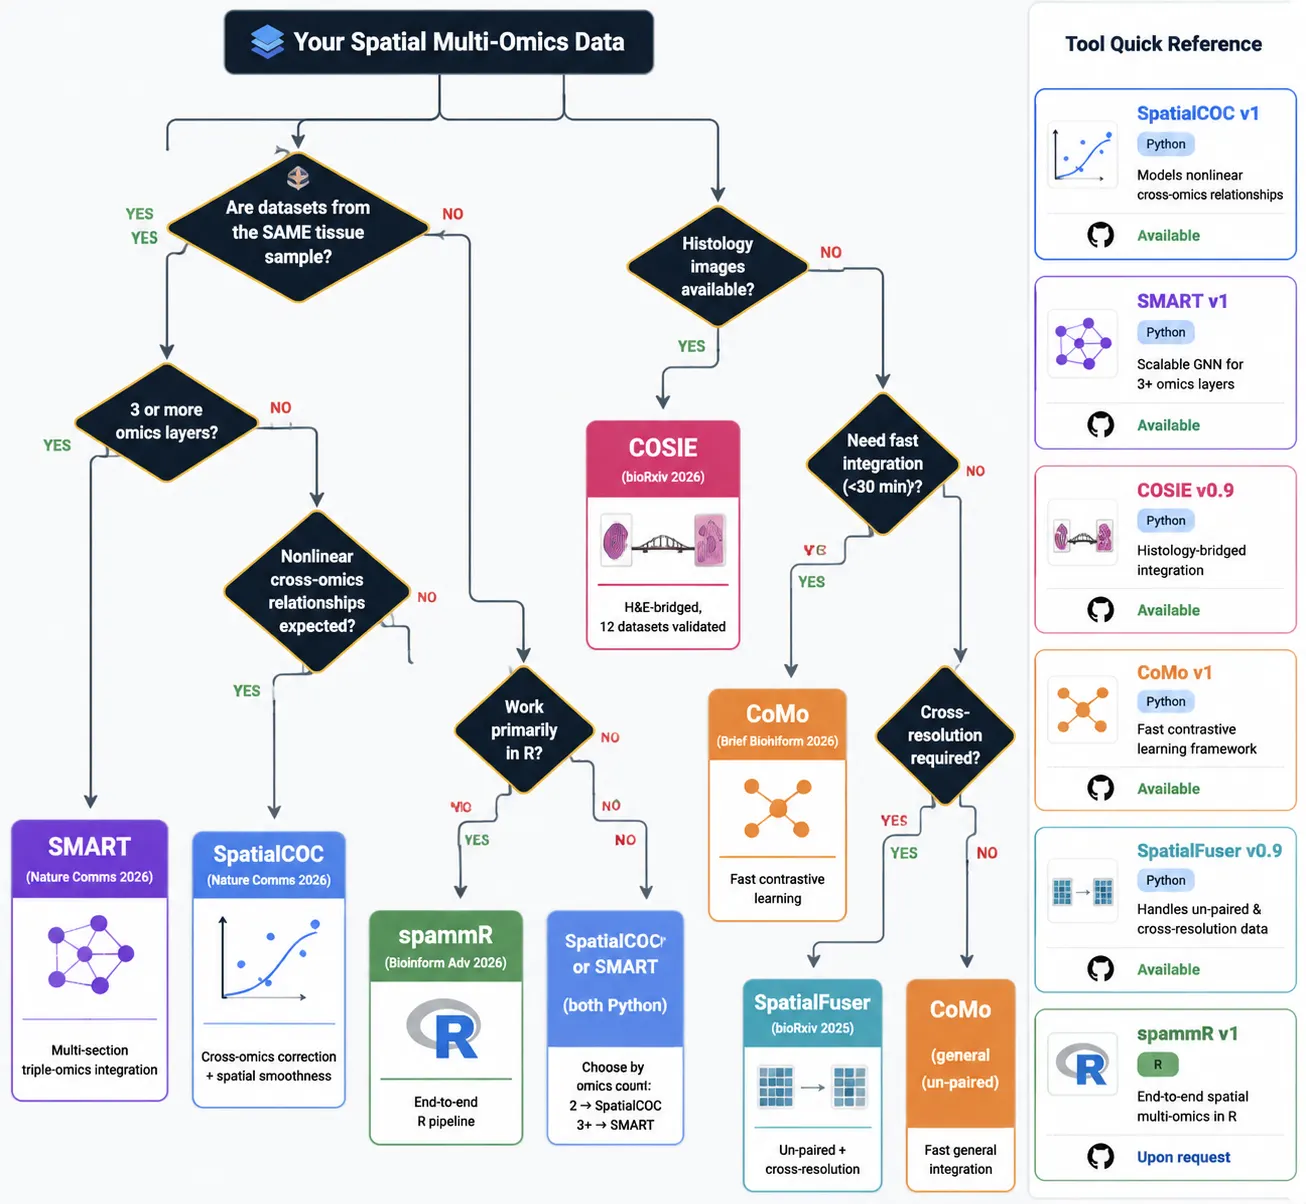 Figure 5: Computational framework decision flowchart — data types, correlation strength, and resolution match leading to recommended tool
The Metabolomics Integration Challenge: Why MSI Is the Hardest Piece of the Puzzle
Why MSI Data Is Harder to Integrate
Of the three major spatial omics modalities, metabolomics presents the greatest integration challenge — and simultaneously offers the greatest biological reward. The difficulty arises from four distinct features of MSI data. First, MSI features lack gene-level annotation: while a transcriptomics measurement of "ENSG00000145675" maps directly to the PIK3CA gene with known function, pathway membership, and protein product, an MSI feature at m/z 885.55 has no inherent biological identity — it must be annotated through accurate mass matching, MS/MS fragmentation, and database searching, and even then, only 5-15% of detected MSI features typically receive confident annotations. Second, MSI and spatial transcriptomics operate in fundamentally different coordinate systems: MSI pixels form a regular rectangular grid at 10-50 μm pitch defined by the instrument's laser step size, while Visium spots are hexagonal arrays of 55-μm-diameter circles, and single-cell data like Xenium/MERFISH have irregular cell-segmented coordinates — alignment between these coordinate systems is non-trivial. Third, MSI data exhibit strong batch effects across acquisition days, slides, and even within-slide position (tissue edge effects, matrix heterogeneity) that must be corrected before cross-modality comparison. Fourth, the dynamic range and error structure differ fundamentally: MSI intensity counts follow a log-normal distribution with multiplicative noise, while UMI-based transcriptomics counts follow a negative binomial distribution — statistical models that assume normality fail on both data types simultaneously.
haCCA: Hierarchical Canonical Correlation Analysis for ST + MALDI Integration
The haCCA framework (Xu J et al., 2026, Communications Biology) was specifically developed to bridge spatial transcriptomics and MALDI-MSI data. The method extends classical canonical correlation analysis (CCA) — which finds linear combinations of variables from two datasets that maximize their correlation — with a hierarchical structure that first identifies broad tissue compartments using shared spatial patterns, then refines integration within each compartment. This hierarchical approach is important because the relationship between gene expression and metabolite abundance differs fundamentally across tissue compartments: the gene-metabolite correlation structure in the tumor core (where both transcript and metabolite profiles are dominated by proliferation-related pathways) is completely different from the structure at the tumor-stroma interface (where immune infiltration genes correlate with inflammatory lipid mediators). haCCA accounts for this compartment-specific correlation structure, avoiding the dilution of signal that occurs when a single global CCA model is applied across heterogeneous tissue. Validated on paired ST and MALDI-MSI data from mouse brain, haCCA identified compartment-specific gene-metabolite correlations that global CCA missed (Xu J et al., 2026).
Metabolome-Lipidome-Glycome Sequential Imaging from a Single Section
Clarke et al. (2025, Nature Communications) demonstrated the most ambitious same-section multi-omics workflow to date with the Sami platform: sequential extraction and MSI analysis of metabolites, lipids, and N-glycans from a single tissue section. The workflow uses sequential solvent extraction — first aqueous-methanol for polar metabolites, then organic solvent for lipids, then PNGase F enzymatic release for N-glycans — with MSI acquisition between each extraction step. Critically, the spatial integrity of the tissue is maintained throughout the sequential extraction process because each step removes only the targeted molecular class, leaving the remaining tissue architecture and the bulk of other molecular classes intact. The result is three spatially aligned molecular images from the same tissue coordinates: a metabolomics map, a lipidomics map, and a glycomics map. Applied to human pancreatic cancer tissue, the triple-layer imaging revealed coordinated metabolic reprogramming — specifically, a spatial correlation between GlcCer(d18:1/24:0) accumulation, increased lactate, and specific N-glycan structural shifts in tumor regions adjacent to fibrotic stroma — that was invisible in any single omics layer (Clarke et al., 2025).
Multimodal Elemental + Lipid + Protein Imaging from a Single Section
Beyond the metabolome-lipidome-glycome axis, an emerging frontier is the integration of elemental imaging (LA-ICP-MS) with molecular imaging. Because LA-ICP-MS ablates only the top few nanometers of the tissue surface while MALDI extracts from the top several micrometers, sequential LA-ICP-MS followed by MALDI-MSI on the same section is technically feasible. This enables spatial correlation of metal distributions (Fe, Zn, Cu, Mn — essential cofactors for hundreds of enzymes) with lipid and metabolite distributions, adding a fourth omics layer that reports on metalloenzyme activity potential at each tissue coordinate.
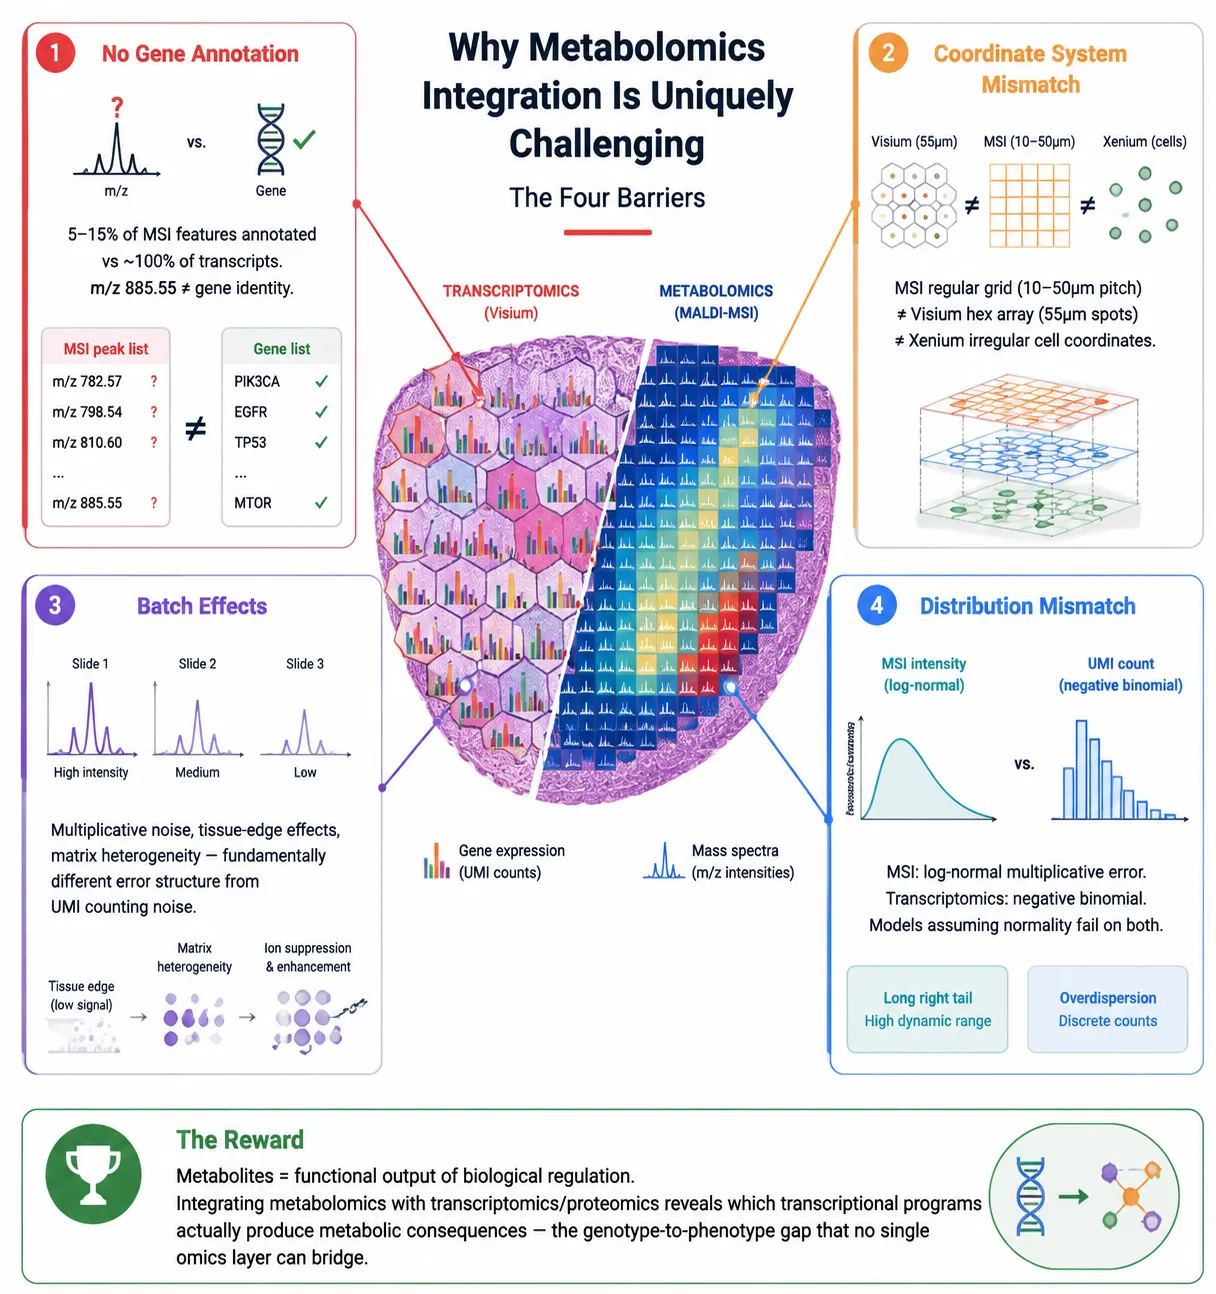 Figure 6: The metabolomics integration challenge — data structure mismatch between MSI pixels, ST spots, and single-cell coordinates
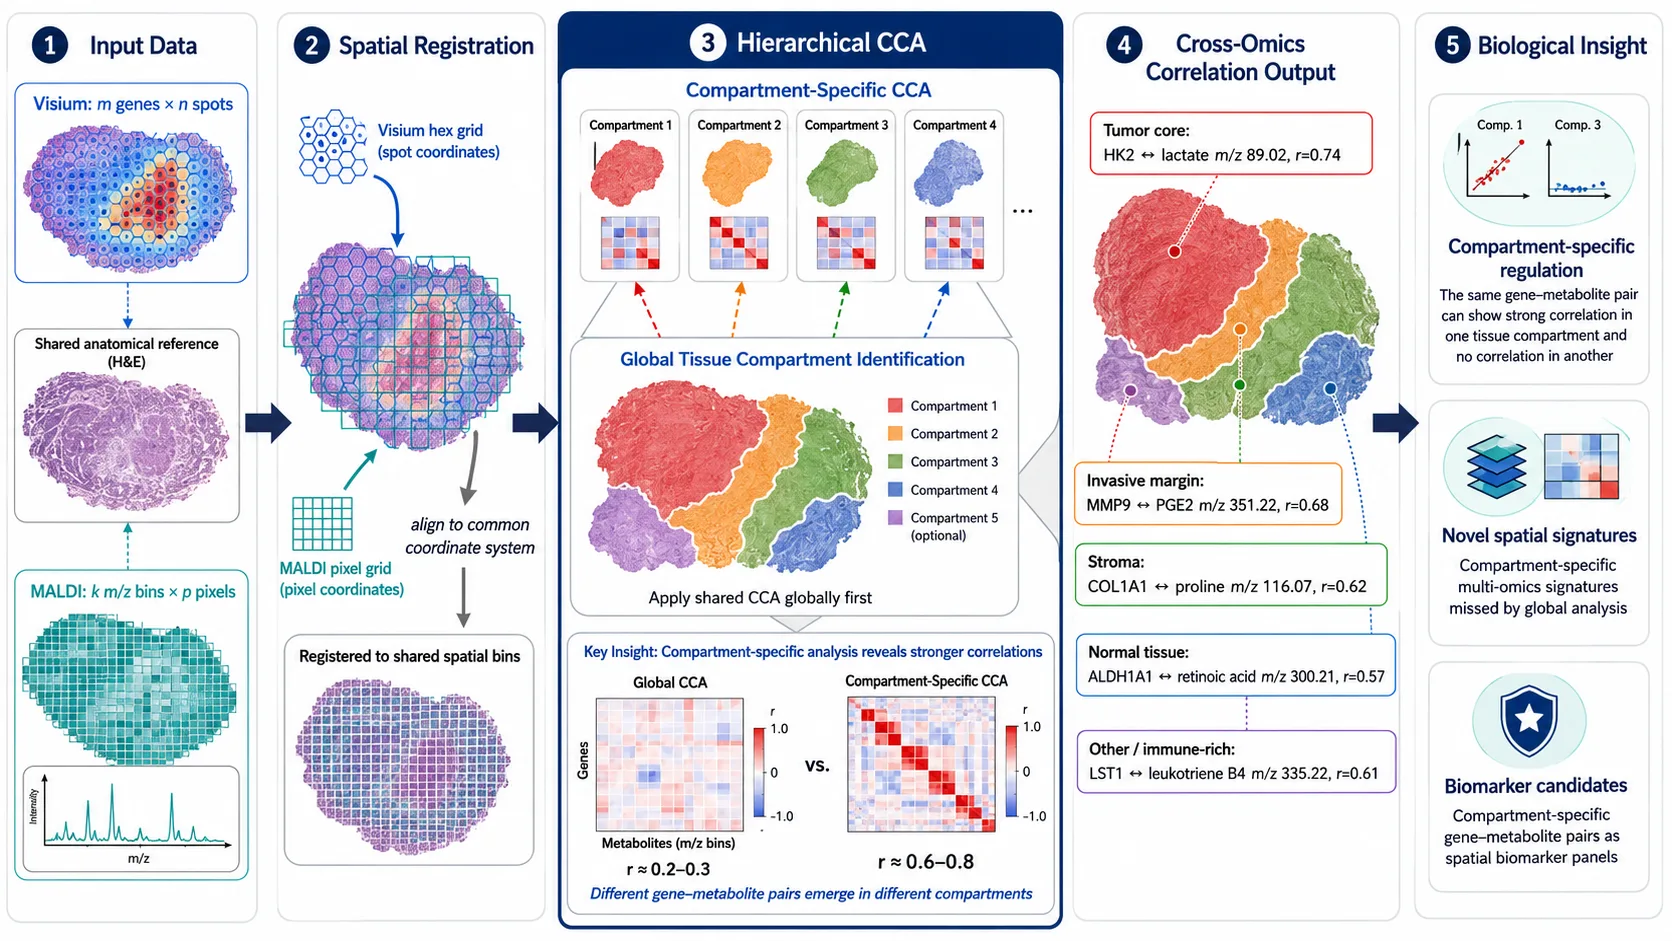 Figure 7: haCCA hierarchical integration workflow — from paired ST and MALDI-MSI data to compartment-specific cross-omics correlations
Data Preprocessing and Harmonization Across Modalities
Spatial Alignment and Registration Across Sections and Platforms
The first computational step in any spatial multi-omics integration pipeline is spatial registration — aligning the coordinate systems of the different omics datasets so that corresponding tissue locations can be compared. For same-section workflows, registration is relatively straightforward because the tissue section itself provides a common physical reference; fiducial markers or tissue landmarks (distinctive histological features) can be identified in the pre-acquisition optical images that both MSI and spatial transcriptomics platforms capture. For serial-section workflows, the registration problem is more challenging because consecutive sections are not identical — they differ subtly in tissue morphology, and the z-axis displacement means that cellular composition changes. Landmark-based affine or elastic (non-rigid) registration using H&E images as the common reference is the standard approach, with the elastic methods (B-spline, diffeomorphic demons) preferred for complex tissue geometries. For cross-platform integration where sections come from different tissue blocks, registration to a common anatomical atlas (e.g., Allen Brain Atlas for neuroscience, a common organ-specific reference for cancer) becomes the practical standard, trading spatial precision for scalability.
Normalization Strategies for Cross-Modality Comparison
Normalization is arguably the most critical preprocessing decision in spatial multi-omics, because each modality has fundamentally different sources of technical variation that must be addressed before cross-modality comparison is meaningful. Spatial transcriptomics data are typically normalized to library size (total UMI counts per spot) followed by log-transformation — the standard scran/SCTransform pipeline. MSI data are typically normalized to total ion current (TIC), which corrects for pixel-to-pixel variation in ionization efficiency but can compress biologically meaningful signals. When integrating transcriptomics and metabolomics, the key principle is that normalization should be performed within each modality independently, using modality-appropriate methods, before cross-modality integration — cross-modality normalization (e.g., quantile normalization across transcriptomics and metabolomics data) destroys the biological scale differences that are themselves informative. For a deeper treatment of normalization in quantitative MSI, see our article on quantitative MSI calibration strategies.
Batch Effect Correction in Multi-Omics Datasets
Multi-omics batch effects are doubly complex: there are intra-modality batch effects (slide-to-slide variation in MALDI-MSI, sequencing lane effects in transcriptomics) and inter-modality batch effects (systematic differences in the relationship between transcript and metabolite abundances across experimental batches). The 2025-2026 generation of tools addresses both. SpatialCOC's cross-omics correction explicitly models batch as a covariate in the nonlinear integration model. SMART uses a batch-aware graph construction that connects nodes within the same batch more strongly than across batches during the graph neural network message-passing step. CoMo's contrastive learning framework can be trained with batch labels as negative pairs, encouraging the model to learn batch-invariant representations. For researchers using spammR, the ComBat function adapted for spatial data (from the Cardinal package) handles intra-modality batch correction before the integration step.
Key Applications of Integrated Spatial Multi-Omics
Tumor Microenvironment Ecosystem Mapping
The tumor microenvironment is the most active application domain for integrated spatial multi-omics, because TME biology is inherently multi-layered: immune cell infiltration patterns (transcriptomics), checkpoint protein expression gradients (proteomics), and metabolic competition between tumor and immune cells (metabolomics) all operate simultaneously at the same spatial coordinates. Integrated analysis of spatial transcriptomics and spatial metabolomics has revealed that T-cell exhaustion markers (PD-1, TIM-3) co-localize not simply with tumor cell density but specifically with tumor regions exhibiting high glycolytic activity — a metabolic correlate invisible to transcriptomics-only analysis (Agrawal and Thomann, 2026). The AJP review by Agrawal and Thomann (2026) provides a comprehensive survey of how spatial multi-omics is reshaping TME biology, from metabolic-immune crosstalk mechanisms to clinical biomarker strategies.
Brain Atlasing: Multi-Omics Spatial Brain Maps
The Allen Brain Atlas and Human Cell Atlas initiatives have spurred the creation of multi-omics spatial brain atlases that combine transcriptomic cell-type maps with metabolomic and lipidomic tissue maps. Lu et al. (2025) demonstrated a 3D spatial multi-omics reconstruction of Alzheimer's disease brain tissue, combining MALDI-MSI metabolomics, lipidomics, and spatial proteomics across serial sections reconstructed into a three-dimensional multi-omics volume. The 3D reconstruction revealed that amyloid-beta plaque-adjacent regions exhibit a specific metabolic signature — elevated ceramide species, depleted phosphatidylethanolamines, and increased acylcarnitines — that extends approximately 100-150 μm from the plaque boundary, defining a metabolic penumbra around plaques that had not been visible in 2D analyses (Lu et al., 2025).
Drug Mechanism of Action: Spatial Pharmaco-Multi-Omics
Integrated spatial multi-omics provides a uniquely powerful tool for understanding drug mechanism of action by simultaneously mapping the drug's spatial distribution (MSI of the drug and its metabolites), the transcriptional response (spatial transcriptomics of drug-treated tissue), and the metabolic response (spatial metabolomics showing pathway-level metabolic changes). This triple readout resolves the spatial chain of drug action: where the drug goes → which cells respond transcriptionally → how metabolism changes functionally. The approach has been applied to understanding heterogeneous response to kinase inhibitors in tumor xenografts, revealing that drug penetration is necessary but not sufficient for transcriptional response — some tumor regions with equivalent drug exposure show no transcriptomic response, a finding that metabolomics data attributed to differential redox buffering capacity across tumor subclones.
Developmental Biology: Spatiotemporal Multi-Omics Trajectories
Embryonic development is the ultimate spatial multi-omics problem: a single cell gives rise to hundreds of cell types arranged in precise spatial patterns, with each developmental stage defined by coordinated changes across the transcriptomic, proteomic, and metabolomic layers. Spatial multi-omics of developing tissues — combining spatial transcriptomics for cell-type trajectories with spatial metabolomics for metabolic state — is revealing that metabolic transitions (e.g., the switch from glycolysis to oxidative phosphorylation during cardiomyocyte maturation) precede and potentially drive transcriptional maturation programs, rather than simply resulting from them. This temporal offset between metabolic and transcriptomic change — metabolism shifts first, transcription follows — is a consistent finding across cardiac, neural, and hepatic developmental systems and represents a fundamental insight that only multi-omics analysis could provide.
[Figure 8: Application gallery — TME ecosystem mapping, brain atlasing, drug MoA, and developmental biology with representative spatial multi-omics outputs]
Challenges and Future Directions
Computational Scalability for Terabyte-Scale Multi-Omics
A single high-resolution MALDI-MSI dataset at 10 μm pixel size over a 1 cm² tissue section generates approximately 10⁶ pixels × 5 × 10⁴ m/z bins = 5 × 10¹⁰ intensity values — roughly 100 GB in raw form. A Xenium dataset covering the same area at single-cell resolution with 500 genes in 10⁶ cells generates approximately 5 × 10⁸ expression values — another ~10 GB. Integrated analysis at this scale, potentially across dozens of samples, pushes computational infrastructure requirements into the terabyte range. The 2025-2026 generation of tools is addressing this through on-disk data representations (spammR uses HDF5-backed DelayedArray objects for out-of-memory computation), GPU acceleration (SMART and CoMo leverage GPU-based graph operations and contrastive loss computation), and downsampling strategies (COSIE uses histological feature-guided stratified sampling to reduce the pixel count while preserving spatial coverage). Nonetheless, computational scalability remains the primary bottleneck for large-scale, high-resolution spatial multi-omics studies.
AI Foundation Models for Spatial Multi-Omics
The success of foundation models in natural language processing (GPT series) and protein structure prediction (AlphaFold) has inspired a parallel effort in spatial biology. The concept: train a large transformer-based model on millions of spatial omics measurements from diverse tissues, species, and modalities, learning a universal "spatial biology embedding" that can be fine-tuned for specific tasks — imputing missing modalities, predicting drug response from spatial multi-omics profiles, or generating virtual spatial omics data from histology images alone. COSIE's modality prediction capability (Li W et al., 2026) and SpatialFuser's un-paired inference (Cai and Li, 2025) can be considered early precursors to such foundation models. The key challenge is data scale and diversity: while a GPT model trains on trillions of words, the largest spatial omics corpus today contains perhaps tens of thousands of datasets, spanning incompatible formats, different spatial resolutions, and non-overlapping molecular panels — a data integration challenge orders of magnitude harder than text tokenization.
Toward Computationally Complete Spatial Omics: Predicting Unmeasured Modalities
The most ambitious frontier in spatial multi-omics is the concept of computationally complete spatial profiling: measuring one or two modalities experimentally and computationally predicting the remaining, unmeasured modalities. COSIE has demonstrated the feasibility of predicting metabolite distributions from transcriptomics + histology (Li W et al., 2026), and virtual spatial proteomics from H&E images is an active area of development. The logical endpoint is a model that, given a single H&E-stained tissue section, can predict the spatial distribution of transcripts, proteins, and metabolites — a virtual complete spatial omics profile. While this goal remains aspirational, the rapid progress in 2025-2026 suggests that computationally augmented spatial omics — where experimental measurement of key modalities is enriched by computational prediction of correlated modalities — will become a practical reality within the next several years.
FAQ
What is the difference between same-section and serial-section spatial multi-omics integration?
Same-section integration acquires two or more omics layers from the same tissue section (e.g., DESI-MSI followed by Visium on the same section), ensuring exact spatial co-registration but constraining protocol compatibility — the first acquisition must not destroy the tissue for the second modality. Serial-section integration uses consecutive tissue sections (typically 10-12 μm apart), each dedicated to one modality, with computational alignment to register the separate coordinate systems. Same-section provides higher spatial confidence; serial-section provides greater protocol flexibility.
Which computational integration framework should I use for my spatial multi-omics data?
The choice depends on your data structure: if you have paired (same-section or adjacent-section) data from 3+ modalities, SMART offers the most comprehensive multi-omics handling. If you have un-paired data (different modalities from different samples), SpatialFuser is designed for this scenario. If histology images are available, COSIE's histology bridge can improve integration accuracy. If you work primarily in R, spammR provides the most accessible workflow. If you need nonlinear cross-omics correction, SpatialCOC is the best choice. See the decision matrix in the Computational Integration Frameworks section above.
Why is metabolomics harder to integrate than transcriptomics or proteomics?
Four reasons: (1) MSI features lack gene-level annotation — only 5-15% of detected m/z peaks can be confidently assigned to specific metabolites, compared to essentially 100% of transcriptomics features (genes) having known identities. (2) MSI coordinate systems (regular pixel grids) differ from Visium spot arrays or single-cell coordinates, requiring non-trivial spatial registration. (3) MSI data exhibit complex batch effects (inter-slide, intra-slide, tissue-edge) with different statistical properties than transcriptomics batch effects. (4) The data distributions differ fundamentally — MSI intensities are approximately log-normal, UMI counts are negative binomial — requiring specialized statistical models that accommodate both.
How many biological replicates do I need for a spatial multi-omics study?
For discovery-phase studies, 5-6 biological replicates per condition is the recommended minimum, accounting for the compound failure rate across modalities (~23% when combining spatial transcriptomics with 10% failure rate and MALDI-MSI with 15% failure rate). For biomarker validation, 20-30 replicates per group are standard. Technical replicates (multiple sections from the same sample) should not be counted as biological replicates for statistical inference — the statistical unit of analysis is the biological individual, not the tissue section.
Can I integrate spatial transcriptomics data from one lab with spatial metabolomics data from another lab?
Yes — this is the cross-platform integration scenario, and tools like SpatialFuser and CoMo are specifically designed for it. The key requirements are: (a) both datasets should represent the same tissue type and comparable biological conditions, (b) both datasets should include H&E or equivalent histological images for spatial registration to a common anatomical reference, and (c) batch correction methods should be applied to account for inter-laboratory technical variation. Cross-platform integration is not as spatially precise as same-section integration, but it enables the analysis of far larger and more diverse sample cohorts.
What is the future of integrated spatial multi-omics?
Three converging trends define the near-term future: (1) AI foundation models trained on millions of spatial omics measurements that can predict unmeasured modalities from measured ones — effectively creating virtual complete spatial omics profiles from partial data. (2) Experimental workflows that achieve same-section multi-omics with four or more molecular layers (the MAGPIE and Sami platforms already achieve three layers; four is the next milestone). (3) Democratization through R/Bioconductor packages like spammR that make spatial multi-omics analysis accessible to researchers without specialized computational infrastructure. The field is moving from "can we integrate these two datasets?" to "how much biological insight can we extract from the integrated multi-omics view?" — and the pace of progress suggests that computationally augmented spatial omics will be a standard research tool within 3-5 years.
References:
- Agrawal A, Thomann S. Spatial Multi-Omics Technologies in Cancer Research: Integration, Challenges, and Future Directions. Am J Pathol 2026;196(7):1406-1426. DOI: 10.1016/j.ajpath.2026.01.007
- Li M, Sun P, Luo Y, Zhou G, Yang X, Meng D, Ye K. SpatialCOC: An Integrative Framework for Spatial Continuous Mapping and Cross-Omics Correction in Spatial Multi-Omics Data. Nat Commun 2026;17:5268. DOI: 10.1038/s41467-026-71882-2
- Du Z, Chen Q, Huang W, Chen J, Zheng X. SMART: Spatial Multi-Omic Aggregation Using Graph Neural Networks and Metric Learning. Nat Commun 2026;17:2876. DOI: 10.1038/s41467-026-70821-5
- Cai W, Li W. SpatialFuser: A Conditional Generative Framework for Un-Paired Cross-Resolution Spatial Multi-Omics Integration. bioRxiv 2025. DOI: 10.1101/2025.09.14.676067
- Gui Y, Xu Y, Li C. CoMo: Cross-Modal Graph Contrastive Learning for Spatial Multi-Omics Data Integration. Brief Bioinform 2026;27(2):bbag192. DOI: 10.1093/bib/bbag192
- Li W, Mao L, Liu Y, Peng F, Sachs N, Wu W, et al. Toward Computationally Complete Spatial Omics. bioRxiv 2026. DOI: 10.64898/2026.03.03.709303
- Mahlich Y, Sohi H, Veličković M, Piehowski PD, McDermott JE, Gosline SJC. spammR: An R Package Designed for Analysis and Integration of Spatial Multi-Omic Measurements. Bioinform Adv 2026;6(1):vbag163. DOI: 10.1093/bioadv/vbag163
- Godfrey TM, Shanneik Y, Zhang W, Tran T, Verbeeck N, Patterson NH, Jackobs FE, Nagi C, Ramineni M, Eberlin LS. Integrating Ambient Ionization Mass Spectrometry Imaging and Spatial Transcriptomics on the Same Cancer Tissues to Identify RNA-Metabolite Correlations. Angew Chem Int Ed 2025;64(24):e202502028. DOI: 10.1002/anie.202502028
- Hendriks TFE, Eijkel GB, Visvikis T, Balluff B, Heeren RMA, Cuypers E. One Section, Two Worlds: Single-Cell Integration of MALDI-MSI and Spatial Transcriptomics on the Same Single Tissue Section. Sci Rep 2025;15:42660. DOI: 10.1038/s41598-025-26735-1
- Williams EC, Franzén L, Olsson Lindvall M, Hamm G, Oag S, Majumder MM, et al. Spatially Resolved Integrative Analysis of Transcriptomic and Metabolomic Changes in Tissue Injury Studies. Nat Commun 2026;17:205. DOI: 10.1038/s41467-025-68003-w
- Xu J, Shen XT, Zhang C, Zhang XY, Chen ZQ, Jia HL, Yang LY. haCCA: Multi-Module Integration of Spot-Based Spatial Transcriptomes and Metabolomes. Commun Biol 2026;9:95. DOI: 10.1038/s42003-026-09526-w
- Clarke HA, Ma X, Shedlock CJ, Medina T, Hawkinson TR, Wu L, et al. Spatial Mapping of the Brain Metabolome, Lipidome and Glycome. Nat Commun 2025;16:4373. DOI: 10.1038/s41467-025-59487-7
- Lu KH, Zhang H, Yagnik GB, Lim MJ, Rothschild KJ, Li W, Schneider AJ, Puglielli L, Li L. Deciphering the Three-Dimensional Biomolecular Distribution in the Alzheimer's Disease Brain: A Multiomic Approach Integrating Immunohistochemistry with MALDI MS Imaging. Anal Chim Acta 2025;1379:344721. DOI: 10.1016/j.aca.2025.344721
















