

* This article serves as the definitive technology-selection resource for researchers evaluating which mass spectrometry imaging modality to use for lipid analysis. Unlike general MSI reviews, every section is filtered through a lipid-specific lens — ionization behavior, adduct chemistry, class-specific ion suppression, and practical decision frameworks that no existing guide provides.
What Is Spatial Lipidomics?
Spatial lipidomics advances beyond conventional bulk lipidomics, where tissue homogenization before LC-MS analysis erases where each lipid was located. Given that lipid composition varies dramatically across tissue microenvironments, cell types, and subcellular compartments, this loss is not trivial.
From Shotgun Lipidomics to Spatially Resolved Lipid Maps
Traditional shotgun and LC-MS lipidomics deliver deep coverage (500–1,500 lipid species) but homogenization averages signals across all cell populations — a tumor biopsy reports the aggregate profile of cancer cells, stroma, immune infiltrate, and necrotic regions combined, unable to distinguish PS enrichment from apoptotic tumor cells versus activated macrophages.
MALDI imaging lipidomics solves this by coupling mass spectrometry with two-dimensional tissue scanning. Each pixel contains a full mass spectrum; overlaying ion images with histology directly correlates lipid phenotypes with tissue architecture — sulfatides enriched in myelinated white matter, or specific PC species concentrated at the invasive tumor margin.
The Biological Significance of Lipid Spatial Organization
Lipid spatial patterns reflect underlying biology with functional consequences:
Membrane domains. Cholesterol- and sphingolipid-enriched lipid rafts regulate protein clustering and signal transduction. MALDI imaging at 5–10 μm can distinguish raft-associated lipid signatures from bulk membrane signals.
Signaling gradients. Bioactive lipids such as sphingosine-1-phosphate (S1P) and lysophosphatidic acid (LPA) form concentration gradients across tissues — spatial lipidomics captures these directly, revealing signaling landscapes that bulk methods average away.
Metabolic zonation. The liver exhibits periportal (β-oxidation) vs. pericentral (lipogenesis) hepatocyte lipid signatures — differences only visible through spatially resolved analysis.
Lipid Chemistry Essentials for MSI: What Makes Lipids Different from General Metabolites
Before selecting an MSI platform, it is essential to understand the chemical properties that govern lipid ionization behavior. Lipids are not a uniform analyte class — diverse head groups, fatty acyl compositions, and physicochemical properties create striking differences in ionization efficiency, polarity preference, and susceptibility to ion suppression. A researcher who treats lipids as "just another metabolite" will make poor platform choices.
Lipid Classification
The LIPID MAPS consortium recognizes eight major lipid categories. The five most relevant to MSI are:
- Glycerophospholipids (GPLs): The dominant membrane lipids — PC, PE, PS, PI, PG, PA, and cardiolipin (CL). Each subclass head group largely determines ionization behavior.
- Sphingolipids: Ceramide-backbone lipids including sphingomyelin (SM), ceramides, hexosylceramides, gangliosides, and sulfatides. SM's phosphocholine head group makes it behave similarly to PC.
- Sterols: Cholesterol, cholesteryl esters (CE), oxysterols, and bile acids. Cholesterol ionizes poorly without derivatization or specialized matrices.
- Glycerolipids: MAG, DAG, and TAG — neutral lipids requiring Na⁺ or NH₄⁺ adduction.
- Fatty Acyls: Free fatty acids (FFA), eicosanoids, and acyl-CoAs. FFAs ionize efficiently in negative mode as [M−H]⁻.
Lipid Ionization Behavior: Class-Specific Polarity Preference
The single most important rule in lipid MSI is this: a lipid's head group, not its fatty acyl chains, determines its ionization polarity preference. This is because the head group dictates the molecule's gas-phase proton affinity or acidity, which governs whether the lipid preferentially gains a proton (positive mode) or loses one (negative mode).
Positive-ion-preferring lipids carry a quaternary ammonium group (permanently charged) or a primary amine with high proton affinity. PC and SM, with their choline head group containing [N(CH₃)₃]⁺, dominate positive-ion spectra as [M+H]⁺, [M+Na]⁺, and [M+K]⁺.
Negative-ion-preferring lipids carry acidic groups (carboxylates, phosphates, sulfates) that readily deprotonate. PE, PS, PI, PG, PA, and CL ionize efficiently as [M−H]⁻ — negative mode is essential for PE when PC suppression must be avoided. Sulfatides (ST) are dominant negative-mode signals in white matter. Free fatty acids are detected as [M−H]⁻ in the m/z 100–400 range.
Glycerolipids (TAG, DAG, CE) occupy a special category: they lack ionizable head groups entirely. They require cation adduction — most commonly [M+Na]⁺ or [M+NH₄]⁺ — and are exclusively detected in positive mode. Doping the solvent or matrix with ammonium salts (e.g., ammonium chloride or ammonium acetate) can significantly enhance neutral lipid detection.
Adduct Formation Patterns
Lipids rarely appear as a single ion species — each lipid molecular species generates a characteristic adduct profile depending on available cations in the tissue and matrix:
| Lipid Class | Positive Mode Adducts | Negative Mode Adducts |
|---|---|---|
| PC, SM | [M+H]⁺, [M+Na]⁺, [M+K]⁺ | [M+Cl]⁻, [M+HCOO]⁻ |
| PE | [M+H]⁺, [M+Na]⁺ | [M−H]⁻ |
| PS | [M+H]⁺, [M+Na]⁺ | [M−H]⁻ |
| PI | [M+Na]⁺, [M+NH₄]⁺ | [M−H]⁻ |
| PG, PA | [M+Na]⁺, [M+NH₄]⁺ | [M−H]⁻ |
| TAG, DAG | [M+Na]⁺, [M+NH₄]⁺ | Not detected |
| CE | [M+NH₄]⁺ | Not detected |
| FFA | Not detected | [M−H]⁻ |
| Cer | [M+Na]⁺ (weak) | [M−H]⁻ |
| Sulfatides | Weak/absent | [M−H]⁻ |
| CL | [M+Na]⁺ (weak) | [M−H]⁻, [M−2H]²⁻ |
The practical consequence is that one lipid species produces multiple peaks — PC(34:1) appears at m/z 760.6 [M+H]⁺, 782.6 [M+Na]⁺, and 798.6 [M+K]⁺ — splitting ion current across channels. In high-sodium tissues, [M+Na]⁺ may dominate entirely. This tissue-dependent adduct distribution is a major confound in comparative studies.
Ion Suppression Between Lipid Classes: Why PC Suppresses PE
PC dominance in positive-ion spectra is an active suppression phenomenon, not merely an abundance effect. The quaternary ammonium group's permanent positive charge lets PC outcompete other lipid classes for charge carriers. At physiological concentrations (PC = 40–50% of total phospholipid), PE signal in positive mode is suppressed to 5–15% of its unsuppressed value.
This ion suppression has two critical practical consequences:
1. PE and other anionic phospholipids must be analyzed in negative ion mode for reliable detection. Attempting to characterize PE distribution from positive-ion data alone will systematically underestimate PE abundance and may entirely miss PE species in PC-rich regions.
2. Cross-sample comparisons require polarity-matched normalization. If sample A has higher PC content than sample B, the apparent PE decrease in sample A may be an artifact of stronger PC suppression rather than a genuine biological difference.
Matrix choice modulates this further. DAN in negative mode demethylates PC to [M−CH₃]⁻ (isomeric with PE), and SM generates artifactual C1P signals — lipid-specific artifacts rarely covered in general MSI guides.
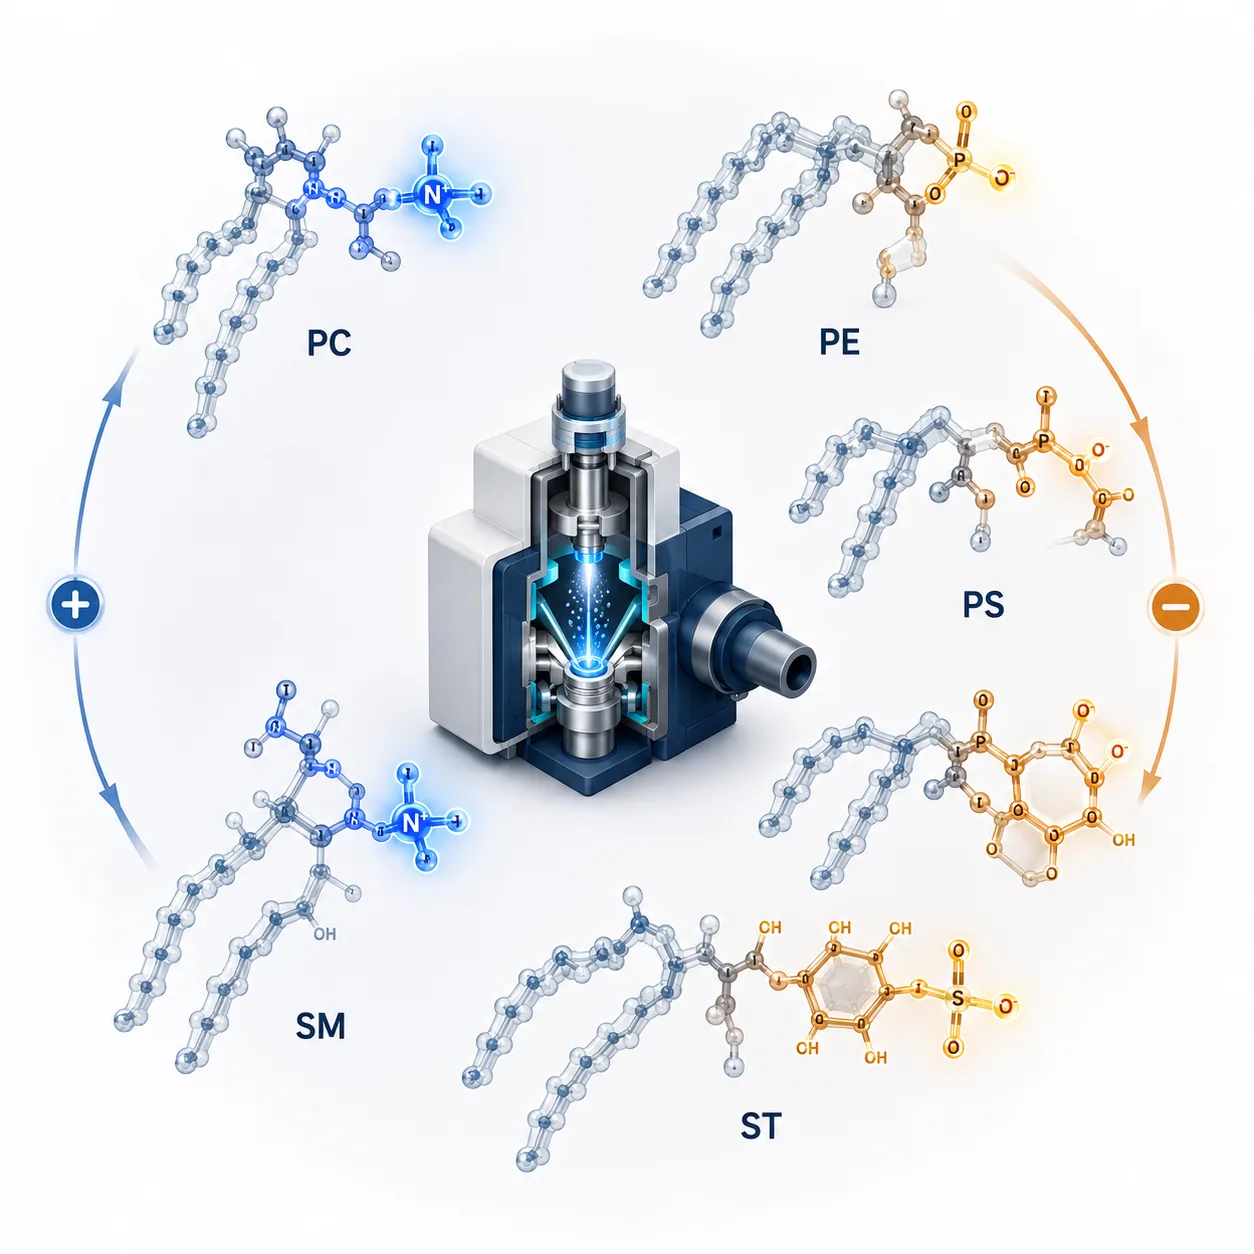 Figure 1: Lipid class overview — chemical structures of major lipid classes showing head group diversity.*
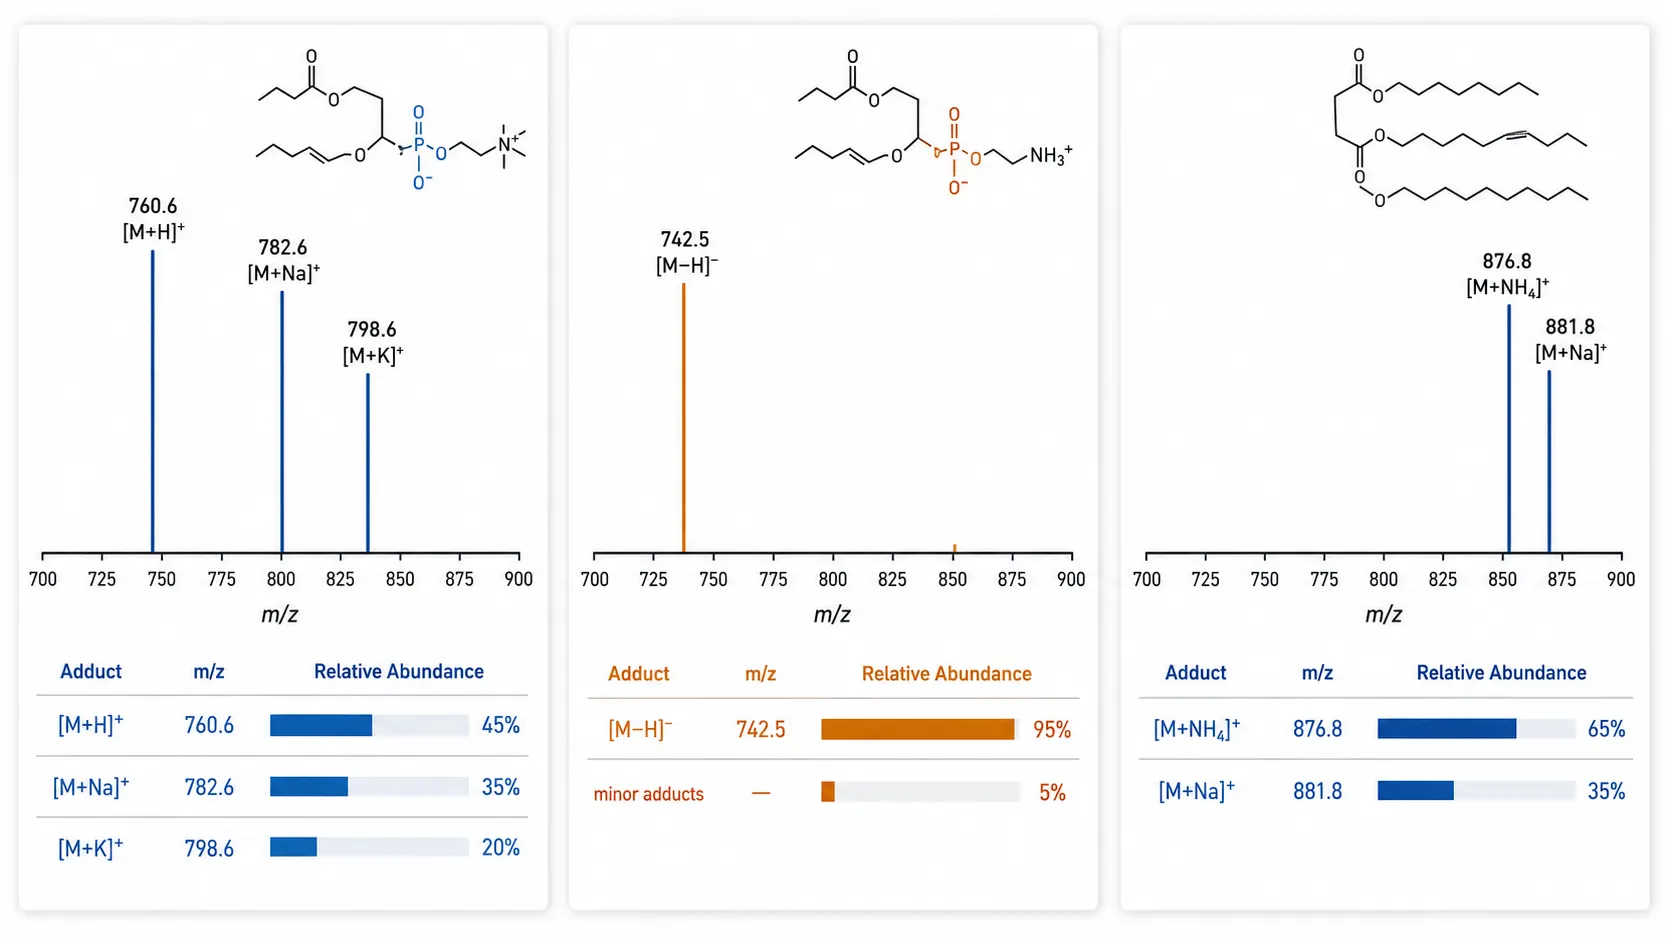 Figure 2: Lipid ionization behavior — polarity preference by lipid class, adduct patterns, and ion suppression relationships.*
MSI Technology Platforms for Spatial Lipidomics
Four major MSI platforms are relevant to spatial lipidomics, each with distinct strengths and limitations through the lipid lens.
MALDI-MSI: The Lipid Imaging Workhorse
Matrix-assisted laser desorption/ionization (MALDI) is by far the most established and widely used MSI modality for lipid analysis, accounting for approximately 70% of published spatial lipidomics studies. In a typical workflow, a UV-absorbing organic matrix (most commonly 2,5-dihydroxybenzoic acid, DHB) is applied to the tissue section, co-crystallizing with tissue lipids. A pulsed 355 nm Nd:YAG laser then desorbs and ionizes lipid molecules from each pixel, and a time-of-flight (TOF) or Orbitrap mass analyzer records the resulting mass spectrum.
Key matrices for lipid MALDI-MSI, each with distinct selectivity:
- DHB (2,5-DHB): The universal starting point — broad glycerophospholipid and SM coverage in positive mode, sublimes well for 10–20 μm resolution.
- DAN (1,5-DAN): Preferred for neutral lipids and sterols in positive mode; in negative mode excels for ceramides and sulfatides — but account for PC demethylation and SM→C1P artifacts.
- 9-Aminoacridine (9-AA): The standard for comprehensive negative-ion lipid imaging — PE, PS, PI, PG, PA, and sulfatides with minimal background.
- NEDC (N-(1-naphthyl)ethylenediamine dihydrochloride): A 2025 dual-polarity matrix enabling both modes from a single deposition at 5 μm resolution, eliminating the need for separate acquisitions on different sections.
For a deeper exploration of MALDI lipid imaging — including matrix selection decision trees, the lipid annotation pipeline, and 2025 breakthroughs like t-MALDI-2 at 1 μm resolution and on-tissue ozonolysis for C=C isomer imaging — see our dedicated article on MALDI-MSI for spatial lipidomics. For our MALDI imaging service offerings, visit MALDI imaging lipidomics.
DESI-MSI: Ambient Lipid Imaging
Desorption electrospray ionization (DESI) operates under ambient conditions — no vacuum, no matrix — making it uniquely suited for rapid screening and samples that cannot tolerate matrix application. A charged solvent spray is directed at the tissue surface; the solvent dissolves lipids from a microscale area, and secondary droplets carrying ionized lipids are aspirated into the mass spectrometer.
DESI's lipid-specific characteristics:
- Polar lipid bias: Preferentially ionizes phospholipids and lysophospholipids; neutral lipids (TAG, CE, cholesterol) require reactive DESI with derivatization agents.
- Spatial resolution: Standard DESI achieves 50–200 μm (tissue-level); nano-DESI improves to 10–50 μm with lower throughput.
- Reactive DESI: Adding derivatization reagents (e.g., betaine aldehyde for cholesterol) to the spray solvent converts ionization-resistant lipids into detectable charged species.
- Adduct control: A defined spray solvent enables controlled adduct formation — ammonium acetate shifts TAG detection toward [M+NH₄]⁺ rather than unpredictable [M+Na]⁺/[M+K]⁺ ratios.
SIMS: Nanoscale Lipid Mapping
Secondary ion mass spectrometry (SIMS) achieves spatial resolution of<200 nm — two to three orders of magnitude beyond MALDI and DESI — by using a focused primary ion beam (Bi₃⁺, Au₃⁺, or C₆₀⁺) to sputter and ionize molecules directly from the sample surface. This resolution enables imaging of lipid distributions across individual cellular membranes and organelles.
SIMS imposes trade-offs for lipid analysis:
- Hard ionization: The high-energy beam fragments most lipids — PC and SM are detected as the m/z 184 phosphocholine fragment rather than intact species. SIMS localizes choline-containing lipids but cannot identify which specific PC or SM species are present.
- Mass range: Limited to m/z<1,500, excluding larger glycerophospholipids and cardiolipins.
- Cholesterol detection: The [M−H₂O+H]⁺ ion at m/z 369 makes SIMS the platform of choice for nanoscale cholesterol mapping.
- Sample requirements: Electrically conductive, ultra-flat surfaces required; sensitive to topography.
For a complete discussion of SIMS lipid imaging — including when the nanoscale resolution benefit outweighs the molecular information loss — see our dedicated article on SIMS imaging for high-resolution spatial lipidomics.
IR-MALDESI and AP-MALDI
Two niche platforms:
- IR-MALDESI: Uses an IR laser with endogenous water as matrix (no exogenous matrix needed), followed by ESI post-ionization. Matrix-free operation benefits low-m/z species (FFAs, small metabolites) obscured by matrix clusters in conventional MALDI.
- AP-MALDI: Operates at atmospheric pressure, preserving volatile lipids lost under vacuum. Compatible with ion mobility for isomer separation.
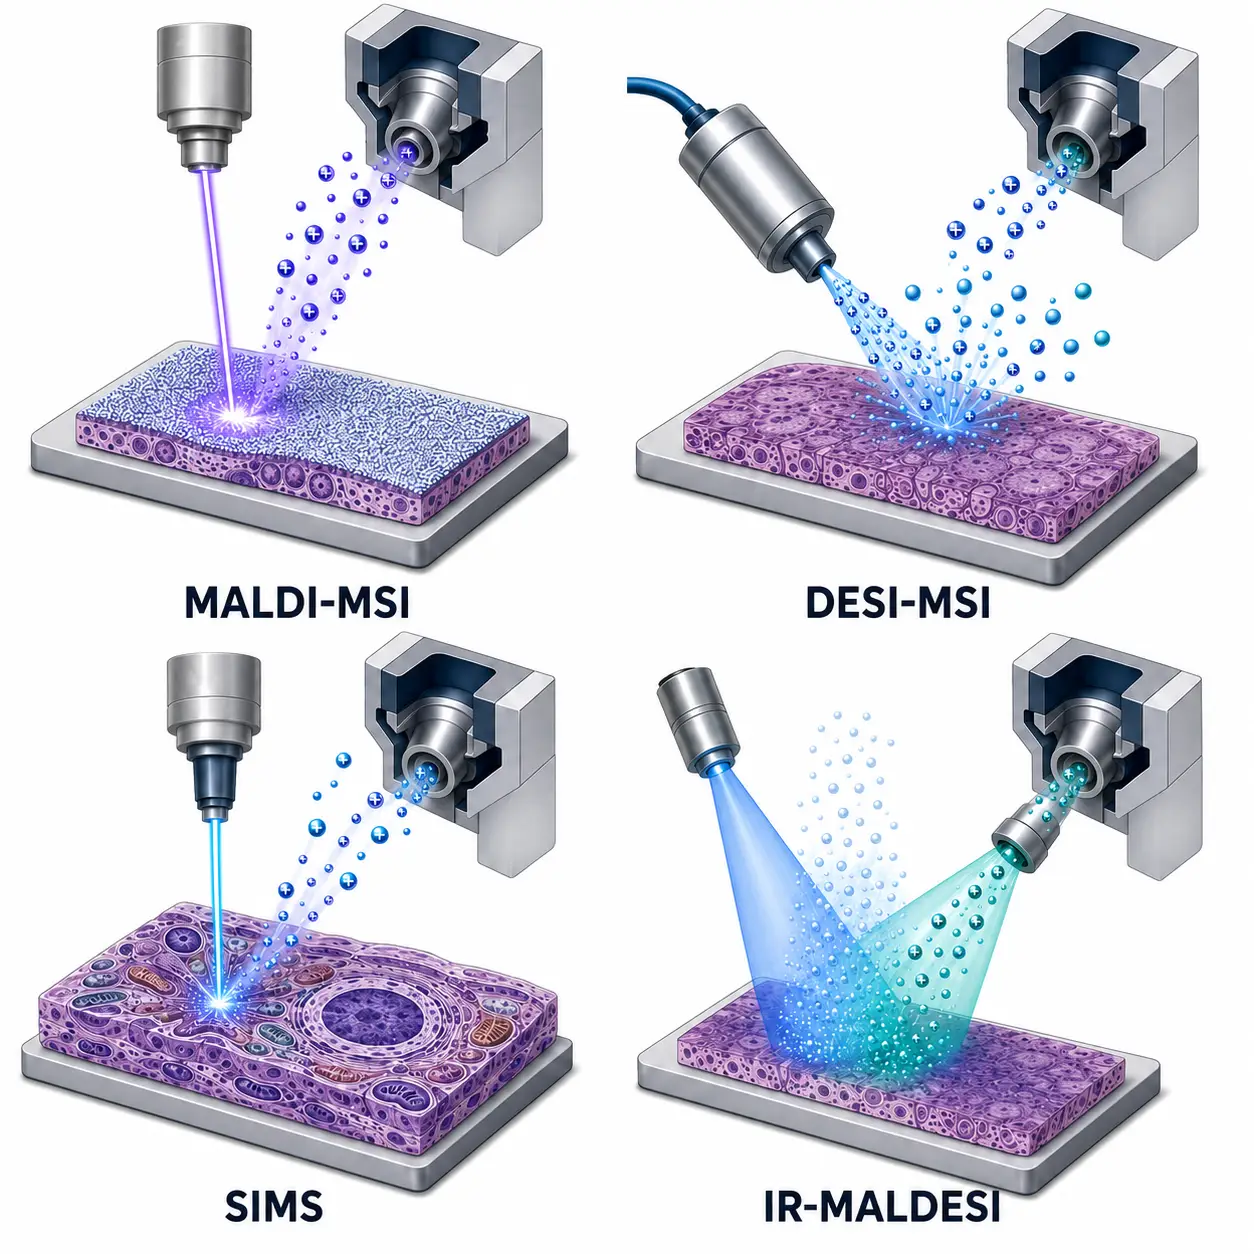 Figure 3: MSI platform comparison for lipid imaging — lipid coverage, spatial resolution, and identification confidence across MALDI, DESI, SIMS, and emerging modalities.*
Technology Selection for Lipid Imaging
This section — the core differentiator of this guide — provides a systematic framework for matching a research question to the most appropriate MSI modality, grounded in lipid chemistry rather than generic platform descriptions.
Axis 1: Lipid Class Coverage — Which Lipids Can Each Platform Detect?
The first selection criterion is whether a platform can ionize your target lipid class. The table below maps lipid classes to ionization compatibility:
| Lipid Class | MALDI | DESI | SIMS | Notes |
|---|---|---|---|---|
| PC, SM | +++ (pos) | +++ (pos) | + (m/z 184 fragment) | Strongest signals across all modalities |
| PE, PS, PI, PG | ++ (neg, 9-AA) | ++ (neg) | + (head group fragments) | Require negative mode; PC suppression in positive mode |
| PA, CL | + (neg) | + (neg) | − (mass too high for SIMS) | Cardioipins exceed SIMS mass range |
| Cer, HexCer | ++ (neg, DAN) | + (neg) | + (neg fragment ions) | DAN is preferred matrix |
| Sulfatides | +++ (neg) | ++ (neg) | ++ (neg) | Dominant negative-mode signals in white matter |
| TAG, DAG | + (pos, +Na⁺) | + (pos, +NH₄⁺) | − (neutral, no charge) | Require cation adduction |
| Cholesterol | + (pos, derivatization) | + (reactive DESI) | +++ (m/z 369) | SIMS is best platform for cholesterol |
| FFA | + (neg) | ++ (neg) | + (neg) | Low m/z range; matrix interference risk in MALDI |
| Gangliosides | ++ (neg) | + (neg) | − (mass limit) | Large glycolipids; exceed SIMS mass range |
+++ = excellent; ++ = good; + = possible with optimization; − = not feasible
This matrix reveals several non-obvious rules: If your biological question involves both PC and PE, you must acquire data in both polarities — PC in positive mode for optimal sensitivity, PE in negative mode to escape PC suppression. If cholesterol distribution is your primary endpoint, SIMS is the superior platform despite its fragmentation limitations. If you need comprehensive neutral lipid coverage (TAG, DAG, CE), MALDI with sodium or ammonium doping is mandatory — DESI without reactive derivatization will miss these species entirely.
Axis 2: Spatial Resolution vs. Lipid Coverage Trade-off
Spatial resolution and lipid coverage are inversely related — smaller pixels mean less material per pixel and fewer detectable lipids:
| Platform | Typical Resolution | Lipid Species Detected | Best-Use Scenario |
|---|---|---|---|
| Standard MALDI | 20–50 μm | 200–500 | Tissue-level lipid mapping; broad class coverage |
| High-res MALDI | 5–10 μm | 100–300 | Cellular-level lipid heterogeneity; tumor microenvironment |
| MALDI-2 / t-MALDI | 1–5 μm | 50–200 | Single-cell lipidomics; subcellular lipid organization |
| DESI | 50–200 μm | 100–300 | Rapid tissue screening; intraoperative applications |
| nano-DESI | 10–50 μm | 50–150 | Targeted cellular lipid analysis; quantitative imaging |
| SIMS | 0.1–0.5 μm | 10–50 (fragments) | Plasma membrane organization; organelle lipid mapping |
Practically: biomarker discovery studies should prioritize coverage (MALDI at 20–50 μm via untargeted lipidomics); tumor microenvironment studies need 5–10 μm to resolve the tumor-stroma interface; and plasma membrane leaflet asymmetry requires SIMS — accepting fragment-level rather than intact lipid information.
Axis 3: Lipid Identification Confidence — Accurate Mass vs. MS/MS vs. Ion Mobility
Lipid identification in MSI is more challenging than in LC-MS because MSI lacks the orthogonal separation of retention time — every pixel contains the full tissue lipidome co-ionized, making mass accuracy critical. Untargeted lipidomics by LC-MS provides complementary depth.
The Lipidomics Standards Initiative (LSI) defines four identification confidence levels:
- Level 4 — Accurate mass: m/z matched to a database within<3 ppm. Default in most MSI studies; risk of isobaric ambiguity (e.g., PC(34:1) vs. PE(37:1) at nominal mass 760).
- Level 3 — Sum composition: MS/MS confirms lipid class and total fatty acyl composition (sum of carbons and double bonds).
- Level 2 — Molecular species: MS/MS resolves individual fatty acyl chains (e.g., PC 16:0/18:1 vs. PC 18:0/16:1).
- Level 1 — Full structure: sn-Position, C=C location and geometry, and chain branching resolved — requiring ion mobility, OzID, UVPD, or derivatization.
For most biological questions, Level 2–3 is sufficient — and both untargeted and targeted spatial lipidomics workflows can achieve this level with appropriate MS/MS acquisition strategies. Only when lipid isomer biology is central to the hypothesis — for example, distinguishing pro-inflammatory from anti-inflammatory eicosanoid isomers — is Level 1 identification necessary. For detailed annotation strategies, see our guide on MALDI-MSI for spatial lipidomics.
Axis 4: Quantification Needs
Most MSI data is semi-quantitative — reliable for relative comparisons but not absolute concentrations. When absolute quantification is required, refer to our dedicated guide on quantitative spatial lipidomics, which covers SIL internal standards, on-tissue calibration curves, and mimetic tissue models in depth.
Decision Matrix: Research Question to Platform Mapping
| Research Question | Recommended Platform | Polarity | Expected Coverage | Key Trade-off |
|---|---|---|---|---|
| "What lipid changes occur in tumor vs. normal tissue?" | MALDI-Orbitrap, 20 μm | Dual (separate sections) | 300–500 lipids, Level 3 | Broad survey; isomers unresolved |
| "Are PC species enriched at the invasive tumor margin?" | High-res MALDI, 5–10 μm | Positive | 150–300 lipids, Level 2–3 | Resolution vs. coverage |
| "Is cholesterol concentrated in lipid rafts?" | SIMS | Positive | Fragment ions, m/z 369 | Molecular detail vs. spatial precision |
| "Which PE species change in response to drug treatment?" | MALDI, 9-AA, 20 μm | Negative | 100–200 lipids, Level 2–3 | Negative mode only; PC and SM not detected |
| "What are the absolute concentrations of ceramides across brain regions?" | [Quantitative MSI](/resource/quantitative-spatial-lipidomics-absolute-quantification.htm) with SIL-IS | Negative (DAN) | 20–50 ceramides, Level 2 | Absolute quantification; limited lipid coverage |
| "How do lipid profiles differ across 50 tissue samples?" | DESI-MSI | Dual (interleaved lines) | 100–200 lipids, Level 3–4 | High throughput; lower resolution |
| "What spatial lipid changes accompany Alzheimer's plaques?" | MALDI-FTICR, 20 μm | Dual | 300–500 lipids, Level 2–3 | Ultra-high mass accuracy; slower acquisition |
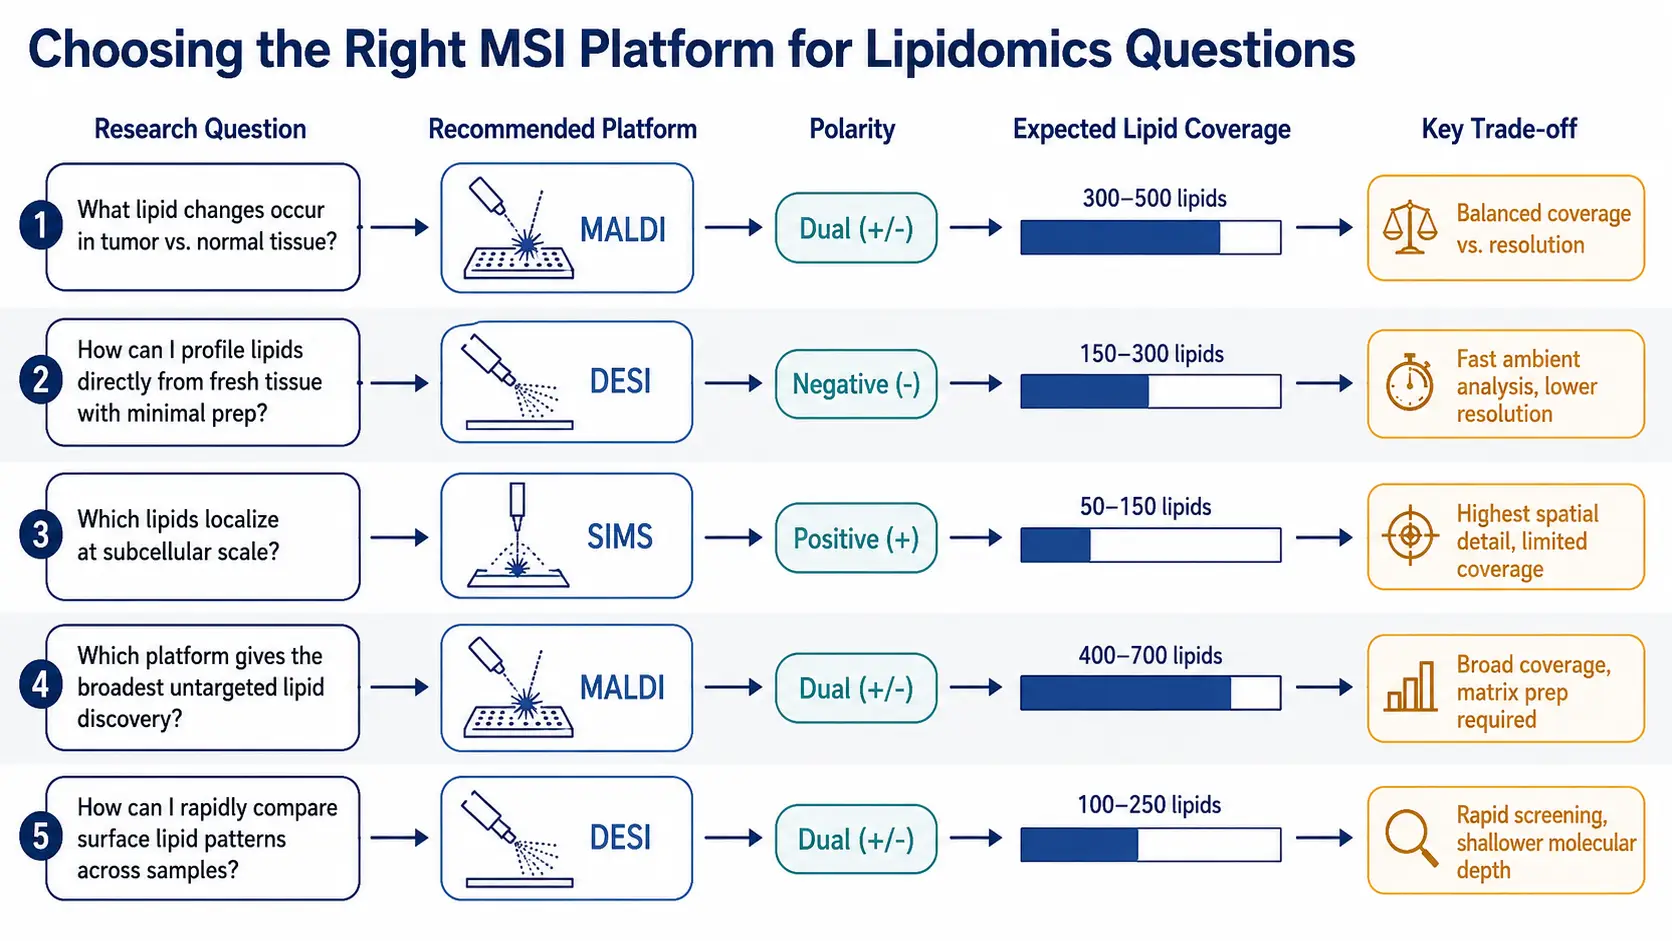 Figure 4: Technology selection decision matrix — research question, recommended platform, polarity, expected lipid coverage, and key trade-offs.*
Sample Preparation for Spatial Lipidomics
Lipids oxidize, hydrolyze, and redistribute during tissue handling — protocols optimized for proteomics or transcriptomics are often actively harmful for lipid preservation. This section covers lipid-specific considerations absent from general MSI guides.
Tissue Harvesting and Storage: Lipid Oxidation Prevention
Warm ischemia activates PLA₂, hydrolyzing phospholipids into lysophospholipids and free fatty acids while atmospheric oxygen initiates lipid peroxidation of polyunsaturated chains. Within 30 minutes at room temperature, the lipid profile is measurably altered.
Three rules minimize pre-analytical lipid degradation:
1. Minimize warm ischemia time. Target<30 minutes from excision to snap-freezing. Document ischemia time for surgical specimens as a metadata variable.
2. Snap-freeze in LN₂-cooled isopentane, not direct LN₂. Direct immersion creates a Leidenfrost gas layer that insulates tissue, slowing freezing and causing ice crystal damage. Isopentane slurry (~−80°C to −160°C) provides rapid, uniform cooling.
3. Store at −80°C under inert gas or vacuum. Nitrogen or vacuum-sealed storage retains the most detectable lipid annotations. Open-air −80°C storage causes gradual oxidation over weeks; room-temperature desiccator storage produces measurable degradation within one week.
Fresh-Frozen vs. FFPE for Lipid Analysis
This is the most common sample preparation question, and the answer for lipid analysis is unequivocal: fresh-frozen tissue is the gold standard; FFPE tissue is categorically suboptimal for lipid MSI. The reasons are chemical, not merely methodological preference:
- Slow fixation: Formalin crosslinking takes hours; PLA₂ remains active in the unfixed core, generating lysophospholipid and FFA artifacts concentrated in the tissue center.
- N-formylation: Formaldehyde reacts with PE and PS amine groups, producing N-formyl adducts (+28 Da) that appear as artificial lipid species.
- Methyl esterification: Methanol in commercial formalin esterifies FFA carboxyl groups, creating additional artificial peaks.
- Lipid stripping: Ethanol and xylene dehydration removes a substantial and unpredictable fraction of PC, PE, and TAG — the degree of loss varies with tissue type and cannot be corrected post hoc.
The bottom line: fresh-frozen tissue is the only acceptable substrate for spatial lipidomics. FFPE introduces artifacts that compromise lipid analysis beyond recovery. If only FFPE is available, acknowledge the limitation and validate against fresh-frozen controls.
Matrix Application for Lipid MALDI: Sublimation Preserves Spatial Distribution
The method of matrix application directly affects the spatial fidelity of lipid signals. Two methods dominate:
- Pneumatic spraying (wet deposition): Fast and simple, but solvent can delocalize mobile lipids (PC, SM, lysophospholipids) — delocalization varies with spray wetness, tissue type, and lipid class.
- Sublimation (dry deposition): Matrix vapor deposited uniformly without solvent contact, preserving native spatial distribution. Typically yields lower signals than wet deposition; post-sublimation recrystallization (solvent vapor exposure in a sealed chamber) improves sensitivity while largely preserving spatial fidelity.
For lipid imaging where spatial accuracy is paramount — for example, determining whether a lipid species is truly enriched at a tissue boundary or diffusely distributed — sublimation with recrystallization is the recommended approach.
On-Tissue Derivatization for Challenging Lipid Classes
Several lipid classes ionize too poorly for standard MSI detection. On-tissue chemical derivatization converts these "silent" lipids into readily ionizable derivatives directly on the tissue section:
- Cholesterol: Betaine aldehyde derivatization forms a charged quaternary ammonium derivative, transforming cholesterol from nearly invisible to one of the strongest signals.
- C=C positional isomers: Paternò-Büchi photochemistry or mCPBA epoxidation adds a functional group across the double bond; subsequent MS/MS reveals the original C=C position, distinguishing isomers like oleic acid (Δ9) from vaccenic acid (Δ11).
- Free fatty acids: Girard's reagent T or similar charged tags shift FFAs above the matrix interference range and dramatically improve ionization efficiency.
These strategies add workflow steps but unlock otherwise inaccessible structural information.
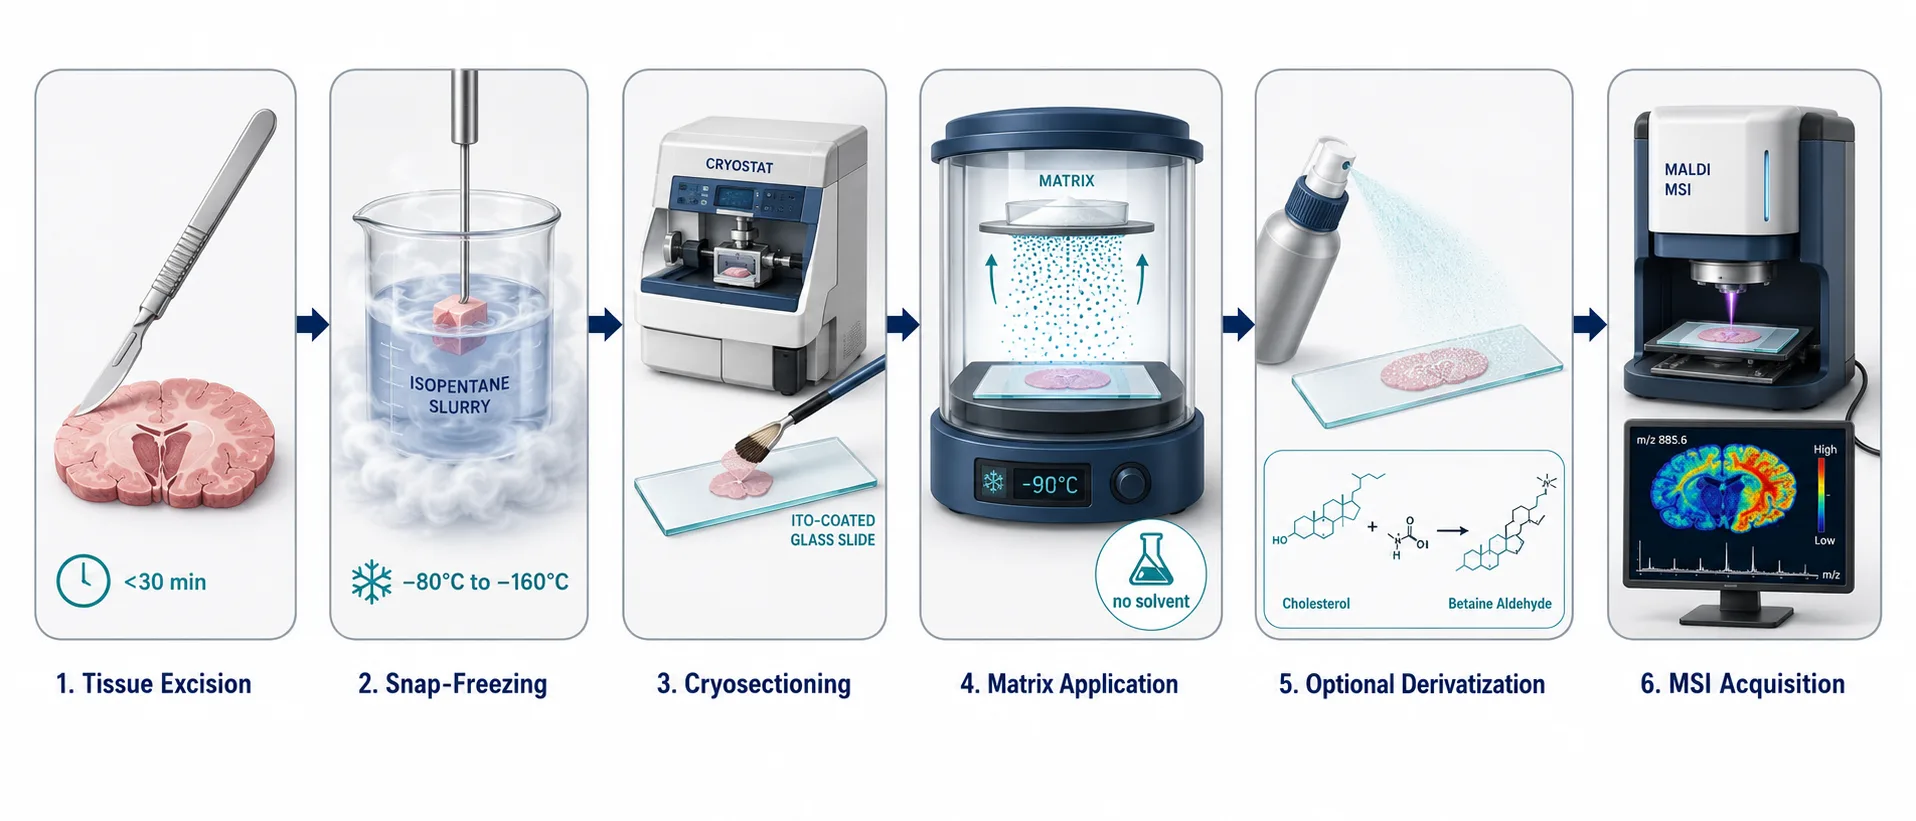 Figure 5: Sample preparation workflow for spatial lipidomics — from tissue harvest through snap-freezing, sectioning, matrix application, and MSI acquisition.*
Lipid Annotation and Database Resources
Interpreting MSI data requires matching m/z features to known lipid structures — annotation quality determines what biological conclusions can be drawn.
Key Databases and Software Platforms
- LIPID MAPS Structure Database (LMSD): The reference database — over 45,000 curated lipid species with exact masses for Level 4 identification. Batch-matching of m/z feature lists supports user-defined mass tolerance and adduct specifications.
- METASPACE: A cloud-based platform with FDR-controlled annotation specifically for spatial metabolomics and lipidomics. Incorporates spatial coherence — if an m/z feature produces an anatomically meaningful distribution, identification confidence increases.
- LipidSearch: Thermo Fisher Scientific commercial software applying lipid-class-specific fragmentation rules for Level 2–3 identification from both LC-MS and MSI data.
- Lipostar: Vendor-neutral platform supporting LC-MS and MSI data, with particular strength in stable isotope-labeled lipid analysis and quantitative workflows.
MS/MS-Based Lipid Identification
Accurate mass alone (Level 4) is insufficient in complex tissues — isobaric species share the same accurate mass. MS/MS fragmentation provides the structural detail for Level 2–3 confidence:
- Head group identification: Characteristic MS/MS fragments — m/z 184 (phosphocholine, PC/SM), neutral loss of 141 Da (phosphoethanolamine, PE), m/z 87 (phosphoserine, PS) — confirm lipid class.
- Fatty acyl composition: Negative-ion MS/MS detects carboxylate anions of individual chains, revealing length and unsaturation (e.g., m/z 255 for C16:0 and m/z 281 for C18:1 → PE(16:0/18:1) at Level 2).
- sn-Position: Relative carboxylate fragment abundance provides positional information, though not always unambiguous.
The Isomer Challenge
Three isomer types challenge conventional MSI:
1. C=C positional isomers: Oleic acid (Δ9) and vaccenic acid (Δ11) share identical mass but differ in biological function. On-tissue derivatization (Paternò-Büchi, OzID, mCPBA) or ion mobility is required for spatial discrimination.
2. sn-Positional isomers: PC(16:0/18:1) and PC(18:1/16:0) differ in sn-1/sn-2 chain assignment but produce identical spectra under most conditions. Specialized fragmentation or ion mobility can partially resolve them.
3. Chain branching and cyclopropane lipids: Common in bacterial membranes; require high-resolution MS/MS and specialized databases.
Isomer resolution is aspirational rather than routine, but it is the field's most rapidly advancing area — isomer-resolved lipid imaging should become standard within 3–5 years.
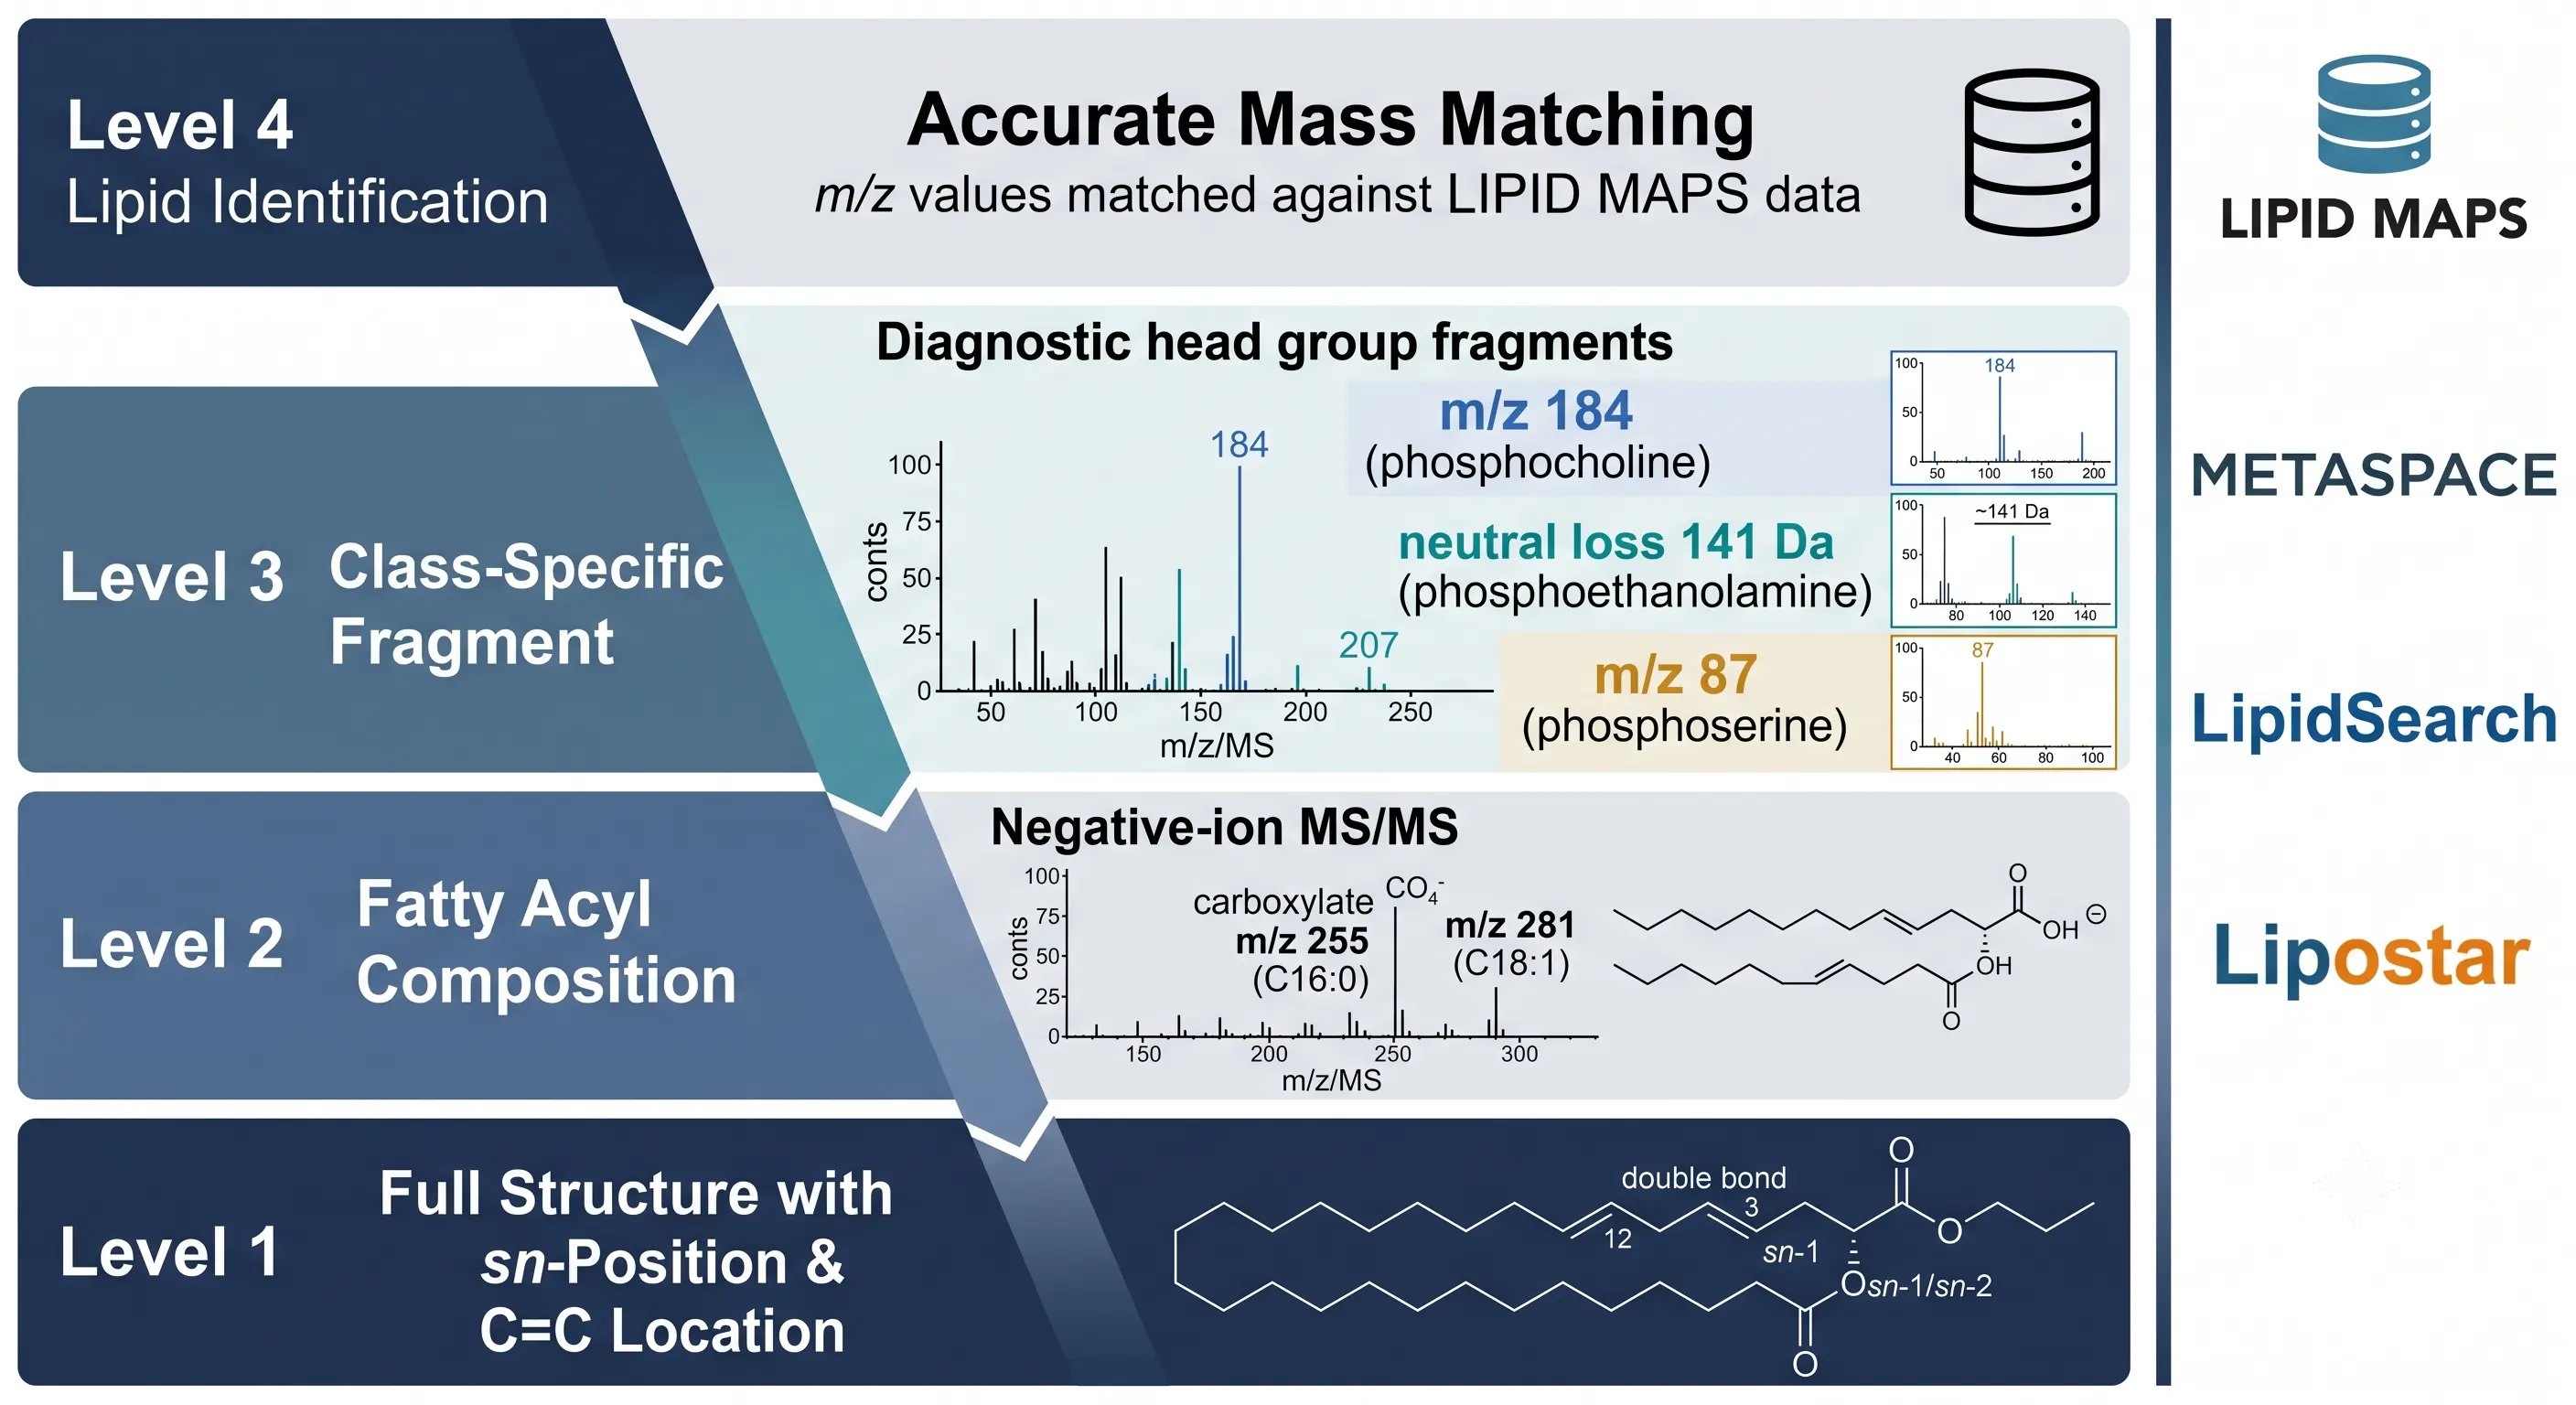 Figure 6: Lipid annotation pipeline — from raw MSI data through accurate mass matching, MS/MS confirmation, database cross-referencing, and isomer resolution.*
Key Applications in Spatial Lipidomics
The following application summaries illustrate how lipid-specific MSI technology selection translates into biological insight.
Cancer Lipid Metabolism and Tumor Microenvironment
Tumors reprogram lipid metabolism non-uniformly — the core, invasive margin, and stromal compartments carry distinct lipid signatures. Saturated PC species (e.g., PC 32:0, PC 34:1) concentrate at the proliferative front, while polyunsaturated PE species and oxidized phospholipids accumulate in necrotic cores. Lipid remodeling at the tumor-stroma interface — particularly PS externalization and lysophospholipid signaling — is detectable by MALDI imaging lipidomics and correlates with immune infiltration patterns. Spatial lipidomics can map these metabolic domains to identify lipid signatures associated with drug sensitivity or resistance, offering a chemical complement to immunohistochemistry-based tumor profiling.
Neurodegeneration: Myelin Lipids and Alzheimer's Pathology
The brain has the highest lipid diversity of any organ. White matter is dominated by sulfatides (e.g., ST 24:1) and galactosylceramides as myelin-specific markers; gray matter shows enrichment of PS species (e.g., PS 40:6) and gangliosides. In Alzheimer's disease, amyloid plaques create localized lipid perturbations: cholesterol depletion in the plaque vicinity, ceramide enrichment at plaque margins, and oxidative modifications of polyunsaturated phospholipids extending radially from plaque cores. MALDI imaging lipidomics at high spatial resolution resolves these plaque-associated lipid microenvironments, adding a chemical dimension to classical neuropathology.
Cardiovascular: Atherosclerotic Plaque Lipid Mapping
Atherosclerotic plaques contain spatially complex lipid architectures — a necrotic core, fibrous cap, calcified regions, and intraplaque hemorrhage — each with lipid signatures predictive of stability. Spatial lipidomics identifies cholesteryl ester and TAG accumulation in the necrotic core, oxidized phospholipids at the inflamed cap-shoulder region, and lysophosphatidylcholine enrichment at sites of endothelial dysfunction. These lipid maps complement histological classification and can flag unstable plaques at risk of rupture, providing molecular information beyond conventional histology alone.
Drug-Induced Phospholipidosis and Steatosis
Cationic amphiphilic drugs (CADs) — including antiarrhythmics, antidepressants, and antimalarials — can induce phospholipidosis, a pathological lysosomal phospholipid accumulation. Spatial lipidomics maps drug distribution and phospholipid accumulation simultaneously, revealing whether phospholipidosis is restricted to specific tissue zones (e.g., centrilobular hepatocytes) and whether it correlates spatially with drug deposition. Drug-induced hepatic steatosis can similarly be spatially mapped and distinguished from background hepatic lipid zonation. Untargeted lipidomics provides complementary bulk quantification.
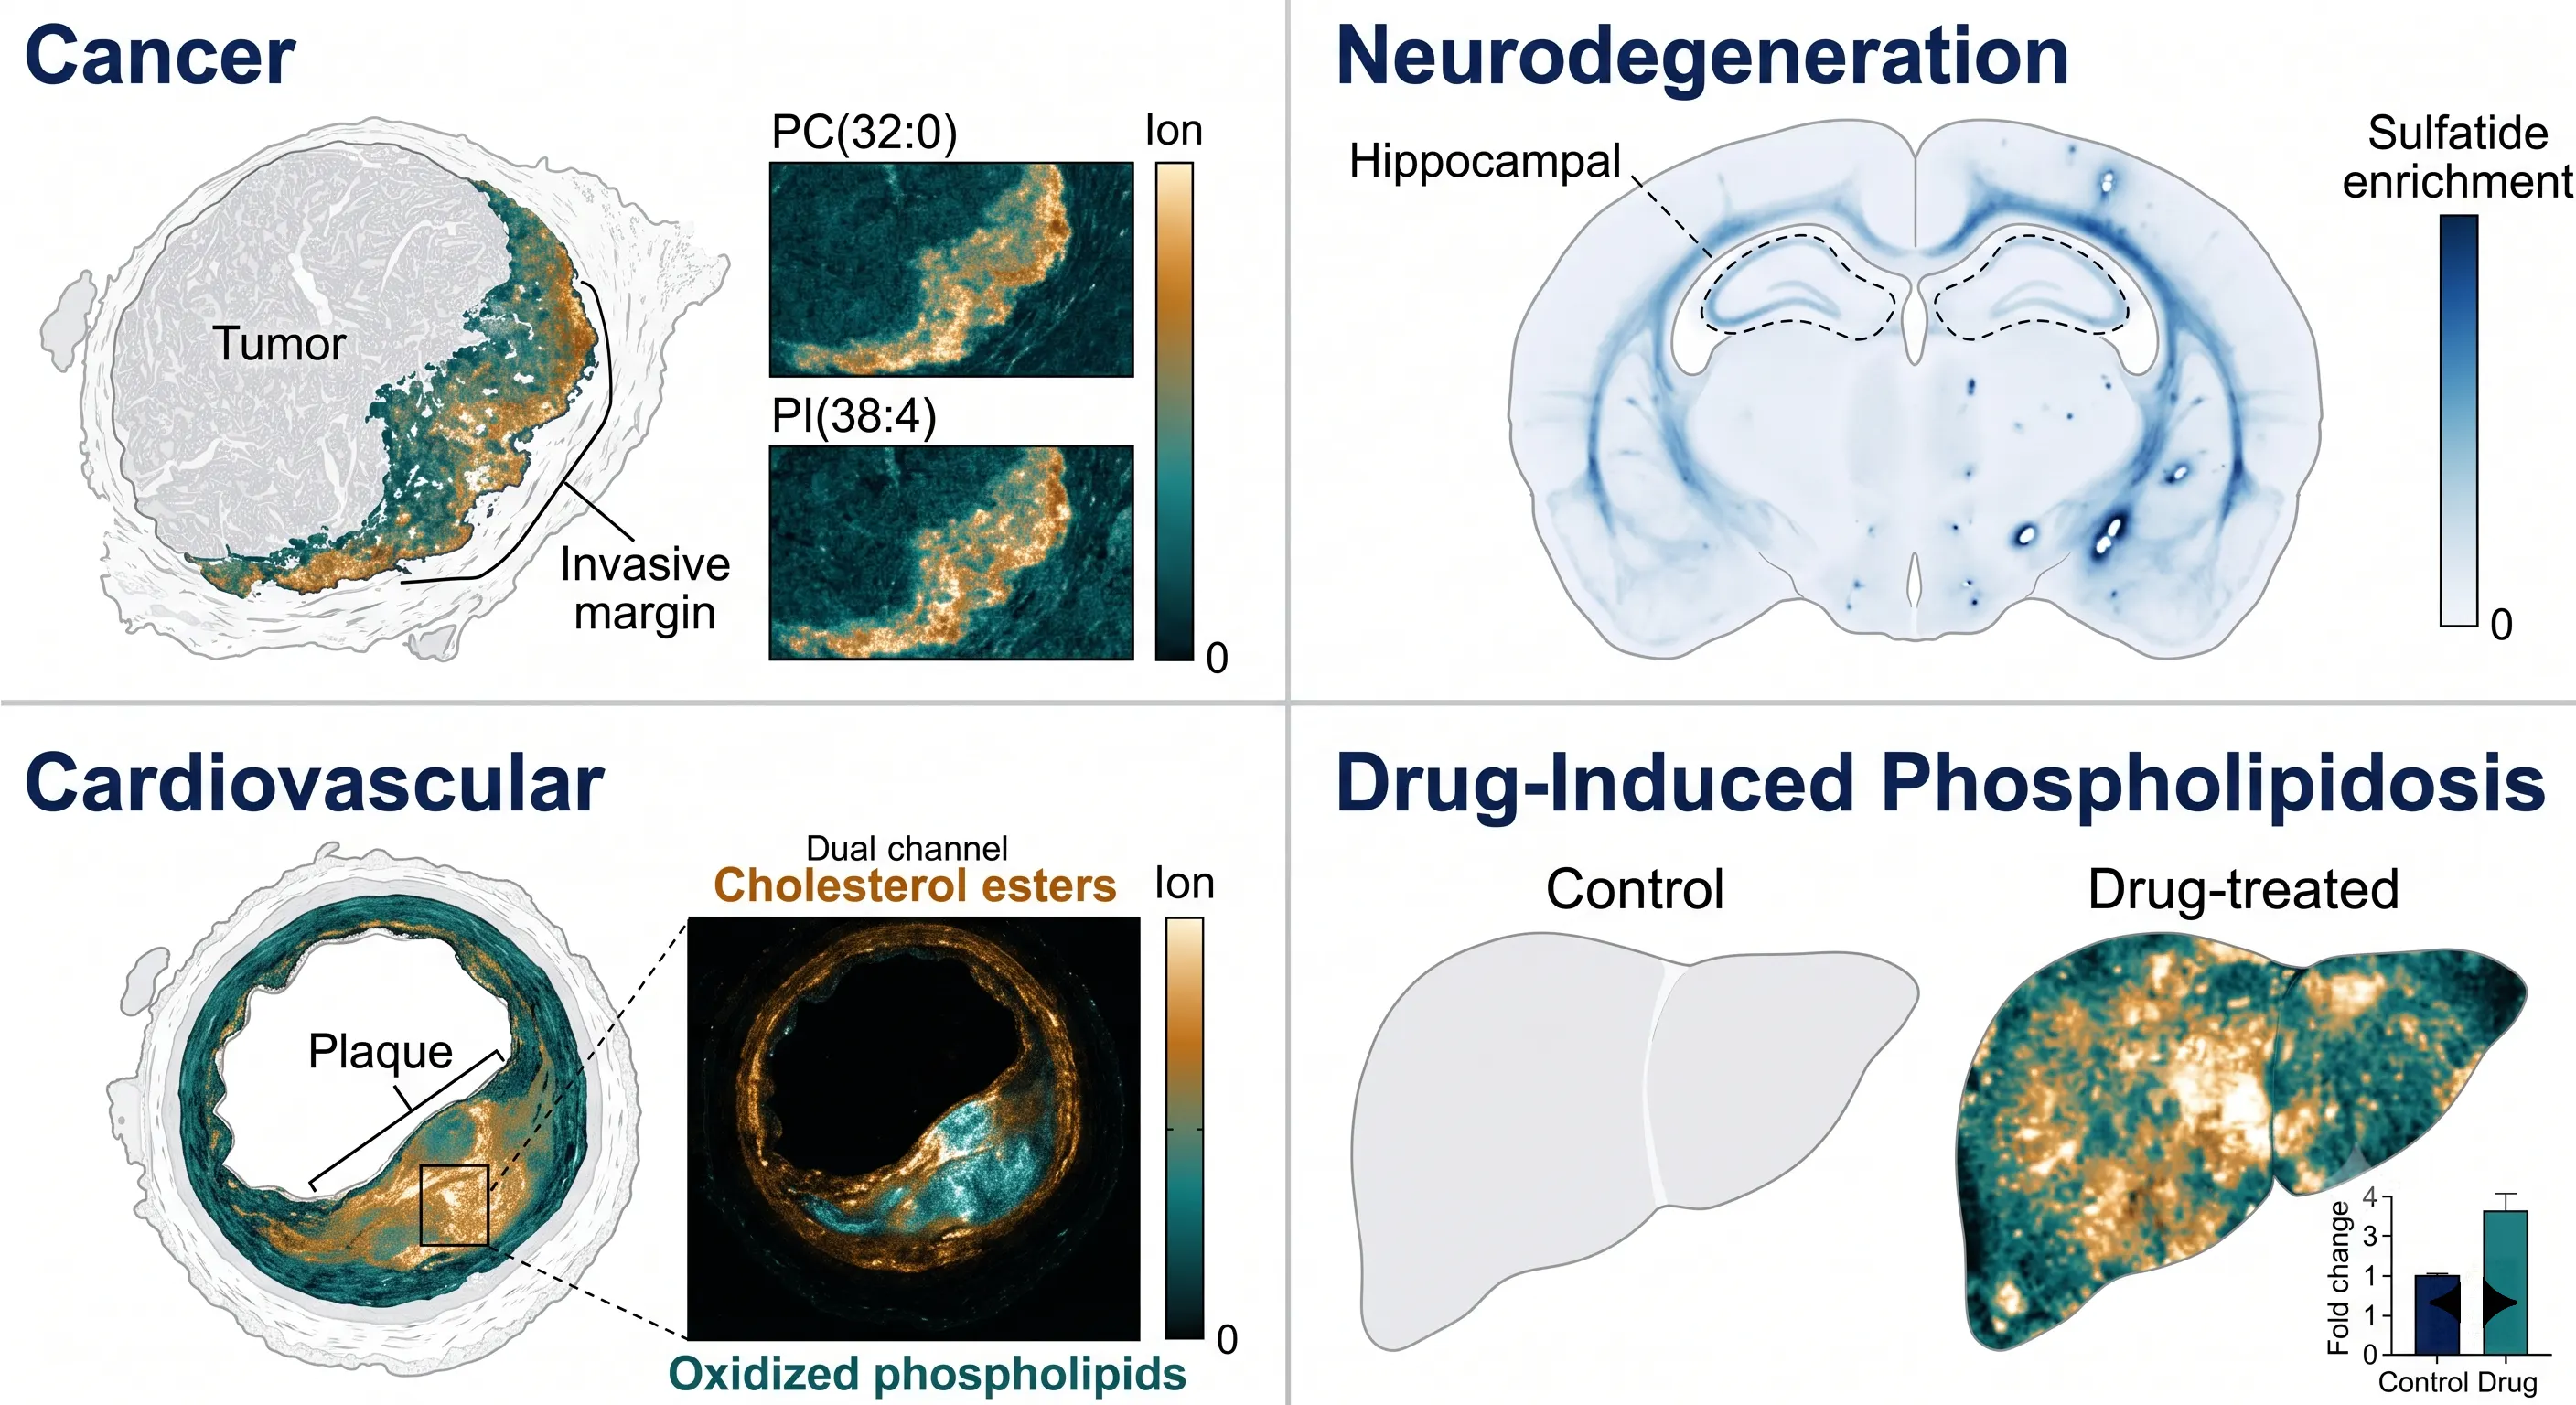 Figure 7: Application gallery — representative ion images from cancer, neurodegeneration, atherosclerosis, and drug-induced lipidomics studies.*
Limitations, Challenges, and Future Directions
Current Limitations
Spatial lipidomics remains several steps behind spatial transcriptomics in throughput and standardization:
Lipid isomer resolution. Most workflows cannot distinguish C=C positional, sn-positional, or chain isomers — a substantial fraction of structurally encoded biological information remains invisible. The tools exist (OzID, UVPD, Paternò-Büchi, ion mobility) but are not yet integrated into routine workflows.
Semi-quantitative nature. Without SIL internal standards per lipid class, MSI reports "more" or "less" but not absolute concentrations. Quantitative spatial MSI remains limited to the ~50 lipid species for which deuterated or odd-chain standards exist.
Throughput. A high-resolution MALDI-MSI experiment at 20 μm requires 30–90 minutes per section, limiting cohort sizes and making population-scale studies impractical.
Subcellular lipid mapping. SIMS and t-MALDI-2 approach subcellular resolution, but molecular information at these scales remains fragmentary — cholesterol can be localized but not whether it is free or esterified. Bridging nanoscale resolution with molecular-level identification is the field's grand challenge.
For experimental design and statistical methods for multi-condition studies, see our article on comparative spatial lipidomics.
Integration with Spatial Transcriptomics and Proteomics
The most exciting frontier is multi-omics integration — correlating lipid distributions with gene expression, protein abundance, and histology from the same or adjacent sections:
- Same-section: MALDI-MSI (non-destructive) followed by H&E and spatial transcriptomics on the identical section for pixel-level lipid-gene correlation. Integrated spatial multi-omics workflows enable this directly.
- Paired-section: Adjacent sections analyzed by complementary modalities with computational 2D registration aligning spatial proteomics and lipidomics datasets.
- Data integration: Statistical identification of spatially coherent lipid-transcriptome, lipid-proteome, and lipid-metabolome correlations.
Integrated spatial multi-omics workflows combine lipid spatial data with transcriptomics and proteomics, transforming descriptive mapping into mechanistic understanding.
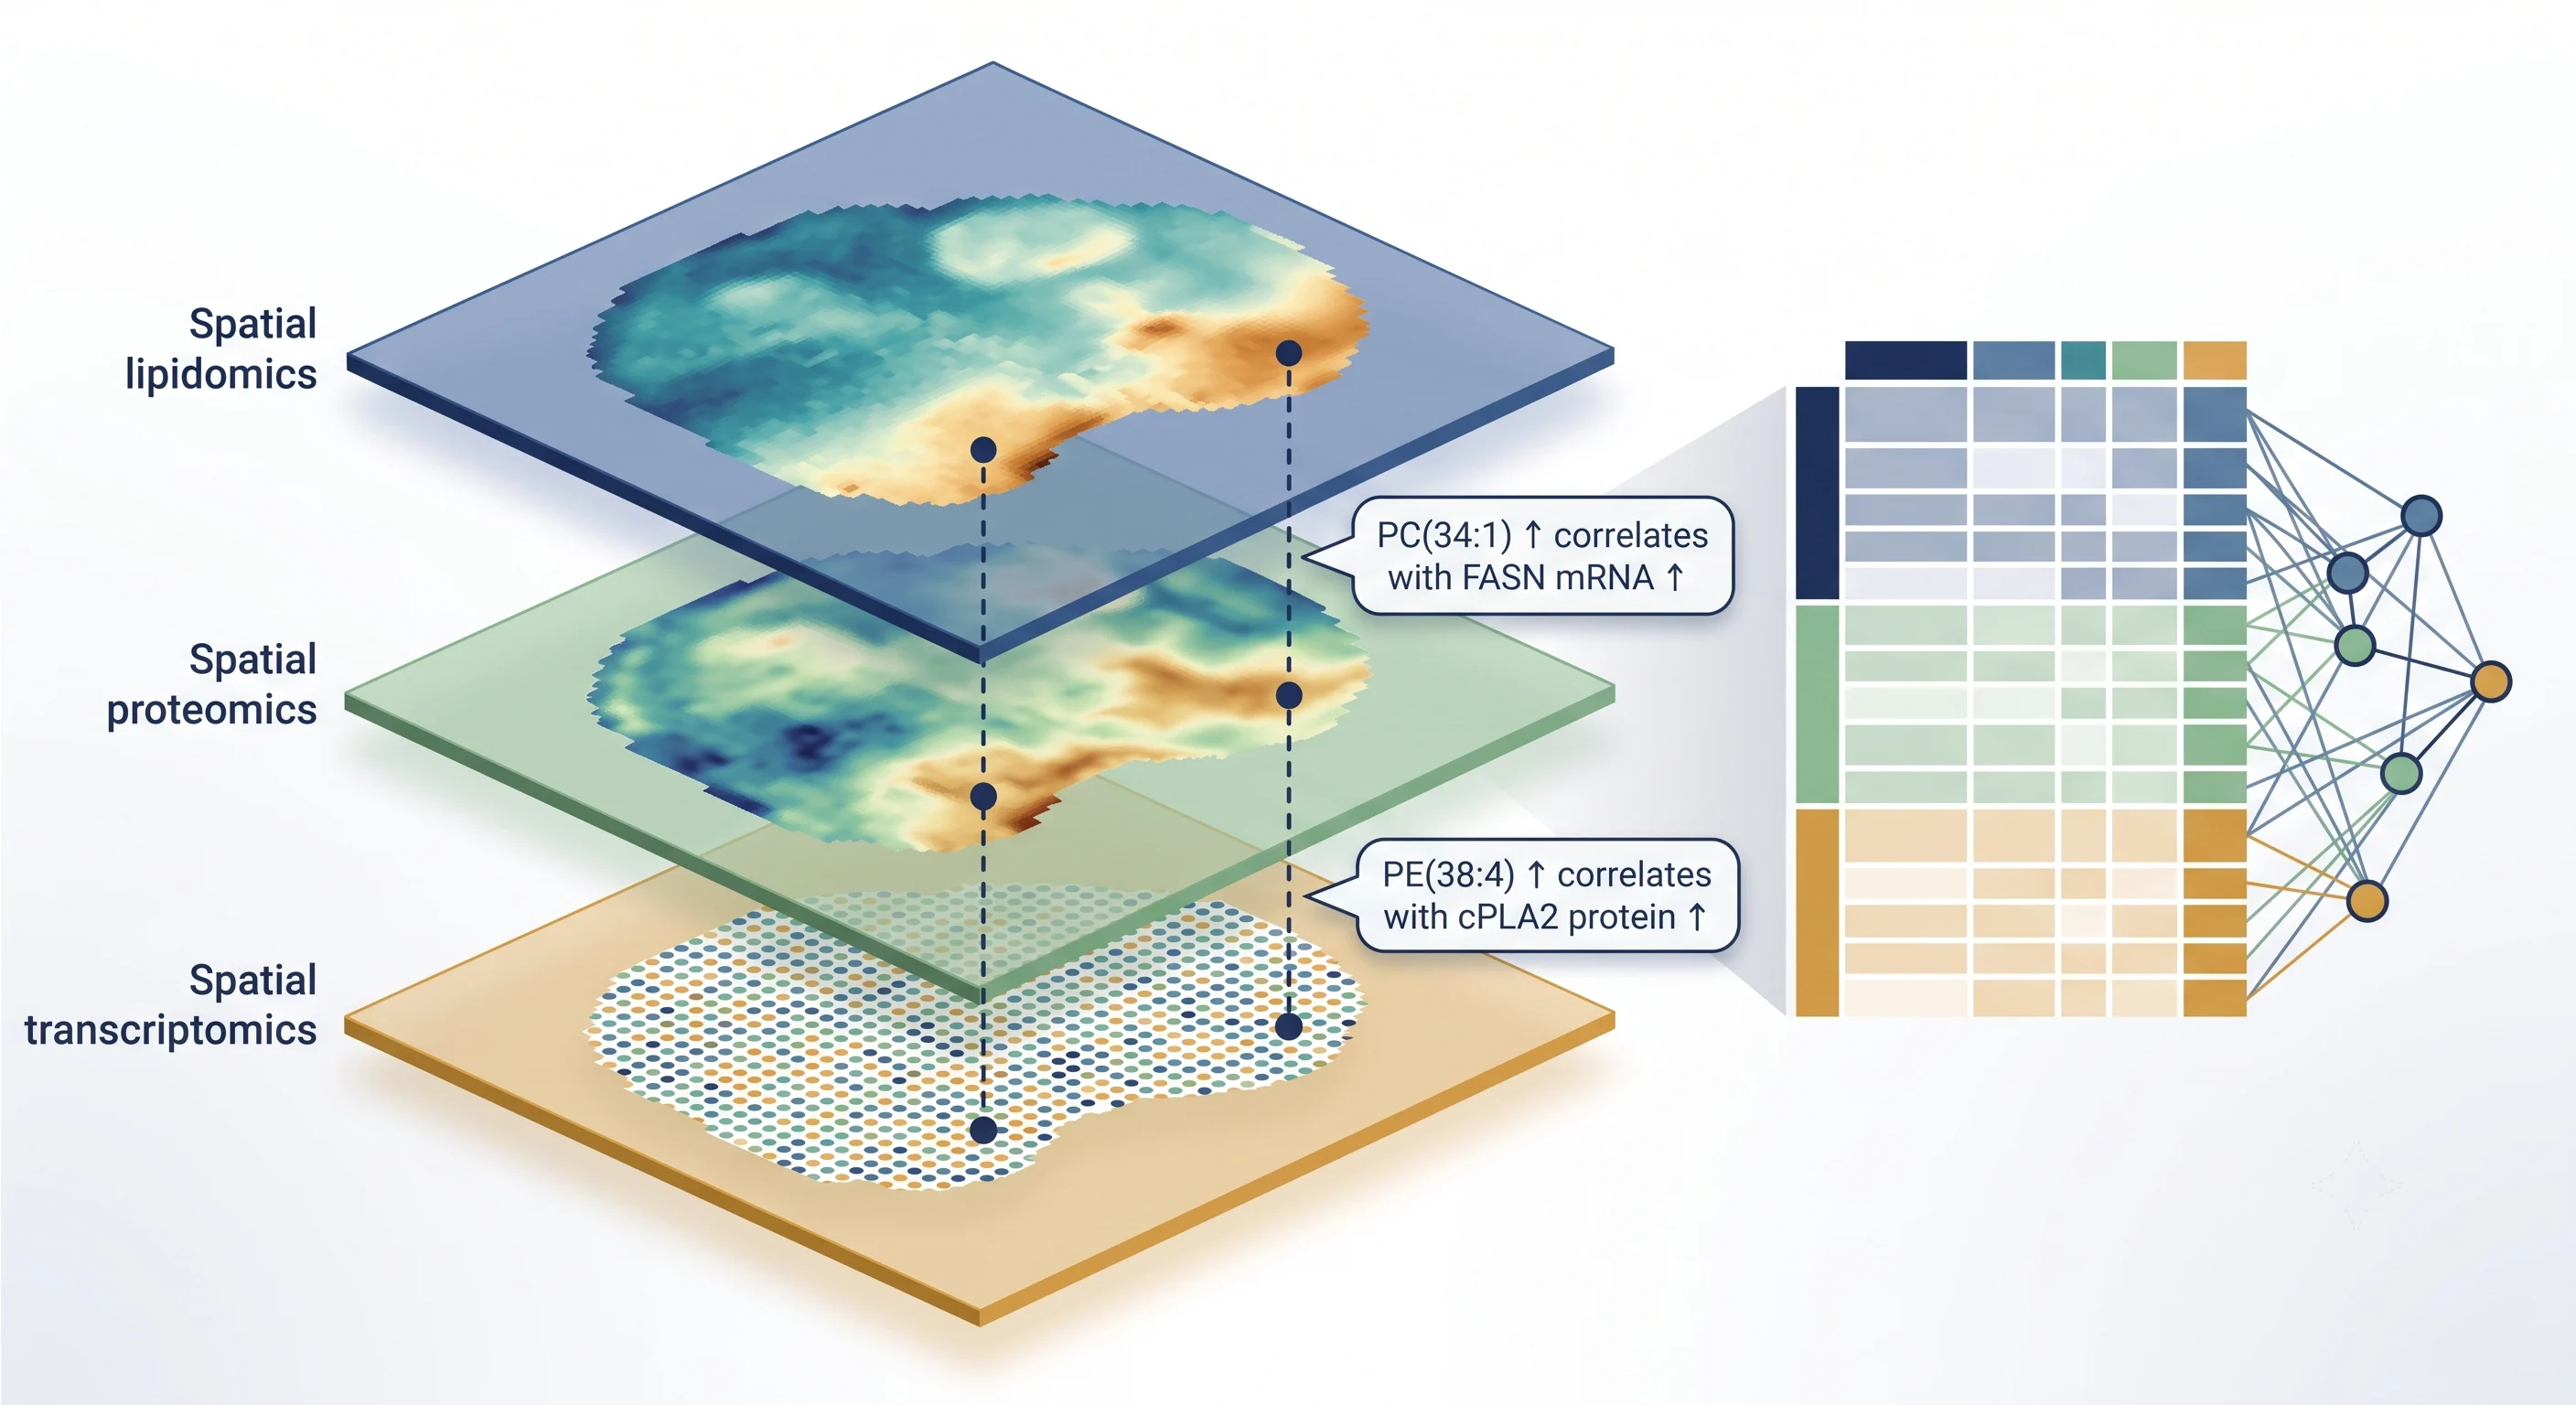 Figure 8: Integration with spatial multi-omics — conceptual diagram showing MSI lipidomics, spatial transcriptomics, and spatial proteomics data from the same tissue region.*
FAQ
Q: Q: Can I use FFPE tissue for spatial lipidomics?
No. Formalin fixation causes N-formylation of amine-containing lipids, methanol-induced methyl esterification, and residual PLA₂ activity. Ethanol/xylene processing strips structural lipids. Fresh-frozen tissue is the required substrate for reliable spatial lipidomics.
Q: Q: Do I need both positive and negative ion mode for comprehensive lipid coverage?
Yes. PC and SM ionize efficiently only in positive mode; PE, PS, and PI are suppressed by PC in positive mode and must be detected in negative mode. A complete analysis requires both polarities.
Q: Q: Which platform gives the best spatial resolution for lipids?
SIMS achieves<200 nm but detects fragment ions, not intact lipids. For intact species, MALDI at 5–10 μm provides the best balance; t-MALDI-2 pushes to 1 μm with post-ionization enhancement.
Q: Q: How many lipid species can I expect to detect in a typical MALDI-MSI experiment?
A standard 20 μm MALDI-MSI experiment on mouse brain or liver with DHB typically detects 200–500 features in positive mode and 100–300 in negative mode, with Level 2–3 identification for approximately 50–150 species.
Q: Q: Can I quantify lipids absolutely from MSI data?
Possible but demanding — requires on-tissue SIL internal standards, mimetic tissue calibration curves, and per-pixel normalization. Without these, MSI is semi-quantitative: reliable for relative comparisons, not absolute concentrations.
Q: Q: What is the biggest mistake researchers make when starting spatial lipidomics?
Treating lipids as generic metabolites. The two most common errors: (1) acquiring only positive-ion data — which misses PE, PS, PI, ceramides, sulfatides, and free fatty acids; and (2) using FFPE tissue, which introduces artifacts that make results irreproducible.
References:
- Liebisch G, Fahy E, Aoki J, et al. Update on LIPID MAPS classification, nomenclature, and shorthand notation for MS-derived lipid structures. J Lipid Res. 2020;61(12):1539-1555. doi:10.1194/jlr.S120001025
- Maimó-Barceló A, Martín-Saiz L, Fernández JA, et al. A comprehensive review of lipid imaging mass spectrometry: Sample preparation to clinical translation. Prog Lipid Res. 2025;97:101319. doi:10.1016/j.plipres.2025.101319
- Javorek AL, Sarsby J, Race AM, et al. Staining tissues with Basic Blue 7: A new dual-polarity matrix for MALDI mass spectrometry imaging. Anal Chem. 2025;97(7):2828-2836. doi:10.1021/acs.analchem.4c05244
- Chen Y, Angerer TB, Spraggins JM, Caprioli RM. Critical evaluation of sphingolipids detection by MALDI-MSI. J Am Soc Mass Spectrom. 2025;36(4):785-796. doi:10.1021/jasms.5c00012
- Uchino M, Imamura Y, Saito Y, et al. SMASH imaging: Serial MALDI acquisition strategy for high-resolution dual-polarity MS² spatial lipidomics. Anal Chem. 2026;98(12):4521-4530. doi:10.1021/acs.analchem.6c00123
- Amer S, Jiang L-X, Iqfath M, Weigand MR, Laskin J. Isomer-selective mass spectrometry imaging using nanospray desorption electrospray ionization (nano-DESI). Acc Chem Res. 2025;58(22):3281-3293. doi:10.1021/acs.accounts.5c00532
- Menéndez-Pedriza A, Navarro-Reig M, Jaumot J, et al. Comprehensive MSI-based protocols for the spatial lipidomics characterization of microscale organisms. Microchem J. 2025;204:112842. doi:10.1016/j.microc.2025.112842
- Bezdeková D, Hendrych M, Schwenzfeier J, Soltwisch J, Dreisewerd K, Vlček P, Preisler J, Bednařík A. Ozonization for MALDI-2 MS imaging of carbon-carbon double bond positional isomers of phosphatidylethanolamines in biological tissues. Anal Chim Acta. 2026;1382:344814. doi:10.1016/j.aca.2025.344814
- Wang Y, Wang H, Zhang S, Xi Y, Zhang Z. Desorption electrospray ionization mass spectrometry imaging: Principles, advancements, and multidisciplinary applications. J Mass Spectrom. 2025;60(5):e70004. doi:10.1002/jms.70004
- Dannhorn A, Kazanc E, Ling S, et al. Evaluation of formalin-fixed and FFPE tissues for spatially resolved metabolomics and drug distribution studies. Pharmaceuticals. 2022;15(11):1307. doi:10.3390/ph15111307
- Lei Z, Chen T, Li Y, et al. Graphene oxide/TiO₂ nanocomposite-assisted two-step ambient liquid extraction mass spectrometry imaging for comprehensively enhancing lipid coverage in spatial lipidomics. Anal Chem. 2024;96(49):19456-19465. doi:10.1021/acs.analchem.4c03955
- Zhang H, Lu K, Ebbini M, Huang P, Vertes A, Li L. Mass spectrometry imaging for spatially resolved multi-omics molecular mapping. npj Imaging. 2024;2:13. doi:10.1038/s44303-024-00025-3
- Jha D, Nair S, Bhargava R, et al. Spatial neurolipidomics — MALDI mass spectrometry imaging of lipids in brain pathologies. J Mass Spectrom. 2024;59(3):e5008. doi:10.1002/jms.5008
- Lukowski JK, Pamreddy A, Velickovic D, Bhatt DK, Anderton CR, Sharma K, et al. Storage conditions of human kidney tissue sections affect spatial lipidomics analysis reproducibility. J Am Soc Mass Spectrom. 2020;31(12):2538-2549. doi:10.1021/jasms.0c00256
- Rappez L, Stadler M, Triana S, et al. SpaceM reveals metabolic states of single cells. Nat Methods. 2021;18:799-805. doi:10.1038/s41592-021-01198-0
















