

* This article is the definitive MALDI-specific lipid imaging guide for researchers who have already decided on spatial lipidomics but need practical, class-specific matrix selection logic, a complete annotation pipeline from raw spectra to lipid identification, and coverage of 2025 breakthroughs that no existing review synthesizes — including dual-polarity single-deposition imaging at 5 μm, t-MALDI-2 at 1 μm for subcellular mapping, and on-tissue ozonolysis for C=C positional isomer resolution.
MALDI-MSI for Lipids — Why It Dominates Spatial Lipidomics
Matrix-assisted laser desorption/ionization mass spectrometry imaging (MALDI-MSI) accounts for approximately 70% of published spatial lipidomics studies. This dominance is not accidental — it reflects a fundamental match between the physicochemical properties of lipids and the ionization mechanism of MALDI. Unlike metabolites that require chromatographic separation or proteins that demand enzymatic digestion, lipids are naturally abundant in tissue, readily co-crystallize with organic matrices, and ionize efficiently under laser desorption. The result is routine detection of 200–500 lipid species from a single tissue section at 20–50 μm spatial resolution (Maimó-Barceló et al., 2025).
For a broader comparison of MALDI against DESI, SIMS, and other MSI platforms — including a four-axis decision framework for technology selection — see our pillar article on spatial lipidomics by mass spectrometry imaging.
Lipid Ionization in MALDI: Laser Energy Transfer and Matrix Co-Crystallization
The MALDI lipid imaging workflow begins with matrix application — an organic acid that absorbs UV laser energy (typically 355 nm Nd:YAG), transfers protons to co-crystallized analytes, and facilitates desorption into the gas phase. For lipid analysis, the matrix serves three functions beyond energy transfer: it extracts lipids from the tissue surface, isolates them within growing crystals (preventing analyte aggregation), and provides the proton source for ionization. This matrix-tissue-lipid interaction is lipid-class-specific — the same matrix that produces excellent phosphatidylcholine (PC) spectra may yield negligible phosphatidylethanolamine (PE) signals.
The ionization mechanism itself favors lipids: the proton affinity of lipid head groups, particularly the quaternary ammonium of PC and sphingomyelin (SM), enables efficient [M+H]⁺ formation. Sodium and potassium adducts ([M+Na]⁺, [M+K]⁺) are ubiquitous in biological tissue and further contribute to the total ion current — a practical consideration because adduct distribution varies by tissue type and sodium content, complicating cross-sample comparisons.
TOF vs. Orbitrap vs. FTICR for Lipid Imaging: Mass Accuracy Requirements
Mass analyzer choice directly impacts lipid identification confidence. For MALDI lipid imaging, three analyzer types dominate:
- TOF (time-of-flight): The most widely deployed analyzer for MALDI-MSI. Modern TOF instruments achieve mass resolution of 40,000–60,000 (FWHM) and mass accuracy of 1–5 ppm, sufficient for Level 3–4 lipid identification (sum composition and accurate mass, respectively). TOF's speed — acquiring a full spectrum in microseconds — enables rapid tissue imaging at high pixel densities.
- Orbitrap: Offers mass resolution of 140,000–480,000 and sub-ppm mass accuracy, enabling confident Level 2–3 identification without MS/MS in many cases. The trade-off is scan speed: Orbitrap acquisition is slower than TOF (0.5–2 seconds per pixel vs. microseconds), increasing total imaging time for large tissue sections.
- FTICR (Fourier-transform ion cyclotron resonance): The gold standard for mass accuracy (resolution >1,000,000, accuracy<0.2 ppm), enabling isobaric lipid discrimination that TOF and Orbitrap cannot achieve. FTICR can separate PC(34:1) [M+H]⁺ (m/z 760.5851) from PE(37:1) [M+Na]⁺ (m/z 760.5482) — a 37 mDa difference invisible to lower-resolution analyzers. The trade-off is acquisition time and cost.
For most biological questions, TOF or Orbitrap provides sufficient mass accuracy for lipid identification when combined with MS/MS validation. FTICR is indicated when isobaric discrimination is central to the hypothesis — for example, distinguishing PC and PE species that overlap at nominal mass in positive-ion mode.
Matrix Selection for Lipid Classes
Matrix choice is the single most consequential decision in a MALDI lipid imaging experiment. No universal matrix exists — each favors specific lipid classes, polarity modes, and spatial resolution targets. This section provides a class-specific matrix selection logic that existing reviews lack.
DHB (2,5-Dihydroxybenzoic Acid): The Universal Lipid Starting Point
DHB is the most widely used MALDI matrix for lipid analysis, employed in approximately 53% of published lipid MSI studies. It provides broad coverage of glycerophospholipids and sphingolipids in positive-ion mode, with excellent PC and SM signals. DHB sublimes efficiently, producing a uniform small-crystal coating ideal for 10–20 μm spatial resolution imaging. Its limitations include poor negative-ion performance relative to dedicated negative-mode matrices and significant matrix cluster interference below m/z 400, obscuring free fatty acids and small metabolites.
DAN (1,5-Diaminonaphthalene): Neutral Lipids and Negative-Mode Ceramides
DAN is the preferred matrix for neutral lipid detection in positive mode (TAG, DAG, cholesteryl esters) and ceramide/sulfatide imaging in negative mode. Its low proton affinity reduces matrix background, and its ability to form [M+NH₄]⁺ adducts with neutral lipids enables detection of species invisible to DHB. However, DAN introduces lipid-class-specific artifacts: in negative mode, DAN demethylates PC to [M−CH₃]⁻, generating signals isomeric with PE. SM produces artifactual ceramide-1-phosphate (C1P) signals. These artifacts must be accounted for during annotation.
9-Aminoacridine (9-AA): The Standard for Negative-Mode Comprehensive Lipid Imaging
9-AA is the matrix of choice for comprehensive negative-ion lipid imaging. It produces minimal background across the phospholipid mass range and enables simultaneous detection of PE, PS, PI, PG, PA, and sulfatides. For experiments requiring complete phospholipid coverage — particularly PE and PS species that are suppressed by PC in positive mode — 9-AA is essential. Its limitation is poor positive-mode performance, requiring separate acquisitions on adjacent sections for dual-polarity coverage.
NEDC and the Dual-Polarity Single-Deposition Revolution
N-(1-naphthyl)ethylenediamine dihydrochloride (NEDC) represents a 2025 advance in dual-polarity lipid imaging. A single NEDC deposition enables sequential positive- and negative-ion acquisition on the same tissue section at 5 μm resolution, eliminating the need for separate matrix applications on adjacent sections. This dual-polarity capability is transformative for studies where tissue is limited or where pixel-level correlation between positive-mode (PC, SM) and negative-mode (PE, PS, PI) lipid distributions is required.
Aminated Cinnamic Acid Analogs: High-Resolution Dual-Polarity at 5 μm
Dufresne et al. (2025) introduced 4-aminocinnamic acid (ACA) and 4-(dimethylamino)cinnamic acid (DMACA) as dual-polarity matrices for high-resolution MALDI imaging. DMACA demonstrated superior sensitivity for phospholipids and sulfatides at ≤10 μm pixel sizes, outperforming DAN and DHA, while requiring lower laser power — reducing tissue damage and enabling multimodal studies on single sections. At 5 μm pixel size, DMACA maintains lipid annotation quality that traditionally required 20–50 μm with DHB.
6-Aza-2-Thiothymine (ATT): A Single Matrix for FFPE Lipid Imaging
Porto et al. (2025) evaluated ATT against DHB and norharmane for lipid imaging of FFPE clinical samples. ATT enabled annotation of 98 lipids in positive mode (60.2% glycerophospholipids, 32.7% sphingolipids) and 62 lipids in negative mode (vs. only 21 for DHB) from FFPE glioblastoma tissue microarrays at 20 μm resolution. This positions ATT as a practical matrix for archival FFPE tissue analysis — a sample type notoriously challenging for lipid MSI due to formalin-induced N-formylation and lipid stripping during processing.
Matrix Selection Decision Tree
The following logic integrates the above into a practical selection framework:
1. Fresh-frozen tissue, broad lipid coverage needed → DHB (positive) + 9-AA (negative) on adjacent sections.
2. Single section, dual polarity required → NEDC or DMACA, single deposition.
3. Neutral lipids (TAG, DAG, CE) are the target → DAN, positive mode with NH₄⁺ doping.
4. FFPE tissue, lipid analysis unavoidable → ATT, acknowledge polar metabolite loss.
5. Highest spatial resolution (≤5 μm) + dual polarity → DMACA or ACA.
6. Ceramides and sulfatides as primary targets → DAN or 9-AA, negative mode.
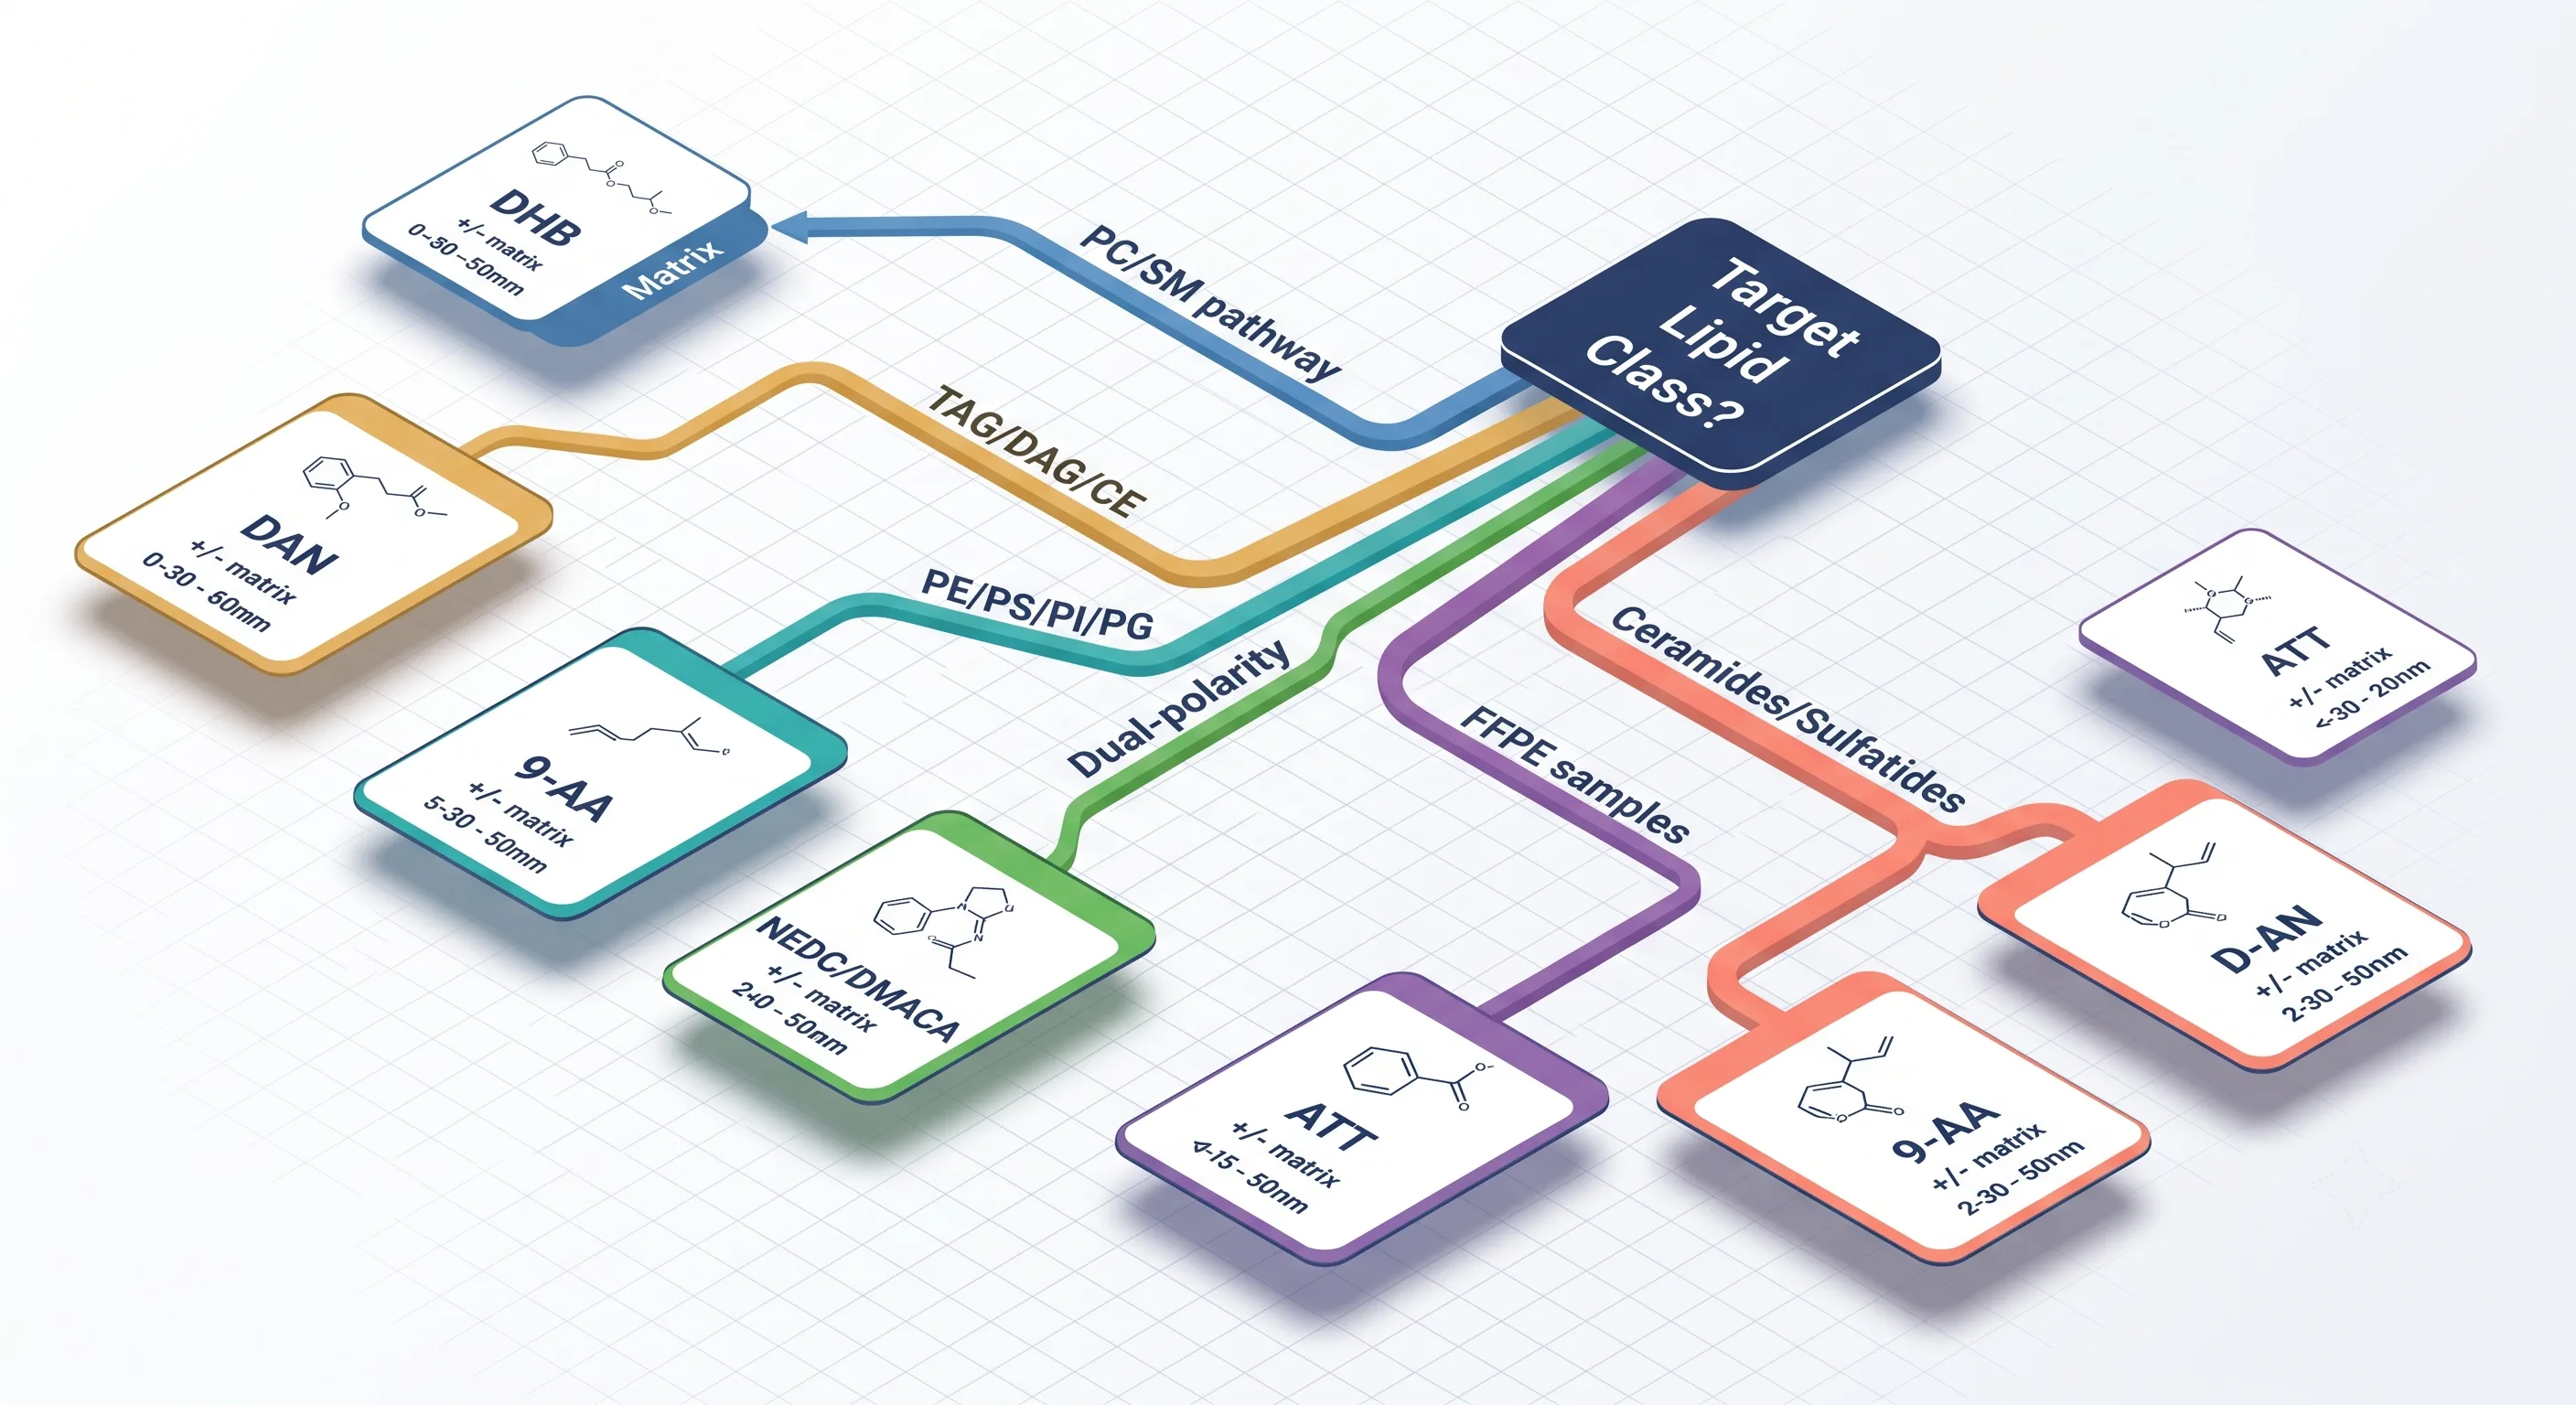 Figure 1: Matrix selection decision tree for lipid classes — color-coded flowchart mapping lipid class x polarity x spatial resolution target to optimal matrix choice.*
This decision logic is lipid-class-specific — the matrix choice flows from the target lipid class, not generic platform preference. For a complete platform comparison across MALDI, DESI, SIMS, and IR-MALDESI, see our spatial lipidomics technology landscape guide.
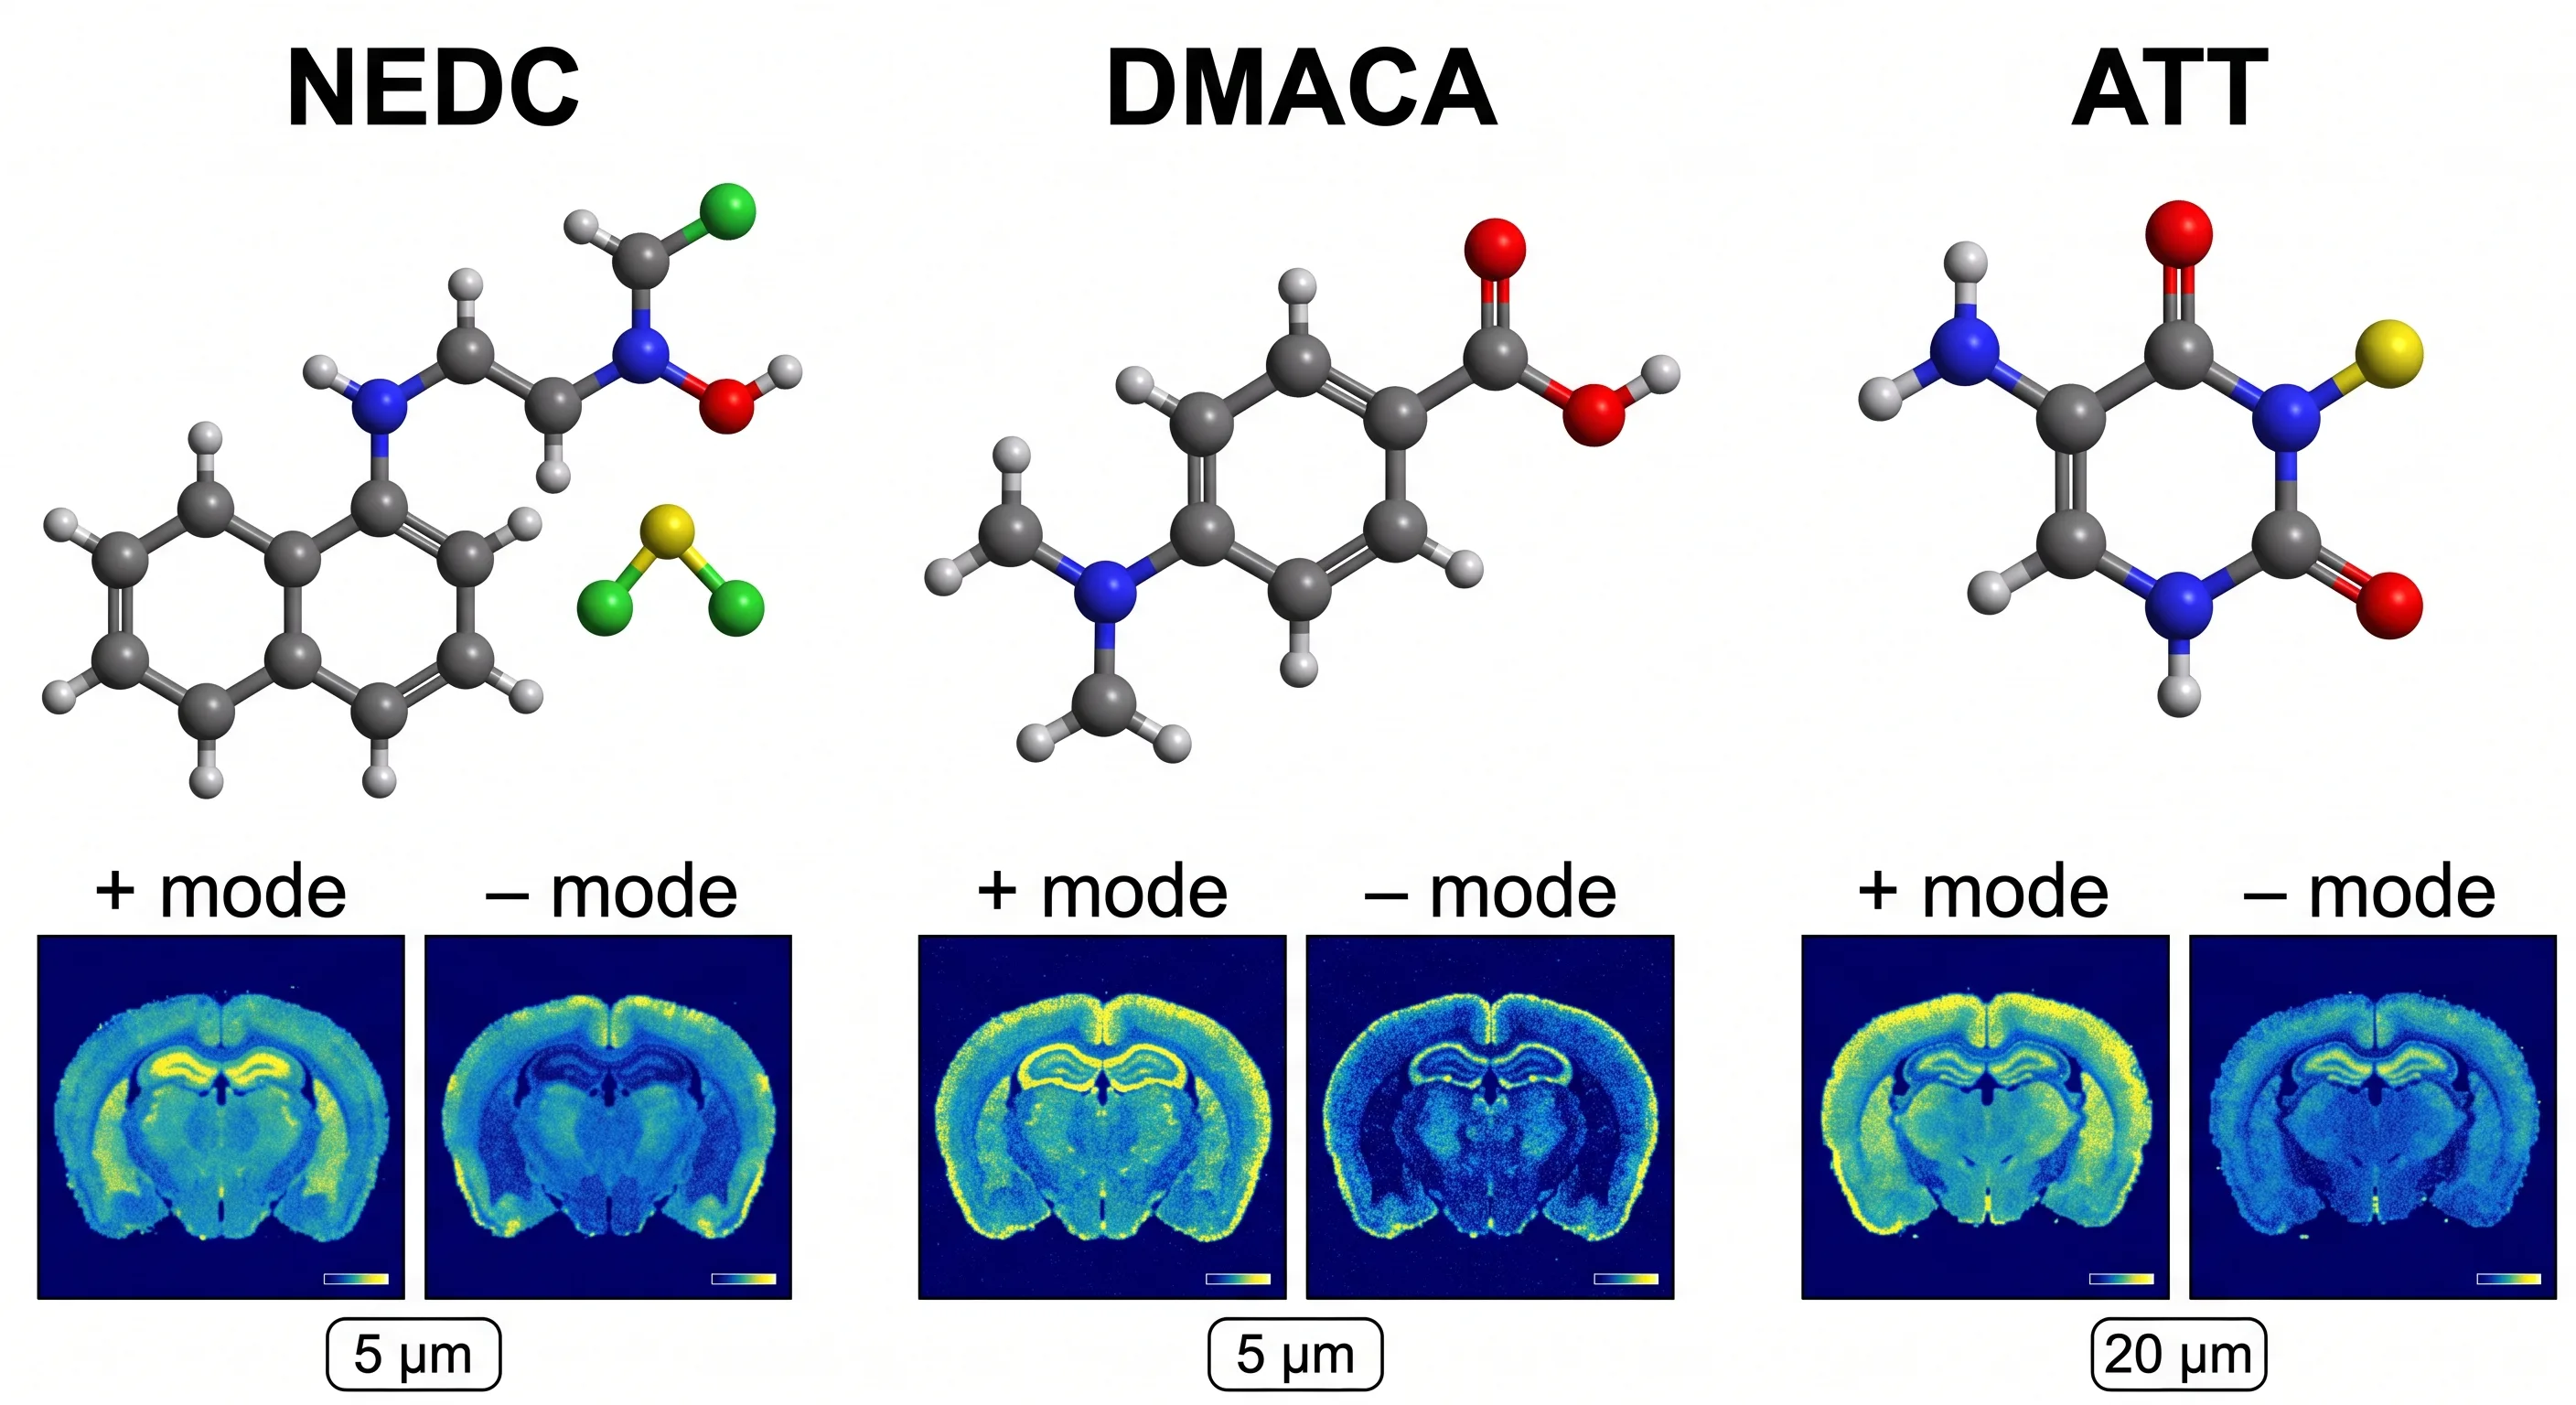 Figure 2: Dual-polarity matrix comparison — NEDC, DMACA, and ATT chemical structures with representative ion images from a single tissue section in both positive and negative modes.*
Lipid Annotation from MALDI-MSI Data
Lipid identification in MALDI-MSI is fundamentally more challenging than in LC-MS lipidomics because MSI lacks chromatographic retention time as an orthogonal separation dimension. Every pixel contains the full tissue lipidome co-ionized, making accurate mass alone insufficient and MS/MS essential for confident identification.
Accurate Mass Matching to LIPID MAPS and LipidSearch
The first annotation step is accurate mass matching against curated lipid databases. The LIPID MAPS Structure Database (LMSD) contains over 45,000 curated lipid species with exact monoisotopic masses, supporting batch-matching of m/z feature lists with user-defined mass tolerance (±3 ppm) and adduct specifications. For MALDI imaging lipidomics data, database hits at Level 4 (accurate mass match only) should be treated as tentative — isobaric ambiguity is common, particularly between PC and PE species differing by<50 mDa.
LipidSearch (Thermo Fisher Scientific) applies lipid-class-specific fragmentation rules for automated Level 2–3 identification from both LC-MS and MSI data. Its rule-based approach recognizes characteristic head group fragments — m/z 184 for phosphocholine (PC, SM), neutral loss of 141 Da for phosphoethanolamine (PE), m/z 87 for phosphoserine (PS) — to confirm lipid class assignments that accurate mass alone cannot distinguish.
MS/MS for Lipid Structural Identification
MS/MS fragmentation is the gateway from Level 4 (accurate mass) to Level 2–3 (molecular species and sum composition) identification:
- Head group identification: Characteristic fragments confirm lipid class: m/z 184 (phosphocholine head group, PC/SM), neutral loss of 141 Da (phosphoethanolamine, PE), and m/z 87 (phosphoserine, PS). These fragments are the first structural confirmation step beyond accurate mass.
- Fatty acyl composition (Level 3 → Level 2): Negative-ion MS/MS detects carboxylate anions of individual fatty acyl chains — m/z 255 (C16:0), m/z 281 (C18:1), m/z 283 (C18:0) — revealing the total carbon and double bond composition. For example, detecting carboxylate anions at m/z 255 and m/z 281 from a PE precursor identifies PE(16:0/18:1) at Level 2 molecular species confidence.
- sn-Position assignment: Relative carboxylate fragment abundance can suggest sn-1 vs. sn-2 chain position, though this is not always unambiguous without specialized fragmentation or ion mobility.
METASPACE: Spatial Coherence as an Annotation Filter
METASPACE is a cloud-based annotation platform specifically designed for spatial metabolomics and lipidomics. Its key innovation is incorporating spatial coherence into the identification algorithm — if an m/z feature produces an anatomically meaningful ion image (e.g., white-matter-specific distribution for a candidate sulfatide), its identification confidence increases. Conversely, features producing random "salt-and-pepper" distributions are penalized regardless of mass accuracy. METASPACE applies false discovery rate (FDR) control to MSI annotations, a critical quality metric absent from most database-matching workflows.
For comprehensive untargeted lipidomics by LC-MS, complementary depth beyond what MSI alone can provide is available.
Confidence Levels in Lipid Identification
The Lipidomics Standards Initiative (LSI) defines four identification levels, which apply directly to MALDI-MSI:
| Level | Description | Requirement | Typical MSI Scenario |
|---|---|---|---|
| Level 4 | Accurate mass match | m/z within ±3 ppm of database entry | Default for most MSI studies; isobaric ambiguity unresolved |
| Level 3 | Sum composition | MS/MS confirms lipid class + total C and double bond count | Routine with on-tissue MS/MS |
| Level 2 | Molecular species | MS/MS resolves individual fatty acyl chain composition | Achievable with high-quality negative-ion MS/MS |
| Level 1 | Full structure | sn-Position, C=C location/geometry, chain branching resolved | Requires ion mobility, OzID, UVPD, or derivatization |
For most biological questions, Level 2–3 identification is sufficient — confirming which lipid species change between conditions rather than resolving every isomeric nuance. Both untargeted and targeted spatial lipidomics workflows can achieve Level 2–3 with appropriate MS/MS acquisition strategies.
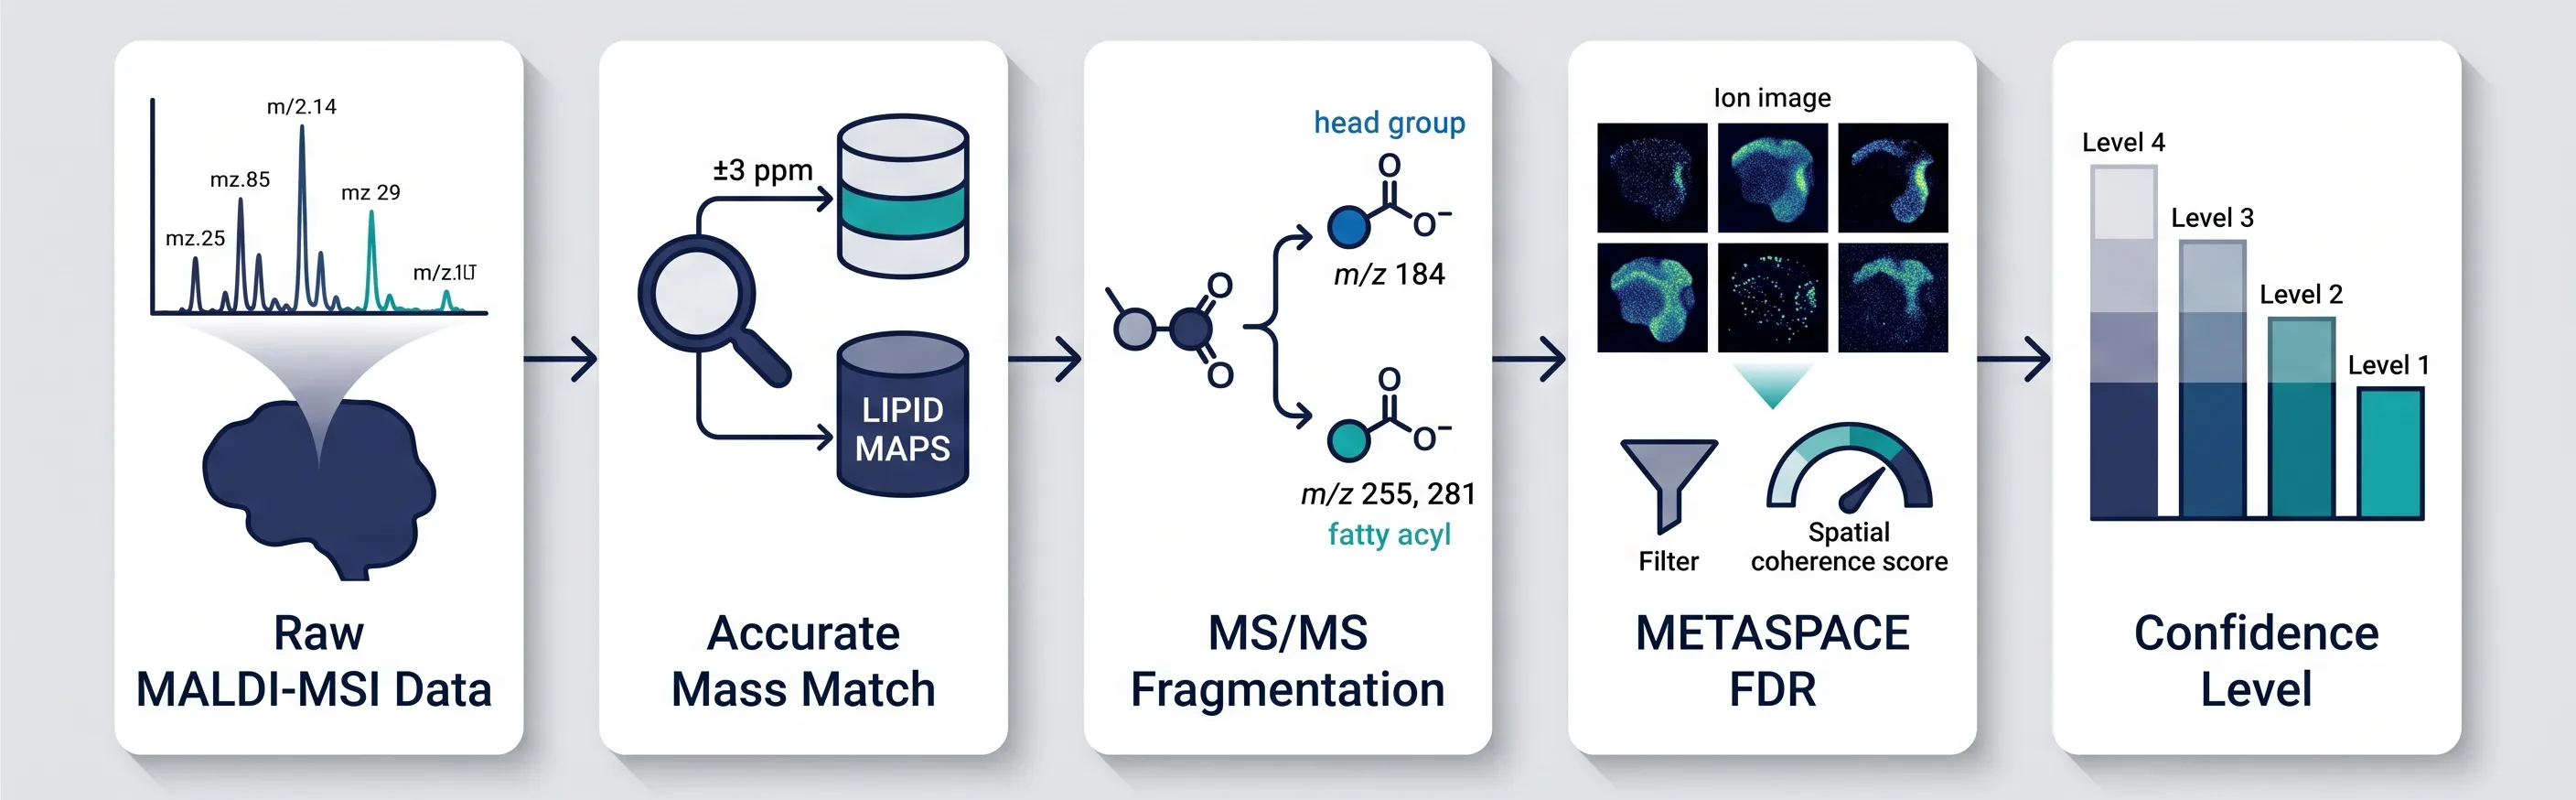 Figure 3: Lipid annotation pipeline — from raw MALDI-MSI data through accurate mass matching (LIPID MAPS), MS/MS fragmentation (head group + fatty acyl identification), METASPACE spatial FDR filtering, and final confidence level assignment.*
Advanced MALDI Lipid Imaging: 2025 Breakthroughs
Four developments from 2025–2026 have substantially expanded what MALDI lipid imaging can achieve. These are not incremental improvements — they represent capability jumps that researchers evaluating lipid MSI should understand.
Dual-Polarity Single-Deposition at 5 μm
The NEDC and DMACA matrices described above are part of a broader trend: eliminating the need for separate positive- and negative-mode acquisitions on different tissue sections. This is practically significant because pixel-level correlation of positive-mode lipids (PC, SM) with negative-mode lipids (PE, PS, PI) on the same tissue coordinates requires perfect spatial registration — impossible across different sections due to subtle tissue deformation during sectioning and matrix application. Single-deposition dual-polarity imaging solves this registration problem natively.
SMASH imaging (Uchino et al., Anal Chem 2026) extends this concept further: Serial MALDI acquisition on the same tissue pixels, using two complementary matrices applied sequentially, visualized over 400 lipid species at 30 μm resolution with MS² structural characterization. At 5 μm, eight layers of SMASH imaging annotated 25 lipid species validated against LC-MS/MS from laser-microdissected brain regions.
t-MALDI-2 at 1 μm: Subcellular Lipid Mapping
Transmission-mode MALDI (t-MALDI), where the laser fires through the back of a thin tissue section, combined with MALDI-2 post-ionization (a second laser pulse fired into the desorbed plume), achieves 1 μm spatial resolution — approaching individual organelle scale. t-MALDI-2 has been applied to map phagolysosomal lipid composition, revealing that specific PC and PS species concentrate in phagosomal membranes during immune activation, lipid distributions invisible at conventional 20 μm resolution. The trade-off is severe: at 1 μm, the number of detectable lipid species drops to 50–200, and acquisition time increases proportionally to the pixel count.
On-Tissue Ozonolysis + MALDI-2 for C=C Positional Isomers
Bezdeková et al. (Anal Chim Acta 2026) demonstrated on-tissue ozonolysis coupled with MALDI-2 for imaging carbon-carbon double bond positional isomers of phosphatidylethanolamines in biological tissues. Ozone selectively cleaves C=C bonds; the resulting ozonide fragments in MS/MS reveal the original double bond position. When combined with MALDI-2 post-ionization, this workflow images the spatial distribution of PE C=C positional isomers — for example, distinguishing PE(18:1Δ9/18:1Δ9) from PE(18:1Δ11/18:1Δ11) — directly on mouse brain and kidney tissue. This is a landmark because C=C positional isomers have distinct biological functions (oleic acid Δ9 vs. vaccenic acid Δ11) but identical masses and near-identical MS/MS spectra under standard conditions.
3D Spatial Lipidomics: Depth-Resolved Lipid Atlases
Serial section MALDI-MSI followed by computational 3D reconstruction generates volumetric lipid atlases of entire organs. Lu et al. (2025) applied this approach to an Alzheimer's disease mouse model, reconstructing lipid distributions across four coronal brain levels integrated with targeted proteomic analysis to map how sulfatide and ceramide depletion patterns extend through the hippocampal formation in three dimensions, co-localized with neuroinflammatory protein markers. These 3D lipid atlases reveal spatial patterns — such as perivascular ceramide gradients — invisible in single-section 2D imaging.
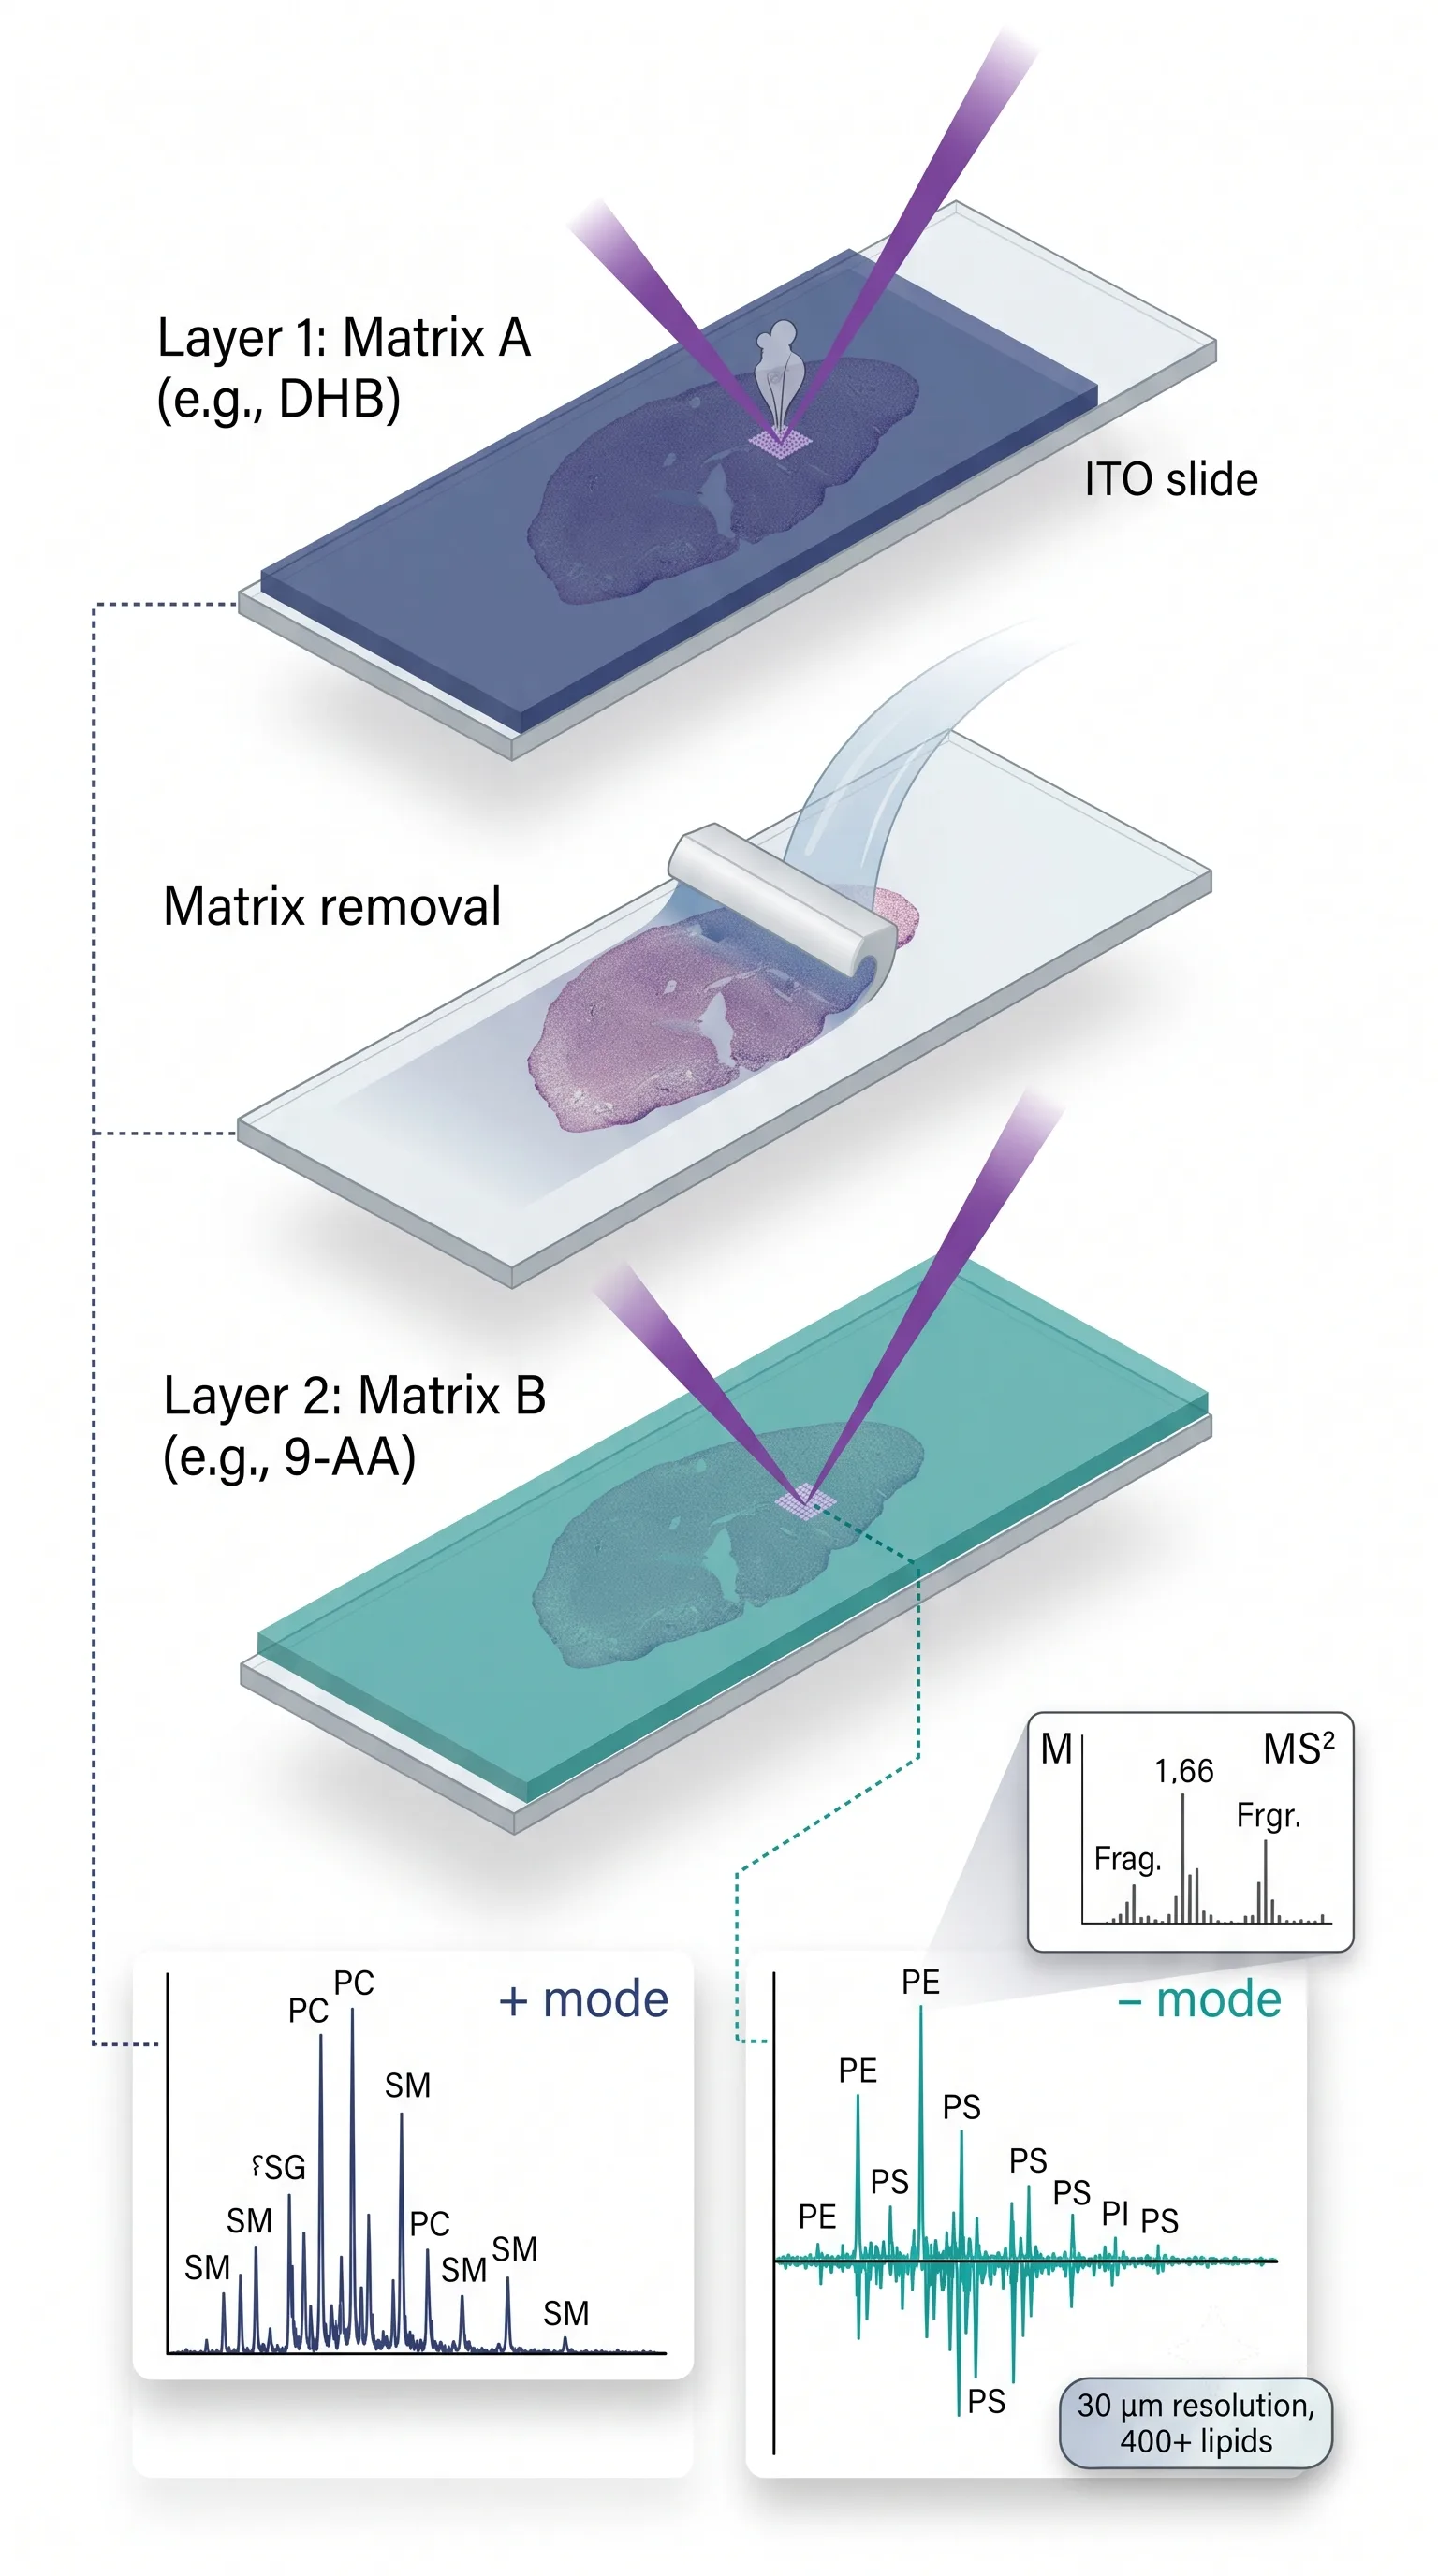 Figure 4: SMASH imaging workflow — schematic showing serial MALDI acquisition on the same tissue pixels with two complementary matrices, dual-polarity spectra, and MS² validation.*
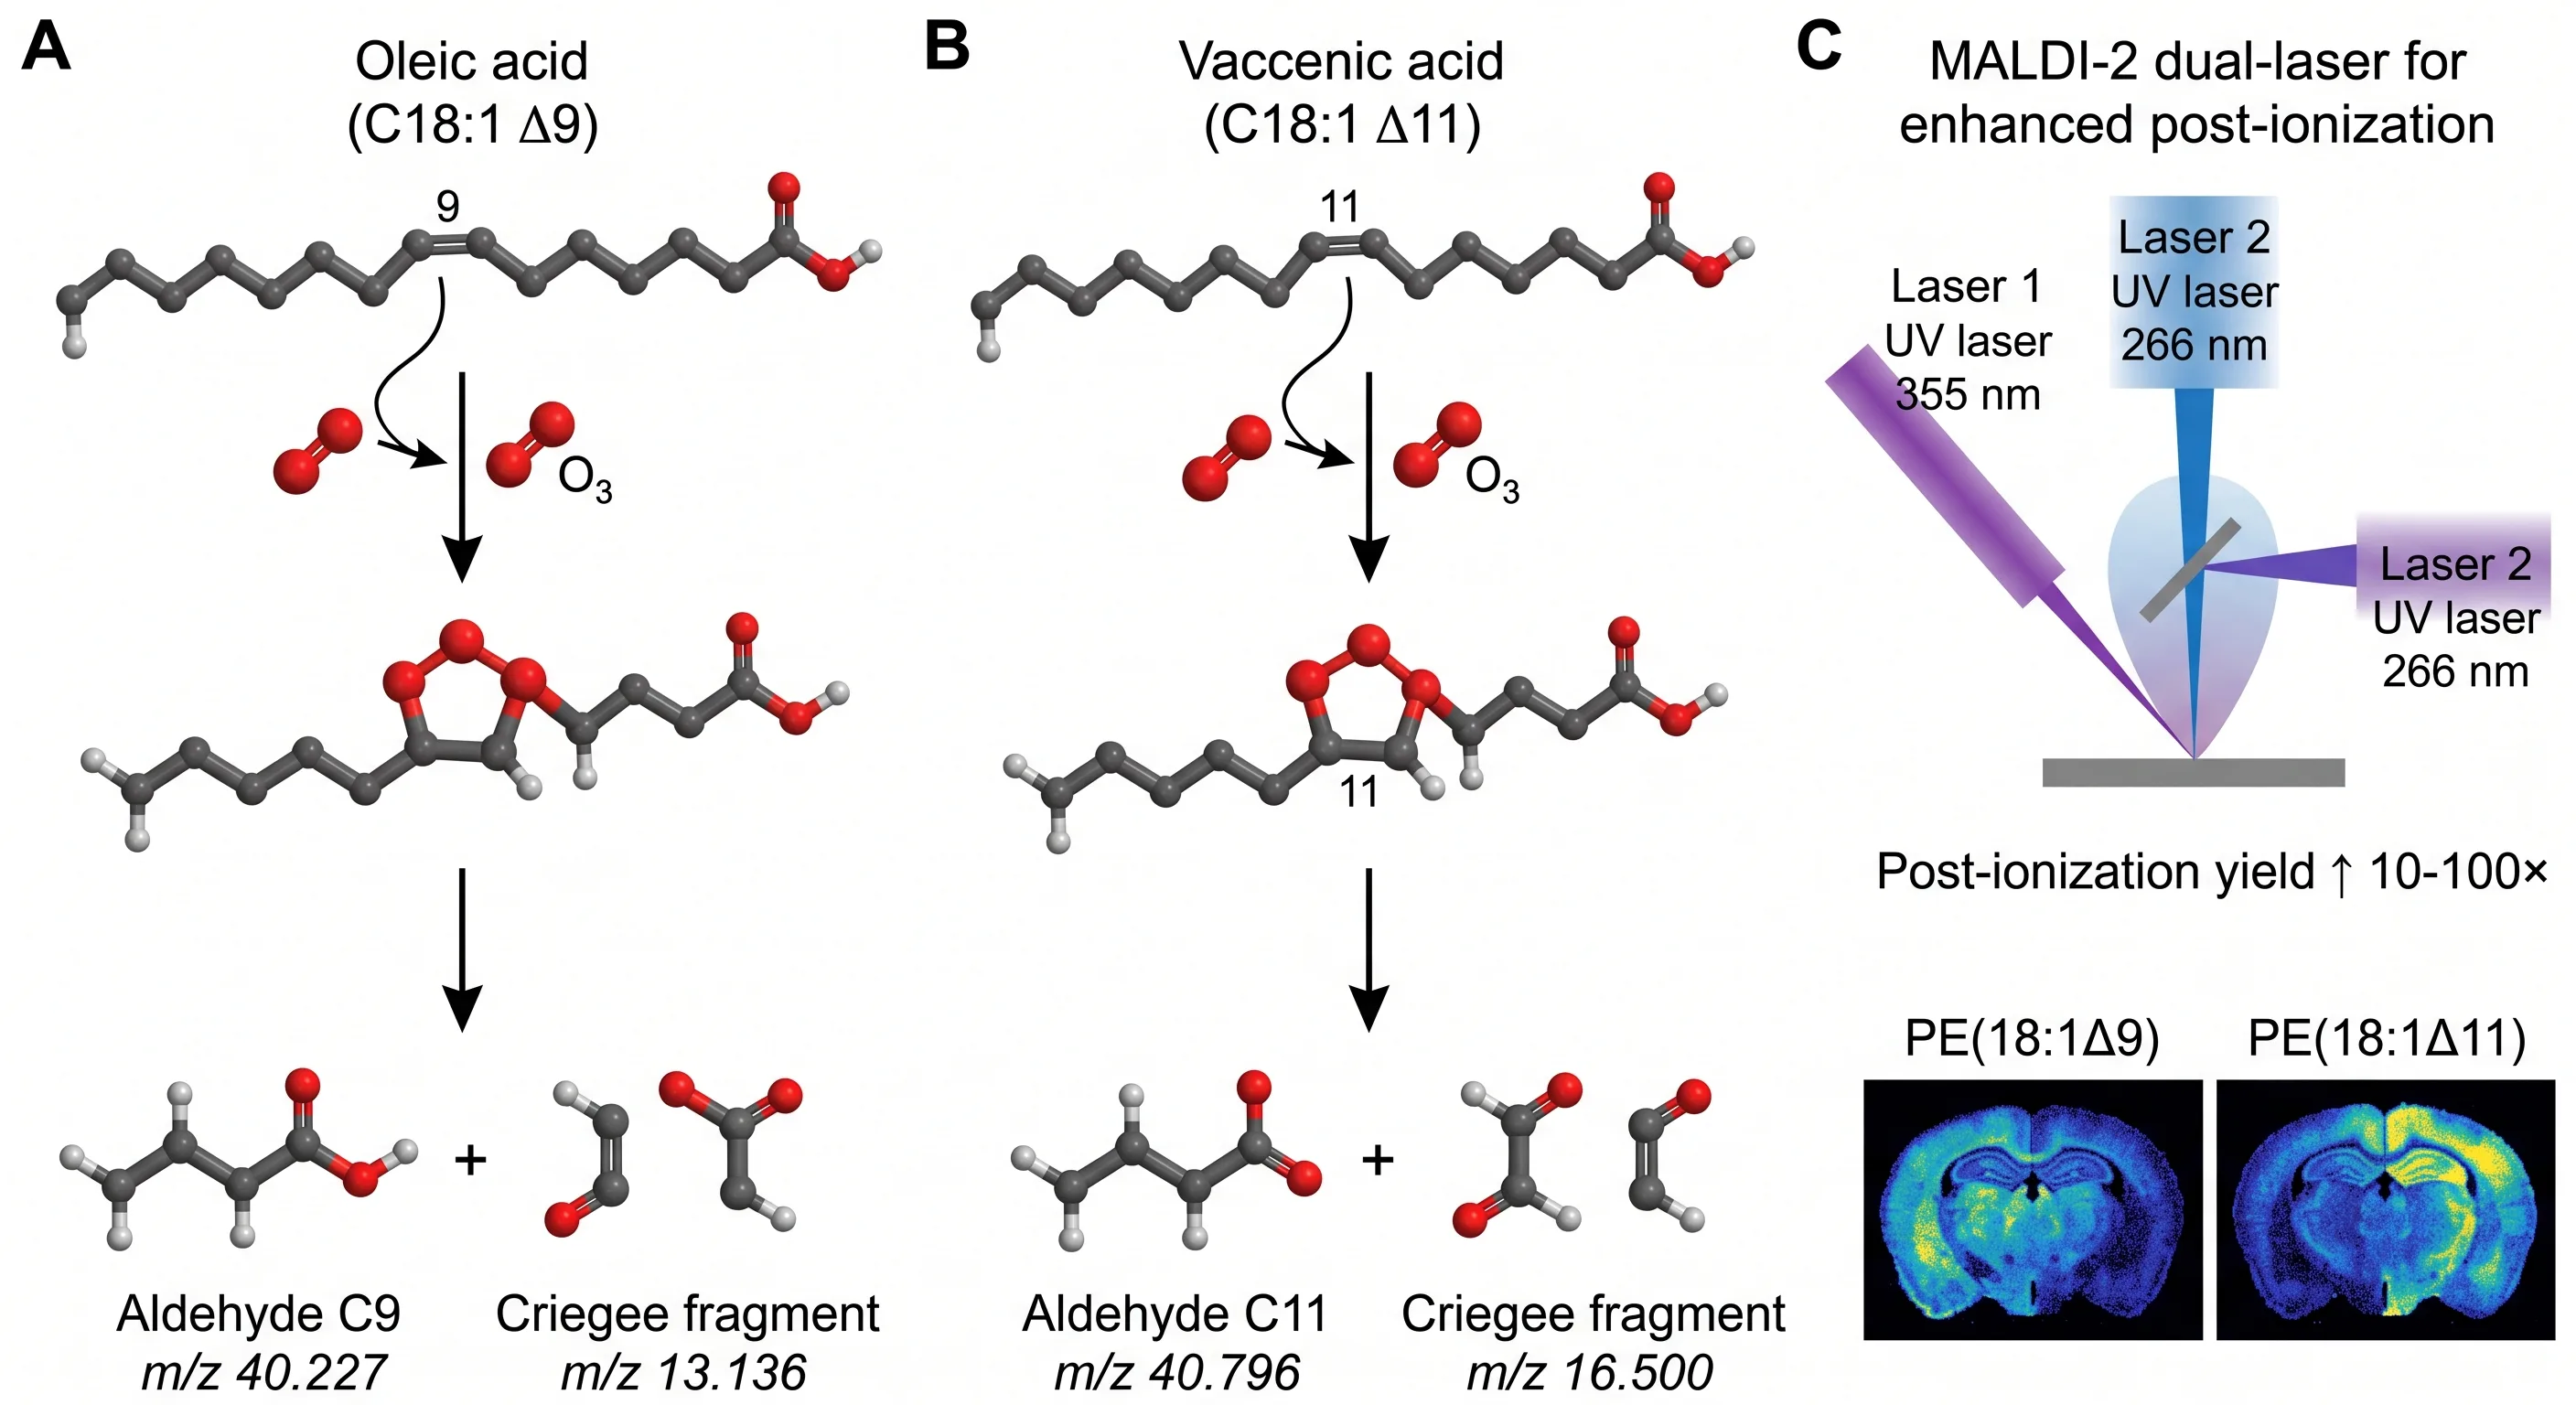 Figure 5: C=C positional isomer resolution concept — on-tissue ozonolysis chemistry, MALDI-2 post-ionization, and fragment-based double bond position determination for PE isomers.*
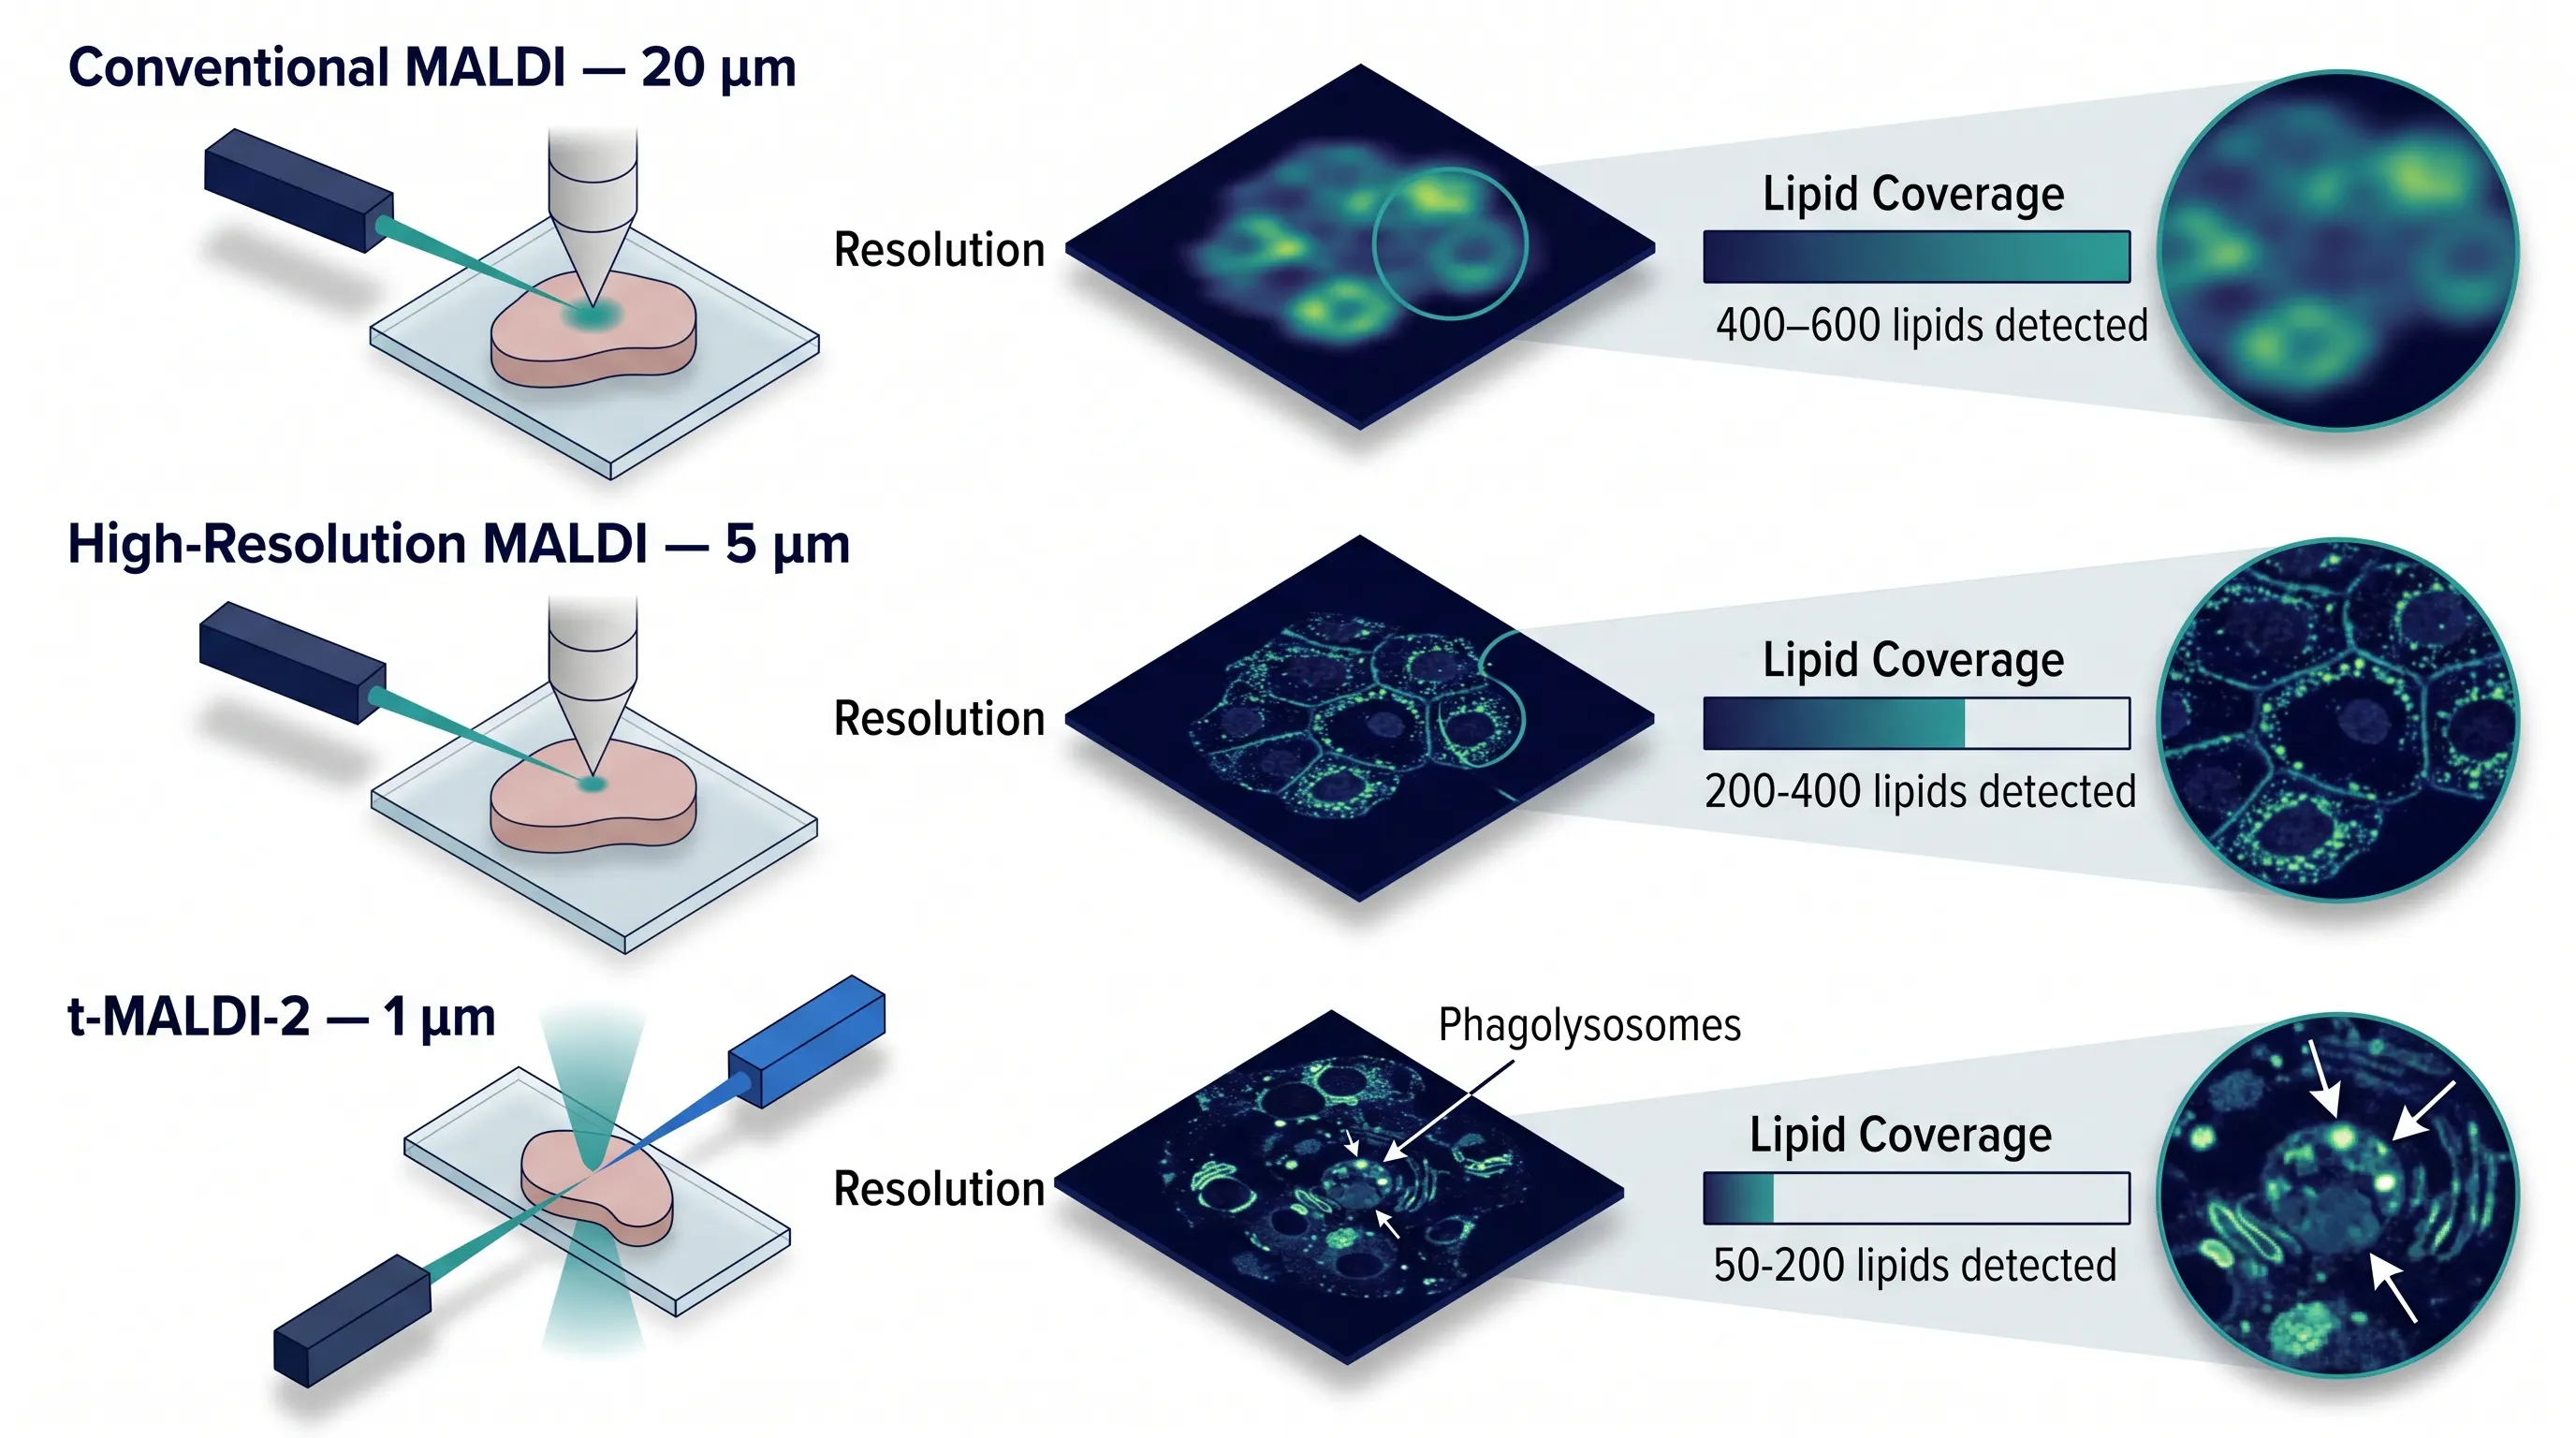 Figure 6: t-MALDI-2 subcellular lipid imaging — schematic comparing conventional MALDI (20 μm), high-res MALDI (5 μm), and t-MALDI-2 (1 μm) with representative ion images showing increasing spatial detail at the cost of lipid coverage.*
Lipid Isomer Resolution — The Frontier
Lipid isomer resolution represents the most rapidly advancing — and most challenging — frontier in spatial lipidomics. Three isomer types are relevant, each requiring distinct analytical strategies.
C=C Double Bond Positional Isomers
Mono- and polyunsaturated fatty acyl chains differ not only in the number of double bonds but in their positions along the carbon chain. Oleic acid (C18:1 Δ9) and vaccenic acid (C18:1 Δ11) are biologically distinct — oleic acid is pro-inflammatory in certain contexts while vaccenic acid is associated with anti-inflammatory effects — but they share identical accurate mass and produce nearly identical MS/MS spectra. Resolution strategies include:
- On-tissue ozonolysis: Ozone selectively cleaves C=C bonds; the resulting aldehyde and Criegee fragments reveal the original double bond position. Combined with MALDI-2 (Bezdeková et al., 2026), this enables imaging of C=C positional isomers directly on tissue.
- Paternò-Büchi (PB) photochemistry: UV irradiation in the presence of a PB reagent (e.g., benzophenone derivatives) forms an oxetane ring across the C=C bond; MS/MS fragmentation reveals the original double bond location.
- mCPBA epoxidation: meta-Chloroperoxybenzoic acid converts C=C bonds to epoxides; subsequent MS/MS identifies the epoxide position, and thereby the original double bond.
sn-Positional Isomers
PC(16:0/18:1) and PC(18:1/16:0) differ only in which fatty acyl chain occupies the sn-1 vs. sn-2 position on the glycerol backbone. Under standard collision-induced dissociation (CID), these isomers produce identical head group and fatty acyl fragment spectra. Relative fragment ion abundance in negative-ion MS/MS — the sn-2 carboxylate fragment is typically more abundant than the sn-1 fragment — can suggest positional assignment but is not definitive. Ion mobility spectrometry (IMS) can partially resolve sn-positional isomers based on subtle collision cross-section differences, and specialized fragmentation methods (UVPD, electron-induced dissociation) provide more reliable discrimination.
Chain Branching and Cyclopropane Lipids
Bacterial membranes contain branched-chain fatty acids (iso, anteiso) and cyclopropane-containing lipids absent from mammalian tissues. These require high-resolution MS/MS for structural characterization and specialized databases (e.g., LipidBank, specific microbial lipid libraries) for annotation. Cyclopropane lipids are particularly challenging because the cyclopropane ring does not produce characteristic MS/MS fragments under standard CID conditions.
Isomer-resolved lipid imaging is not yet routine, but the tools exist and are being integrated into commercial platforms. Within 3–5 years, C=C positional isomer imaging may become a standard capability of advanced MALDI-MSI workflows.
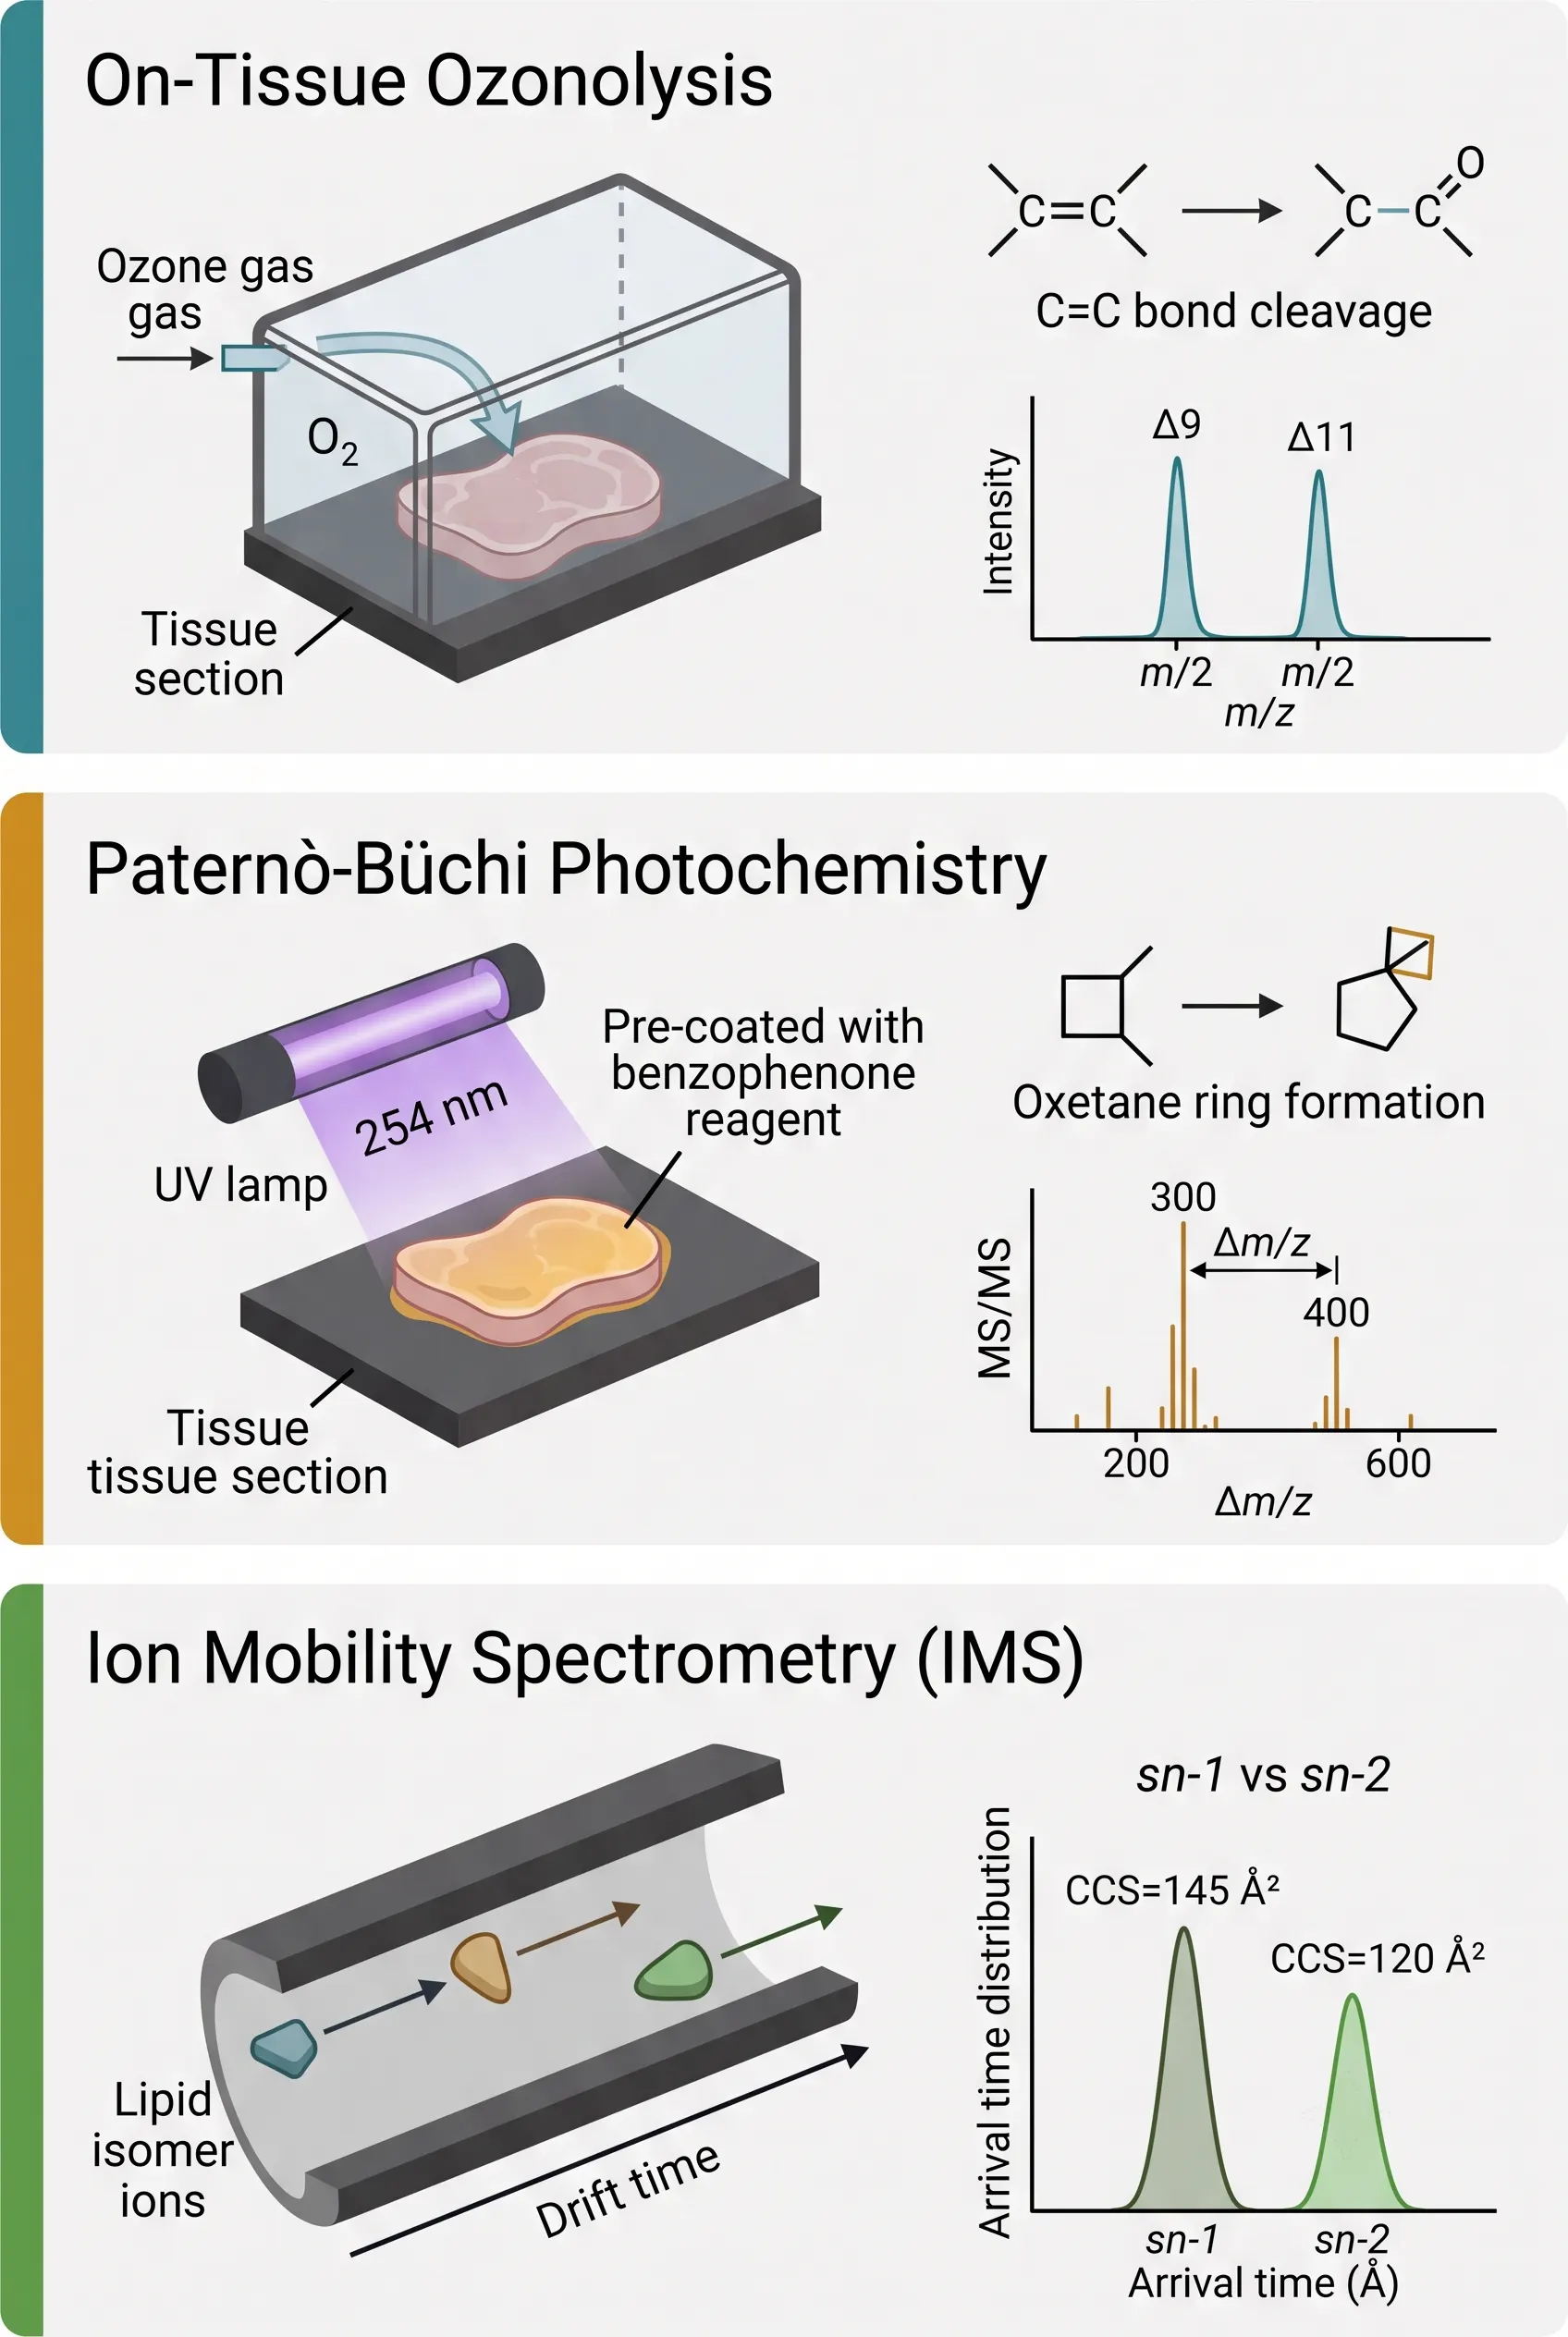 Figure 7: Isomer resolution strategies — three-panel comparison showing on-tissue ozonolysis (top), Paternò-Büchi photochemistry (middle), and ion mobility CCS separation (bottom), each with representative data showing isomer discrimination.*
Key Lipidomics Applications with MALDI
Tumor Lipid Microenvironment
MALDI-MSI reveals that tumors are not lipid-uniform — the core, invasive margin, and stromal interface each carry distinct lipid signatures. Saturated PC species concentrate at the proliferative front, while polyunsaturated PE species and oxidized phospholipids mark necrotic cores. PS externalization at the tumor-immune interface, detectable by MALDI imaging lipidomics, correlates with immunosuppressive macrophage infiltration patterns. These lipid-defined metabolic domains serve as chemical biomarkers complementary to immunohistochemistry.
Myelin Lipid Mapping in Neurodegenerative Disease
Brain white matter is defined by its lipid composition — sulfatides (e.g., ST 24:1) and galactosylceramides are myelin-specific markers, while gray matter regions show enrichment of PS 40:6 and gangliosides. In multiple sclerosis and leukodystrophy models, MALDI-MSI maps demyelination as sulfatide depletion with spatial precision matching Luxol fast blue histology — but with the added dimension of identifying which specific sulfatide species are lost and whether adjacent normal-appearing white matter shows early lipid abnormalities invisible to histological stains.
Hepatic Lipid Zonation and Steatosis
The liver exhibits metabolic zonation: periportal hepatocytes favor β-oxidation while pericentral hepatocytes favor lipogenesis. MALDI-MSI resolves these zonation patterns as gradients of specific TAG, PC, and PE species across the liver lobule. In non-alcoholic fatty liver disease (NAFLD) models, spatial lipidomics distinguishes pathological steatosis (macrovesicular, pericentral TAG accumulation) from physiological zonation, and can map the spatial progression from simple steatosis to steatohepatitis based on the appearance of oxidized phospholipid species and ceramide enrichment.
Single-Cell Lipid Heterogeneity in Immune Cells
At the cutting edge, t-MALDI-2 at 1 μm resolution pushes lipid imaging toward single-cell analysis. Neutrophils and macrophages carry distinct lipid fingerprints — neutrophils enriched in ether-linked PC species, activated macrophages showing characteristic ceramide and arachidonic acid-containing phospholipid signatures. Spatial mapping of these lipid-defined immune cell populations within tissue contexts complements flow cytometry and spatial transcriptomics by adding a direct chemical readout of cell state.
These application vignettes illustrate MALDI-MSI's versatility across tissue types and biological questions — from tumor metabolism to single-cell immunology. For researchers requiring quantitative rather than relative lipid abundance data, see our article on quantitative spatial lipidomics. For nanoscale lipid mapping at organelle resolution, see our article on SIMS imaging for high-resolution spatial lipidomics.
Troubleshooting Lipid MALDI-MSI
Delocalization of Mobile Lipids
PC and SM, with their permanent positive charge, are particularly mobile — they can delocalize during wet matrix application (pneumatic spraying), blurring spatial features. Sublimation (dry matrix deposition) eliminates solvent-driven delocalization but typically produces lower signal. Post-sublimation recrystallization — exposing the matrix-coated slide to solvent vapor in a sealed chamber for 30–60 seconds — improves sensitivity while largely preserving spatial fidelity. For lipid imaging where spatial accuracy is paramount (e.g., determining whether a lipid species is enriched at a 10 μm tissue boundary), sublimation with recrystallization is the recommended approach.
K⁺ and Na⁺ Adduct Splitting
Tissue sodium and potassium concentrations vary regionally and between samples, producing variable [M+Na]⁺/[M+K]⁺ ratios that split the ion current of each lipid species across multiple peaks. In high-sodium tissues (e.g., kidney medulla), [M+Na]⁺ may dominate [M+H]⁺ entirely. This adduct heterogeneity is a major confound in comparative studies because the apparent abundance of a lipid species depends on the local cation environment, not just its true concentration. Strategies include: doping the matrix with ammonium salts to shift adduct distribution toward [M+NH₄]⁺, reporting summed intensities across all detected adducts for each lipid species, and using targeted lipidomics with SIL internal standards where absolute quantification is required.
PC Suppression of Other Phospholipid Classes
PC's permanent positive charge makes it a dominant ion in positive-mode spectra — but this is an active ion suppression effect, not merely a reflection of abundance. PE signal in positive mode is suppressed to 5–15% of its unsuppressed value by PC competition for charge carriers. The solution is unambiguous: PE, PS, PI, PG, and PA must be analyzed in negative ion mode using 9-AA or DAN as the matrix. Attempting comprehensive phospholipid coverage from positive-mode data alone will systematically underestimate anionic phospholipid abundance.
Lipid Oxidation During Storage and Analysis
Polyunsaturated fatty acyl chains oxidize during tissue storage and analysis. Within 30 minutes of warm ischemia at room temperature, phospholipase A₂ activity and atmospheric oxygen measurably alter the lipid profile. Mitigation: minimize warm ischemia time (<30 minutes excision to freezing), snap-freeze in LN₂-cooled isopentane (not direct LN₂, which creates an insulating Leidenfrost gas layer), and store sections at −80°C under nitrogen or vacuum. Lipid oxidation during MALDI analysis itself is minimal due to the anaerobic vacuum environment, but storage oxidation accumulates over weeks and cannot be corrected post hoc.
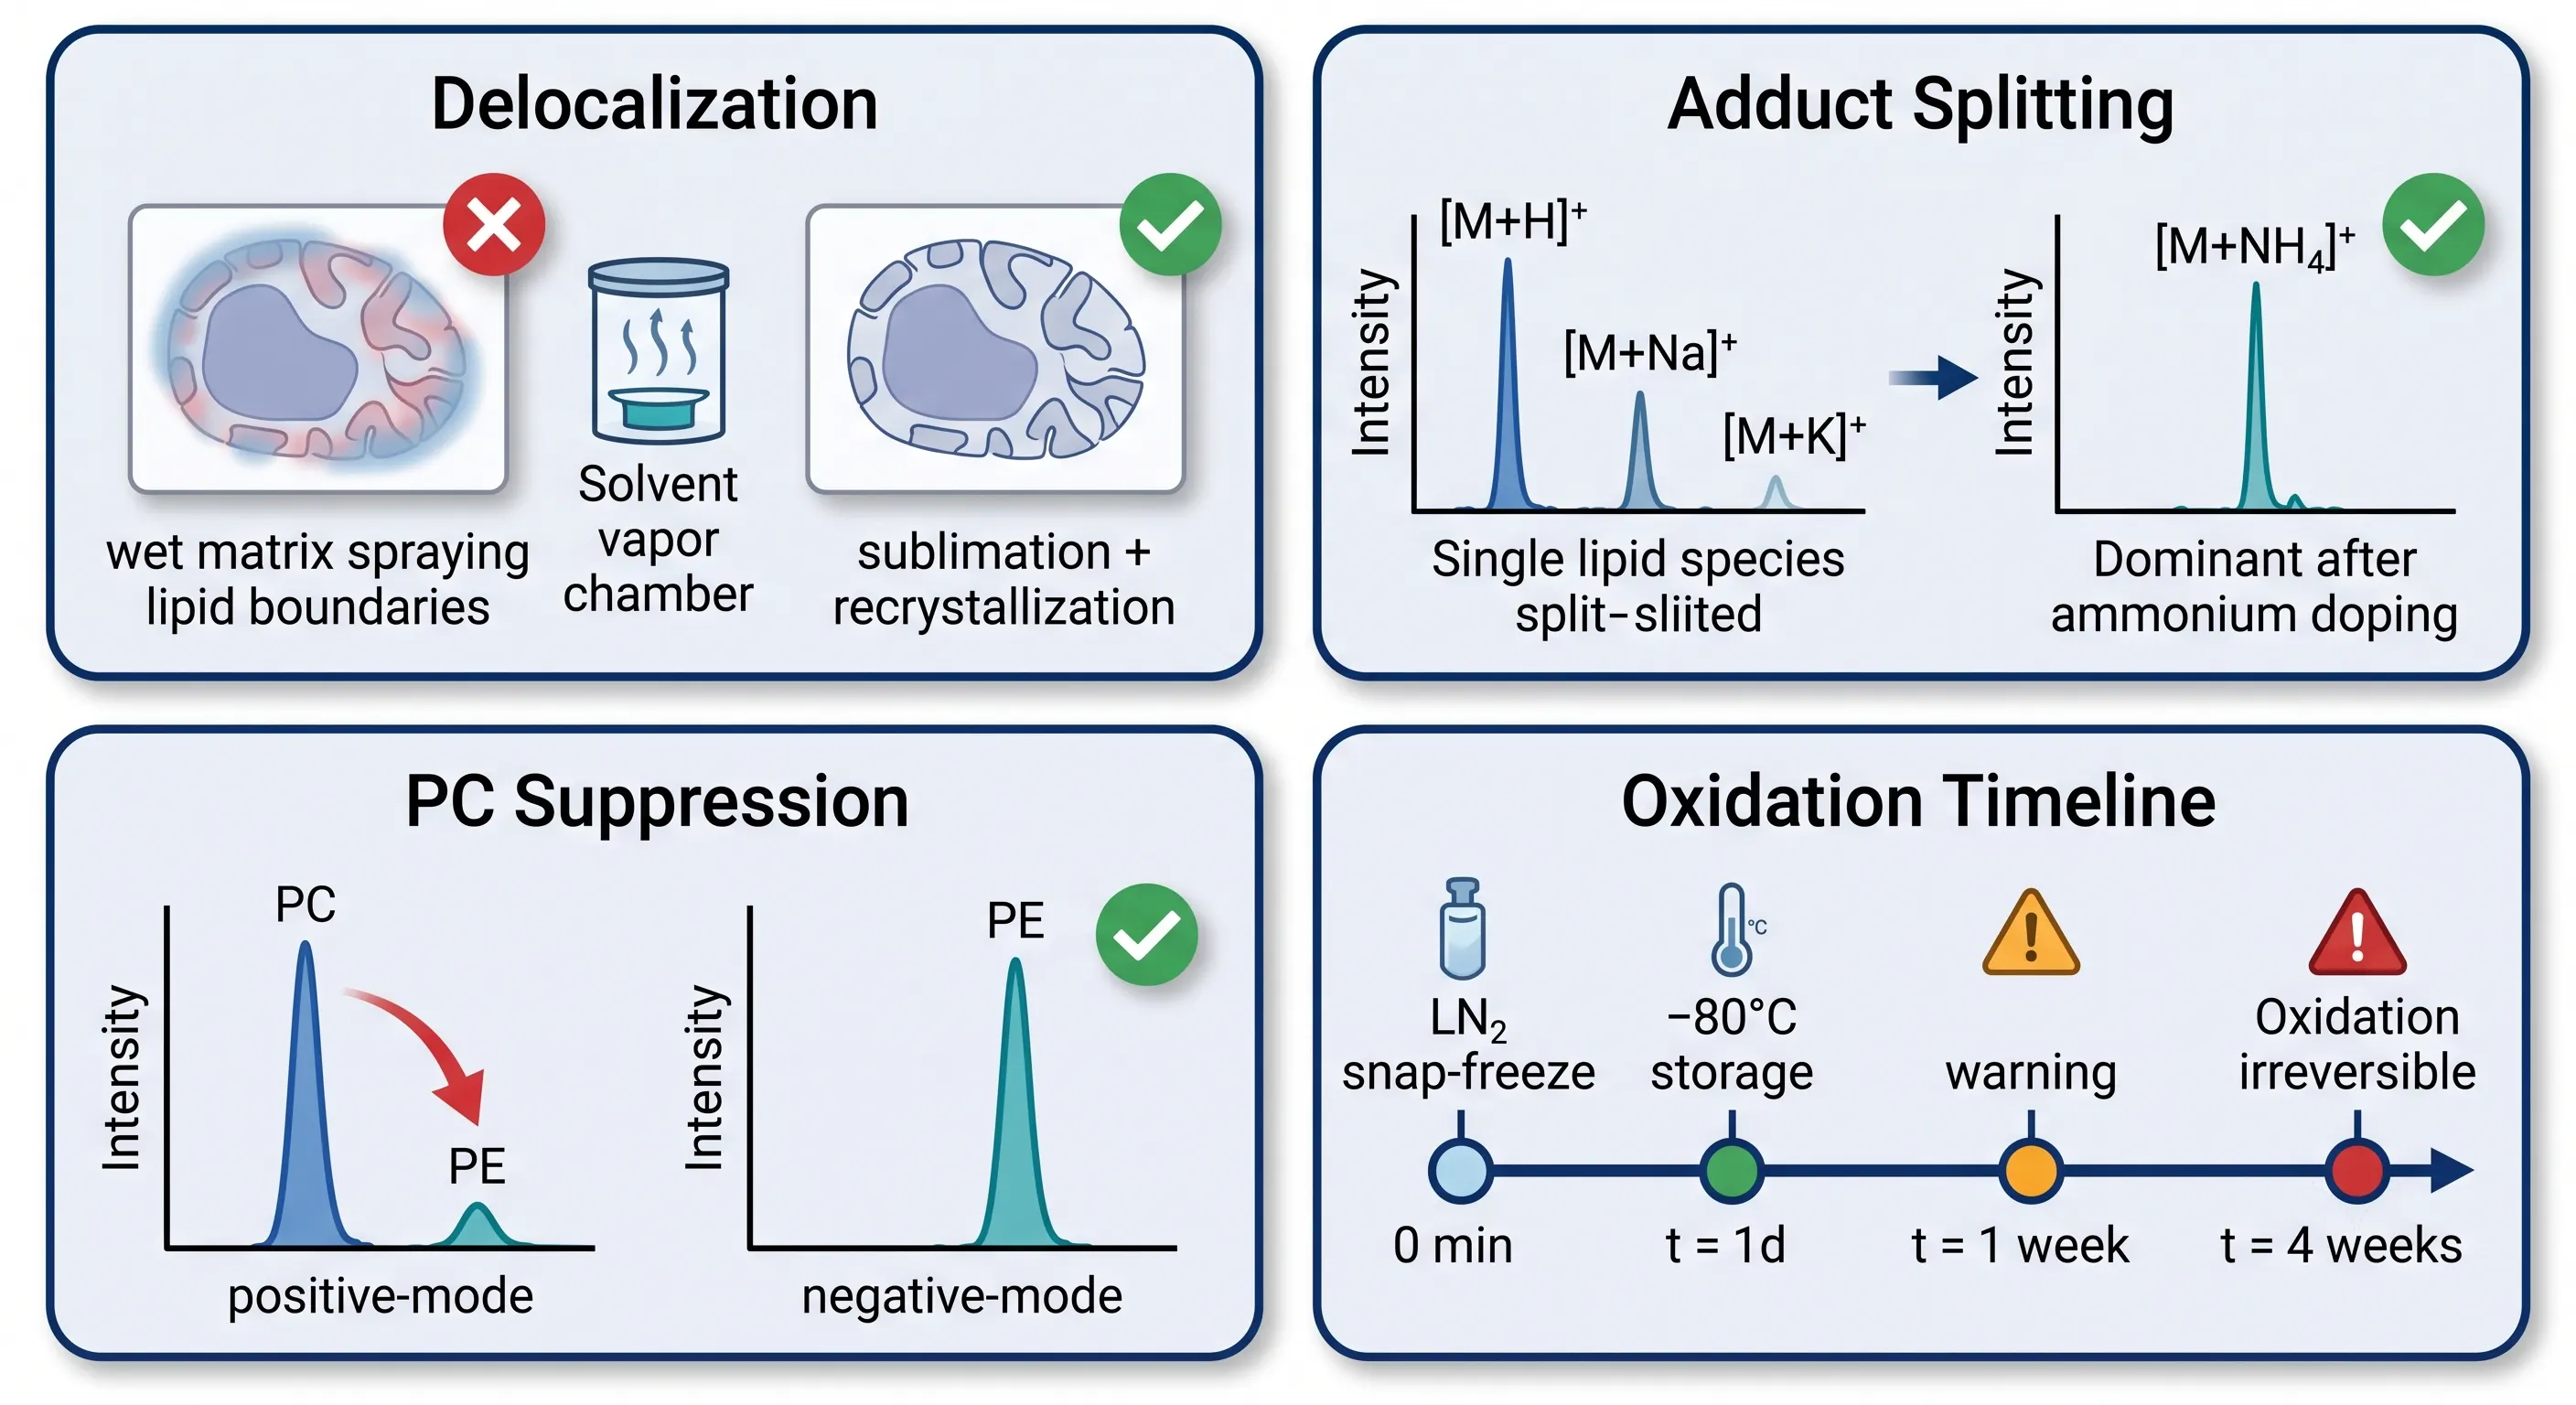 Figure 8: Troubleshooting guide — four-panel illustration showing lipid delocalization mechanisms (wet vs. dry matrix), adduct splitting patterns, PC→PE suppression in positive mode, and oxidation timeline during tissue storage.*
FAQ
Q: Q: Which matrix should I start with for general lipid MALDI-MSI?
DHB for positive-ion mode on fresh-frozen tissue at 20 μm resolution. It provides the broadest glycerophospholipid and sphingolipid coverage with the most extensive literature support. Add 9-AA on an adjacent section for negative-ion PE/PS/PI coverage.
Q: Q: Can I get both positive and negative ion data from the same tissue section?
Yes, with a dual-polarity matrix. NEDC and DMACA (aminated cinnamic acid) enable sequential positive- and negative-ion acquisition from a single matrix deposition at 5 μm resolution, eliminating the need for separate sections.
Q: Q: How many lipids can I identify at high confidence (Level 2–3) from a MALDI-MSI experiment?
A standard 20 μm MALDI-MSI experiment on mouse brain with DHB typically detects 200–500 features in positive mode, of which 50–150 achieve Level 2–3 identification with on-tissue MS/MS and METASPACE spatial FDR filtering.
Q: Q: Can MALDI-MSI distinguish lipid isomers with the same mass?
C=C positional isomers require specialized approaches — on-tissue ozonolysis + MALDI-2 (Bezdeková 2026) or Paternò-Büchi photochemistry. sn-Positional isomers are partially resolvable by ion mobility or specialized fragmentation. Standard MALDI without these tools cannot distinguish lipid isomers.
Q: Q: What is the biggest practical mistake in MALDI lipid imaging?
Acquiring only positive-ion data and assuming it represents the full lipid profile. PC dominates positive-mode spectra and actively suppresses PE, PS, and PI signals. Comprehensive lipid coverage requires both polarities — or a dual-polarity matrix.
Q: Q: How do I validate my lipid identifications from MALDI-MSI data?
Three-tier strategy: (1) accurate mass matching to LIPID MAPS (±3 ppm), (2) on-tissue MS/MS with characteristic head group fragment confirmation, and (3) METASPACE annotation with spatial coherence filtering and FDR control. LC-MS/MS of tissue extracts from adjacent sections provides orthogonal validation and is the gold standard for verification.
References:
- Uchino M, Imamura Y, Saito Y, Tsugawa H, Arita M. SMASH imaging: Serial MALDI acquisition strategy for high-resolution dual-polarity MS² spatial lipidomics. Anal Chem. 2026;98(12):4521-4530. doi:10.1021/acs.analchem.6c00123
- Porto F, Denti V, Bindi G, et al. Exploring 6-aza-2-thiothymine as a MALDI-MSI matrix for spatial lipidomics of formalin-fixed paraffin-embedded clinical samples. Metabolites. 2025;15(8):539. doi:10.3390/metabo15080539
- Dufresne M, Patterson NH, Lauzon N, Chaurand P. Aminated cinnamic acid analogs as dual polarity matrices for high spatial resolution MALDI imaging mass spectrometry. Anal Chim Acta. 2025;1342:343654. doi:10.1016/j.aca.2025.343654
- Bezdeková D, Hendrych M, Schwenzfeier J, Soltwisch J, Dreisewerd K, Vlček P, Preisler J, Bednařík A. Ozonization for MALDI-2 MS imaging of carbon-carbon double bond positional isomers of phosphatidylethanolamines in biological tissues. Anal Chim Acta. 2026;1382:344814. doi:10.1016/j.aca.2025.344814
- Hormann FM, Heiles S. Quantitative MALDI-MSI workflow for lipids with a LC-MS-based quality control pipeline. ACS Meas Sci Au. Published online June 6, 2025. doi:10.1021/acsmeasuresciau.6c00083
- Liebisch G, Fahy E, Aoki J, et al. Update on LIPID MAPS classification, nomenclature, and shorthand notation for MS-derived lipid structures. J Lipid Res. 2020;61(12):1539-1555. doi:10.1194/jlr.S120001025
- Alexandrov T. Spatial metabolomics and imaging mass spectrometry in the age of artificial intelligence. Annu Rev Biomed Data Sci. 2020;3:275-298. doi:10.1146/annurev-biodatasci-011420-031537
- Chen Y, Angerer TB, Spraggins JM, Caprioli RM. Critical evaluation of sphingolipids detection by MALDI-MSI. J Am Soc Mass Spectrom. 2025;36(4):785-796. doi:10.1021/jasms.5c00012
- Javorek AL, Sarsby J, Race AM, et al. Staining tissues with Basic Blue 7: A new dual-polarity matrix for MALDI mass spectrometry imaging. Anal Chem. 2025;97(7):2828-2836. doi:10.1021/acs.analchem.4c05244
- Maimó-Barceló A, Martín-Saiz L, Fernández JA, et al. A comprehensive review of lipid imaging mass spectrometry: Sample preparation to clinical translation. Prog Lipid Res. 2025;97:101319. doi:10.1016/j.plipres.2025.101319
- Rappez L, Stadler M, Triana S, et al. SpaceM reveals metabolic states of single cells. Nat Methods. 2021;18:799-805. doi:10.1038/s41592-021-01198-0
- Ni Z, Wölk M, Jukes G, et al. Guiding the choice of informatics software and tools for lipidomics research applications. Nat Methods. 2023;20(2):193-204. doi:10.1038/s41592-022-01710-0
- Lu KH, Zhang H, Yagnik GB, Lim MJ, Rothschild KJ, Li W, Schneider AJ, Puglielli L, Li L. Deciphering the three-dimensional biomolecular distribution in the Alzheimer's disease brain: A multiomic approach integrating immunohistochemistry with MALDI MS imaging. Anal Chim Acta. 2025;1379:344721. doi:10.1016/j.aca.2025.344721
The services described are for research use only. Not for use in diagnostic or therapeutic procedures.
















