

* This App Note bridges a gap in the spatial lipidomics literature: no existing practical guide covers secondary ion mass spectrometry (SIMS) for lipid imaging at nanoscale resolution. It provides the first application-focused resource for researchers evaluating SIMS-based lipid mapping — covering instrument selection, fragment-level lipid interpretation, sample preparation, and correlative workflows across membrane biology, extracellular vesicle research, and organelle-level lipid analysis.
Why SIMS for Spatial Lipidomics?
Spatial lipidomics has been transformed by MALDI and DESI mass spectrometry imaging, which routinely map hundreds of intact lipid species across tissue sections at 10-100 μm resolution. But when the biological question demands subcellular resolution — the asymmetric distribution of phosphatidylserine across the plasma membrane, cholesterol enrichment in lipid rafts, or the lipid composition of individual extracellular vesicles — these platforms hit a fundamental physical limit: the laser spot size and matrix crystal dimensions constrain MALDI to ~5 μm at best, and DESI to ~50 μm. For researchers working at these resolution limits, MALDI imaging lipidomics provides intact lipid species identification across tissue sections — complementary to the nanoscale fragment maps that SIMS delivers.
Secondary ion mass spectrometry (SIMS) breaks through this resolution barrier. By rastering a focused primary ion beam (Ga+, Bi3+, or Arn+ clusters) across the sample surface, SIMS achieves spatial resolution down to 50-200 nm — roughly two orders of magnitude finer than the best MALDI systems. At this scale, lipid distributions can be mapped relative to individual organelles, membrane subdomains, and cell-cell contacts.
The trade-off is molecular information content. SIMS is a hard ionization technique: the primary ion beam fragments lipids extensively, meaning researchers work with diagnostic fragment ions rather than intact molecular species. A SIMS spectrum from a biological sample is dominated by fragment peaks — m/z 184 for the phosphocholine head group, m/z 369 for cholesterol [M-H2O+H]+, and characteristic fatty acyl fragments — rather than the intact [M+H]+ or [M-H]- ions typical of MALDI. Interpreting these fragment patterns to infer parent lipid identity and spatial distribution is the central skill of SIMS lipidomics.
This App Note provides a practical guide to SIMS-based spatial lipidomics: what lipid information SIMS can and cannot provide, how to select the right instrument configuration, how to prepare samples for nanoscale lipid preservation, and how to embed SIMS within a broader spatial lipidomics workflow that combines SIMS, MALDI, and LC-MS for resolution-matched, multi-scale lipid mapping.
SIMS Technology Primer for Lipid Analysis
How SIMS Generates Lipid Signals
In SIMS, a focused primary ion beam (5-30 keV) impacts the sample surface, ejecting secondary ions from the top 1-2 nm into a mass analyzer — typically a time-of-flight (ToF) tube in ToF-SIMS or an Orbitrap in 3D OrbiSIMS. The underlying mechanism is a collision cascade: the primary ion transfers energy through binary collisions, sputtering ~5-10 nm of the surface. For lipids, this is inherently destructive — deposited energy far exceeds covalent bond energies, so the detector receives fragment ions (head groups, acyl chains, neutral losses) rather than intact parent species.
This fragmentation is both the defining limitation and advantage of SIMS. Individual molecular species (PC 34:1 vs. PC 36:1) cannot be resolved from fragment data alone. But the fragment pattern encodes class-level spatial information at unmatched resolution: the m/z 184 phosphocholine map shows all PC and SM distribution at 200 nm precision — sampling lipid biology at a scale no other MSI platform approaches. For molecular species-level lipid identification that complements SIMS fragment data, untargeted lipidomics by LC-MS provides the deepest coverage, detecting 500-1500 intact lipid species that can be correlated with SIMS fragment distributions.
Instrument Configurations: ToF-SIMS vs. 3D OrbiSIMS vs. GCIB-SIMS
Three instrument architectures dominate modern SIMS lipid imaging, differing in mass resolution, spatial resolution, and the degree of fragmentation:
| Feature | ToF-SIMS | 3D OrbiSIMS | GCIB-SIMS |
|---|---|---|---|
| Mass analyzer | Time-of-Flight | ToF + Orbitrap | ToF (with GCIB source: (H2O)n+ or (CO2)n+) |
| Mass resolution | ~10,000 (m/Δm) | ~240,000 (Orbitrap mode) | ~10,000 |
| Spatial resolution | 50-200 nm | 200 nm - 2 μm | 1-5 μm |
| Fragmentation degree | High (hard ionization) | High (same source) | Moderate (softer, larger clusters) |
| Intact lipid detection | Minimal (< m/z 1000) | Trace (Orbitrap sensitivity aids) | Partial (some intact [M+H]+/[M-H]-) |
| 3D depth profiling | Yes (dual-beam mode) | Yes (integrated) | Yes (low-damage sputtering) |
| Best use case | Subcellular fragment mapping | Fragment ID with high mass accuracy | Intact-ish lipid imaging with depth |
ToF-SIMS remains the workhorse for subcellular lipid mapping. The LMIG source using Bi3+ or Au3+ cluster ions delivers the best spatial resolution (50-100 nm), ideal for plasma membrane domain imaging. The ToF analyzer's moderate mass resolution (~10,000) means isobaric fragment ions can overlap — e.g., the phosphocholine head group (C5H15PNO+, exact mass 184.0733) and a hydrocarbon fragment at the same nominal m/z.
3D OrbiSIMS (Passarelli et al., 2017) solves the mass resolution problem by coupling the SIMS source to an Orbitrap analyzer. At ~240,000 mass resolution, it cleanly resolves isobaric fragment ions for confident head group assignment even in complex matrices. The trade-off: Orbitrap acquisition demands longer ion accumulation times, so practical pixel sizes are 1-2 μm rather than 50 nm. MS/MS capability adds fragment-of-fragment structural confirmation.
GCIB-SIMS (gas cluster ion beam SIMS) uses large gas clusters — typically (H2O)n+ or (CO2)n+ (n > 1000) — as the primary projectile. The cluster's kinetic energy distributes across thousands of molecules, so individual impact energy is very low — dramatically reducing fragmentation and enabling detection of intact lipid ions ([M+H]+ for PC, [M-H]- for PE/PS, even intact cholesterol) absent from conventional ToF-SIMS. The resolution cost is significant (1-5 μm), but GCIB-SIMS bridges SIMS and MALDI for applications prioritizing molecular identification over nanoscale precision. Tian et al. (2024) used (H2O)n-GCIB-SIMS at ≤3 μm resolution to map intact PC, PE, and TAG across liver lobules, classifying metabolic zones and cell types by lipid signature. For researchers studying individual phospholipid classes at tissue scale, glycerophospholipids analysis by LC-MS provides class-specific quantification that can anchor SIMS fragment-based spatial maps to absolute concentration scales.
Lipid Information Content from SIMS Fragments
Key Diagnostic Fragment Ions
Interpreting SIMS lipid data requires knowing which fragment ions report on which lipid classes. The following fragments are the most diagnostically valuable in biological SIMS imaging:
| Fragment Ion (m/z) | Exact Mass | Assignment | Parent Lipid(s) | Polarity |
|---|---|---|---|---|
| 86.10 | 86.0606 | C5H12N+ | PE head group fragment | Positive |
| 166.06 | 166.0628 | C5H13PNO3+ | PE head group fragment | Positive |
| 184.07 | 184.0733 | C5H15PNO+ | PC, SM (phosphocholine head group) | Positive |
| 224.10 | 224.1032 | C8H19PNO4+ | PS head group fragment | Positive |
| 369.35 | 369.3516 | C27H45+ | Cholesterol [M-H2O+H]+ | Positive |
| 385.35 | 385.3465 | C27H45O+ | Cholesterol [M+H-H2]+ / 7-DHC | Positive |
| 224.05 | - | Glycerophospholipid fragment | Multiple phospholipid classes | Negative |
| 255.23 | - | C16H31O2- | Palmitate (C16:0) fatty acyl chain | Negative |
| 281.25 | - | C18H33O2- | Oleate (C18:1) fatty acyl chain | Negative |
The m/z 184 ion is by far the most widely used SIMS lipid signal: it is intense, ubiquitous across all PC- and SM-containing membranes, and provides a robust marker for general membrane distribution. The cholesterol fragment at m/z 369 is comparably important — SIMS is arguably the best technique available for spatially mapping cholesterol distribution, since cholesterol ionizes poorly in MALDI without derivatization, and its small size and high abundance produce exceptionally bright SIMS signals. When cholesterol or other sterol distributions identified by SIMS require absolute quantification, targeted lipidomics using stable-isotope-labeled internal standards can validate and calibrate the SIMS fragment intensities.
From Fragments Back to Lipids: The Inference Problem
The central analytical challenge of SIMS lipidomics is inferring parent lipid identity from fragment patterns. A strong m/z 184 signal tells you that PC and/or SM is present — but not which molecular species (PC 34:1? PC 36:2? SM 34:1;O2?). Similarly, a negative-ion fatty acyl fragment at m/z 281.25 indicates oleate-containing lipids, but could originate from PC, PE, PS, PI, or TAG — and provides no information about the other fatty acyl chain.
Several strategies partially address this limitation:
Co-localization analysis. If m/z 184 (phosphocholine) and m/z 255.23 (palmitate) show identical spatial distributions at the single-cell level, the palmitate signal likely originates from PC species rather than TAG. Pixel-wise correlation matrices across fragment ions can infer class-specific fatty acyl composition, as demonstrated by Skalska et al. (2026) for EV sphingolipid mapping.
OrbiSIMS MS/MS. The Orbitrap analyzer enables fragment-of-fragment analysis: isolating the m/z 184 ion and fragmenting it further yields the phosphocholine-specific C5H15PNO+ pattern, confirming lipid class assignment with high confidence. This is particularly valuable in tissues where isobaric fragment ions from proteins or matrix material may overlap with lipid fragments.
Correlative MALDI-SIMS. Running SIMS and MALDI on the same or adjacent tissue sections combines SIMS spatial precision with MALDI molecular coverage. The MALDI dataset identifies which lipid species are present in the tissue region; the SIMS fragment maps then reveal their subcellular distribution at resolution MALDI cannot achieve. This correlative approach is increasingly adopted in multi-modal spatial lipidomics studies and represents the most practical path to molecularly informed, subcellularly resolved lipid maps.
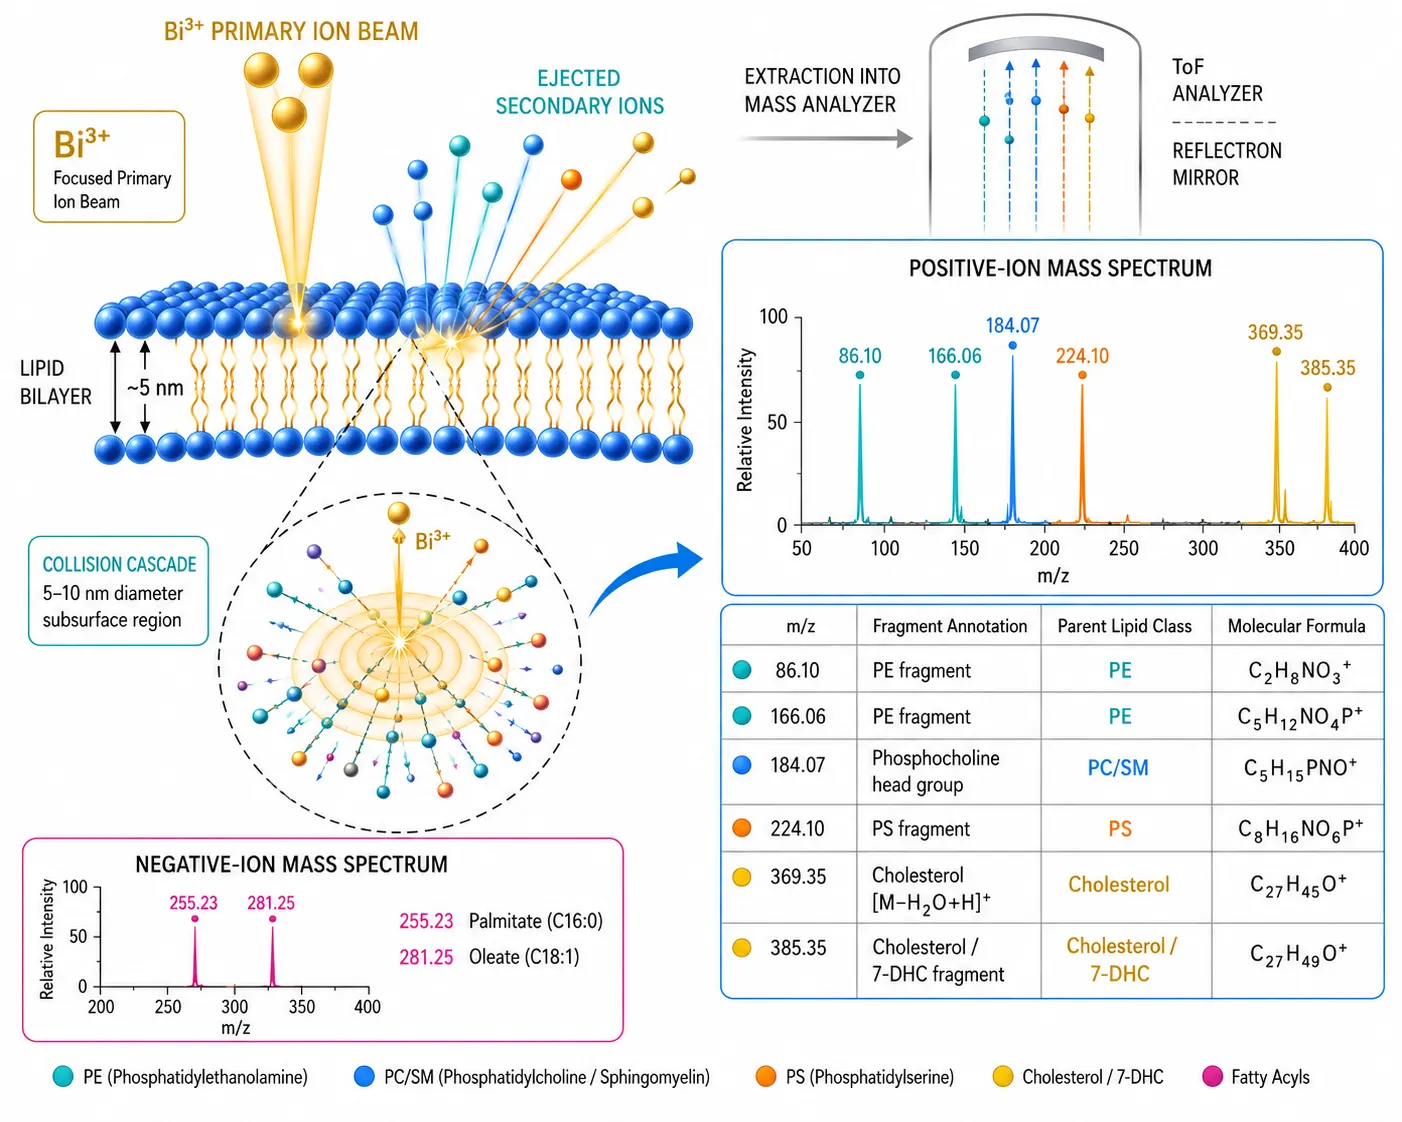 Figure 1: SIMS ionization and fragment generation — schematic of primary ion beam impact, collision cascade, and key diagnostic lipid fragment ions with their parent lipid class assignments.*
Sample Preparation for Nanoscale Lipid Imaging
Substrate Requirements
SIMS sample preparation must satisfy requirements stricter than those for MALDI or DESI. Because SIMS probes only the top 1-2 nm of the sample surface and the signal is exquisitely sensitive to surface topography, substrates must be atomically flat, conductive, and free of organic contaminants:
- Silicon wafers are the standard substrate — they are atomically flat (surface roughness<1 nm), conductive when doped, and available in cleanroom-grade purity. Standard glass slides are unsuitable: their surface roughness (tens of nm) creates topographic artifacts, and their insulating properties cause charge accumulation that distorts the secondary ion extraction field.
- ITO-coated glass (indium tin oxide) is an acceptable alternative for correlative workflows where optical microscopy on the same substrate is required. The conductive ITO layer prevents charging, but surface roughness is higher than silicon.
- Metal-coated substrates (gold-coated silicon, stainless steel plates) are occasionally used but require pre-cleaning to remove organic residues that produce background signals in the lipid m/z range.
Tissue Section Preparation for SIMS
For tissue imaging, sections must be thinner than those used for MALDI — typically 5-10 μm rather than 10-20 μm — to ensure the sample surface is within the focal plane of the secondary ion extraction optics across the entire field of view. By contrast, MALDI imaging lipidomics requires matrix application and thicker (10-20 μm) sections, but delivers broader intact lipid coverage — making the two techniques complementary rather than competing for the same sample types. Standard cryostat sectioning onto silicon wafers (rather than glass slides) is the most common workflow. Key considerations:
- Thaw-mounting onto room-temperature silicon wafers can cause lipid delocalization at the nanoscale. Cryo-transfer (maintaining the section at low temperature during mounting) preserves native lipid distributions, though it requires specialized equipment.
- No embedding medium. OCT and similar embedding compounds contain polyethylene glycol and other polymers that produce intense, broad SIMS signals in the low-mass range, completely swamping lipid fragment ions. Tissue should be mounted directly onto the substrate without embedding medium.
- No matrix application. Unlike MALDI, SIMS requires no matrix — the primary ion beam directly sputters the sample. This eliminates matrix-related delocalization but also removes the sensitivity enhancement that matrices provide. The intrinsic signal from SIMS is therefore lower, and lipid coverage is restricted to the most abundant species capable of producing detectable fragment ions.
Single Cells and Extracellular Vesicles
SIMS is uniquely suited to single-particle and single-cell lipid analysis — objects that are physically smaller than a MALDI laser spot. Skalska et al. (2026) recently published the first study applying ToF-SIMS to analyze sphingolipid composition in extracellular vesicles and their parental β-cells under hyperglycemic conditions, demonstrating that EV lipid signatures (ceramides, hexosylceramides, glycosphingolipids) differed between large and small EV subpopulations and that glucose stress selectively regulated glycosphingolipid content — establishing ToF-SIMS as a viable tool for EV lipid phenotyping.
For single-cell SIMS, cells are typically cultured directly on silicon wafers, then fixed (chemical fixation or cryo-fixation) and either analyzed hydrated (cryo-SIMS) or dehydrated. Cryo-SIMS, in which the sample is maintained at liquid nitrogen temperature throughout analysis, preserves the native hydration state and lipid distribution — including membrane leaflet asymmetry — but requires specialized cold-stage instrumentation and is not yet widely accessible.
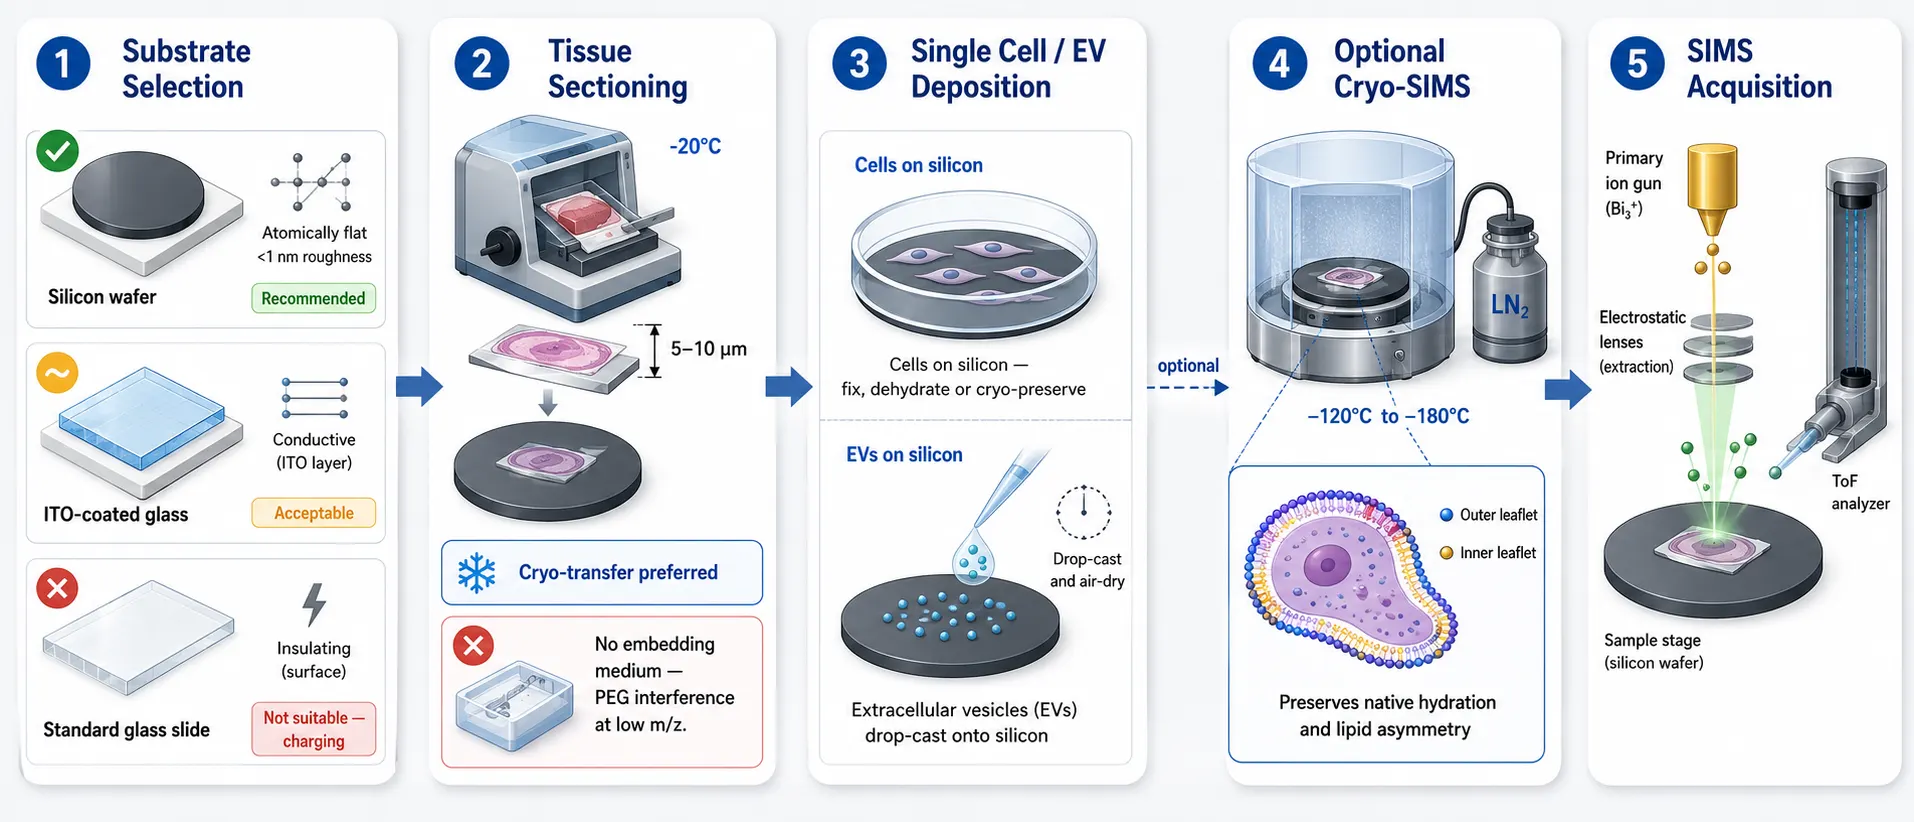 Figure 2: Sample preparation workflow for SIMS lipid imaging — from substrate selection through tissue sectioning, single-cell deposition, and cryo-preservation options for nanoscale lipid fidelity.*
Key Applications in Nanoscale Lipid Biology
Plasma Membrane Lipid Domains
The lipid raft hypothesis — that cholesterol- and sphingolipid-enriched microdomains compartmentalize membrane protein function — has been one of cell biology's most debated questions, in part because imaging these domains requires resolution below the diffraction limit of light microscopy (~250 nm). SIMS, with 50-100 nm spatial resolution, directly visualizes cholesterol-rich and sphingolipid-rich membrane regions without the need for fluorescent probes. For comprehensive sphingolipid profiling that complements SIMS spatial data, sphingolipid metabolism analysis by LC-MS/MS quantifies ceramides, sphingomyelins, hexosylceramides, and gangliosides with molecular species resolution. that may themselves perturb domain structure.
Early ToF-SIMS studies of supported lipid bilayers and native cell membranes demonstrated cholesterol enrichment in distinct sub-micron domains, with the m/z 369 cholesterol fragment map showing punctate distributions that correlated with raft protein markers. More recent 3D OrbiSIMS studies have extended this to measure the depth profile of cholesterol within the plasma membrane, revealing that cholesterol is concentrated in the outer leaflet — consistent with its preferential interaction with the sphingomyelin-rich outer leaflet.
Extracellular Vesicle Lipidomics
Extracellular vesicles (EVs) — including exosomes (30-150 nm) and microvesicles (100-1000 nm) — carry lipid, protein, and nucleic acid cargo reflective of their parent cell. Bulk lipidomics of isolated EV populations reports the average lipid composition across thousands to millions of vesicles, erasing heterogeneity that may be functionally significant. SIMS is one of the only techniques capable of analyzing individual EV lipid composition.
Skalska et al. (2026) showed that EVs deposited on silicon substrates produce class-specific sphingolipid fragment patterns by ToF-SIMS, with ceramide and hexosylceramide signals distinguishing EV subpopulations and reflecting the metabolic state of their parental β-cells. Glycosphingolipid levels in EVs were selectively modulated by hyperglycemia, demonstrating that EV lipid cargo carries biologically interpretable signatures of cellular stress.
This work opens the door to EV lipid profiling for biomarker applications — identifying metabolically stressed cell populations through their EV sphingolipid cargo. The Skalska review (2025) further argues that ToF-SIMS bridges bulk lipidomics and nano-lipidomic imaging for EV characterization. However, throughput remains a significant limitation; current SIMS instruments analyze EV populations rather than individual vesicles at scale, and the technique is far from the throughput of fluorescence-based EV characterization.
Lipid Droplet and Organelle Lipid Mapping
Lipid droplets (LDs) are dynamic organelles comprising a neutral lipid core (TAG and CE) surrounded by a phospholipid monolayer. Their size (0.1-10 μm) places the smallest LDs below the resolution of conventional MALDI but within reach of SIMS. ToF-SIMS imaging at 100-200 nm resolution can resolve individual LDs, with the TAG-derived fatty acyl fragments in negative mode and the phospholipid head group fragments (m/z 184) delineating the monolayer boundary.
Tian et al. (2024) used multimodal MSI including (H2O)n-GCIB-SIMS to map intact lipid distributions across liver lobules at ≤3 μm resolution, demonstrating that TAG species composition and abundance varied between periportal and pericentral hepatocyte populations — a zonation pattern invisible to bulk lipidomics. The softer GCIB ionization was critical for detecting intact TAG and phospholipid ions rather than only fragments, enabling molecular species-level mapping of neutral lipid stores and membrane lipids across metabolic zones.
Nanoparticle-Lipid Interactions and Drug Delivery
Lipid nanoparticles (LNPs) — the delivery vehicles behind mRNA vaccines and siRNA therapeutics — interact with cellular membranes through lipid mixing, fusion, and endocytic uptake. SIMS imaging can track the spatial distribution of LNP components (ionizable lipids, PEG-lipids, helper phospholipids) at the cell membrane interface, revealing whether LNPs fuse at the plasma membrane or are internalized intact. The nanoscale resolution of SIMS is essential here because individual LNPs are typically 50-100 nm — smaller than a MALDI pixel — and their membrane interaction zone is comparably sized.
Uzoni et al. (2025) applied (CO2)n-GCIB-SIMS to map intact lipid profiles across 14 DLBCL lymph node samples, demonstrating that lipid signatures at cellular resolution could distinguish healthy, cancerous, and hyper-aggressive tumor subtypes — establishing a spatial resolution benchmark for lipid-based disease classification directly relevant to LNP biodistribution mapping.
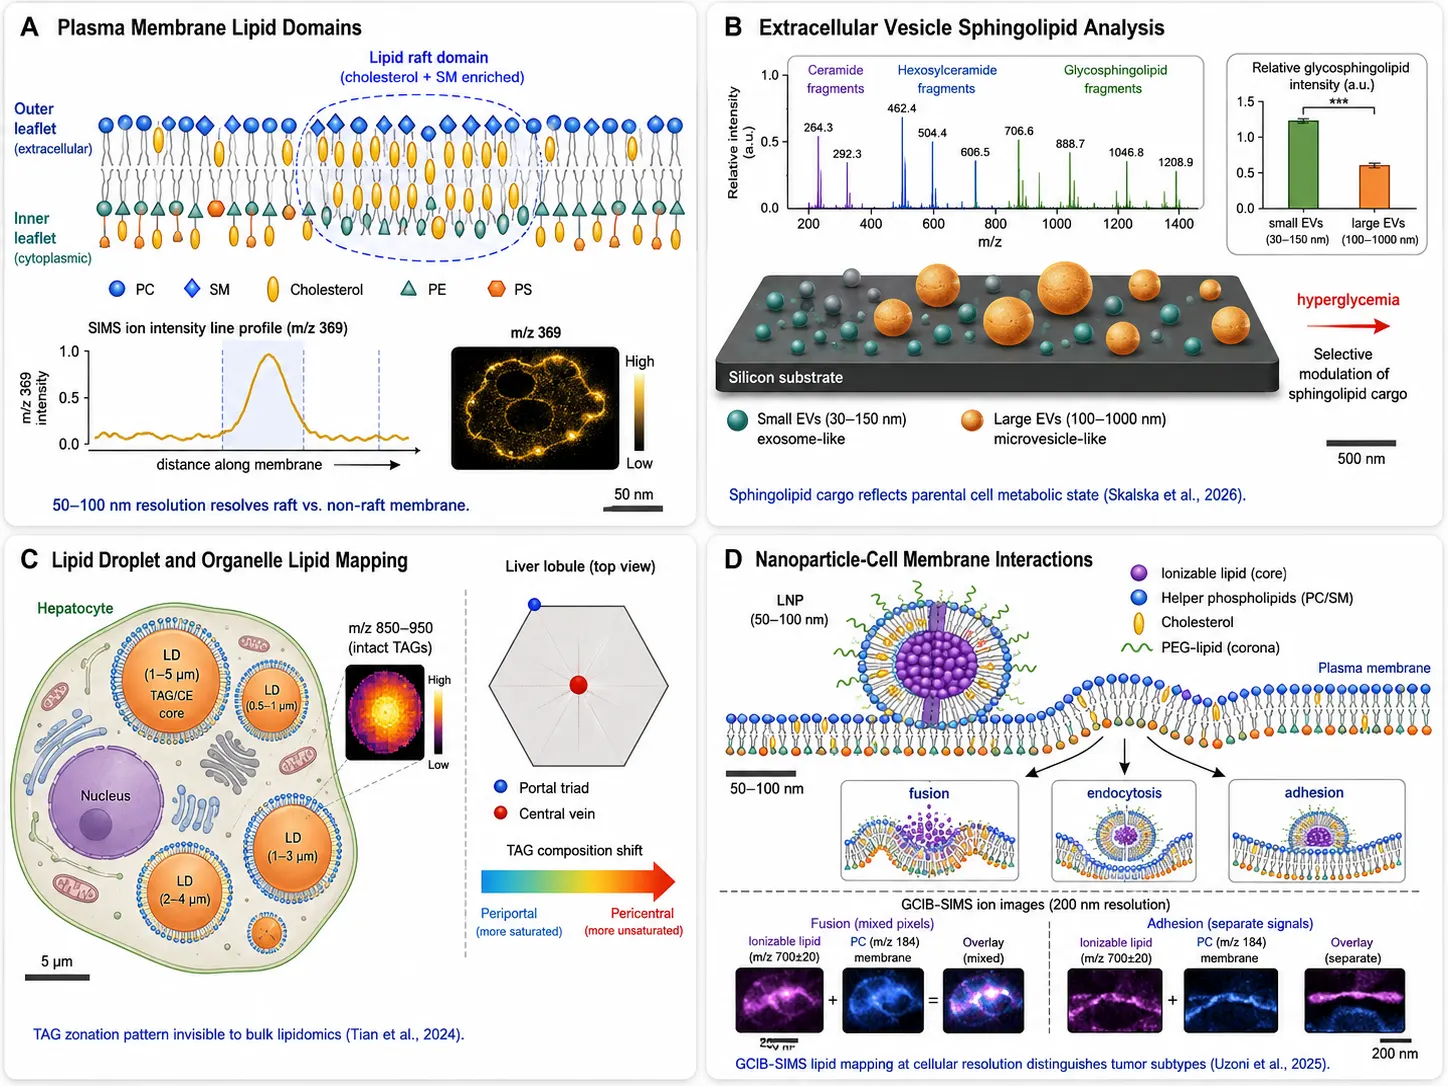 Figure 3: Key application domains for SIMS spatial lipidomics — plasma membrane domains, individual extracellular vesicles, intracellular lipid droplets, and nanoparticle-cell membrane interfaces.*
Multi-Modal Integration: SIMS in the Lipidomics Ecosystem
The Resolution-Coverage Trade-off Across Platforms
SIMS occupies one corner of a three-way trade-off in spatial lipidomics: resolution, molecular coverage, and throughput. No single platform optimizes all three, and the smartest experimental design uses each platform for what it does best:
| Platform | Spatial Resolution | Lipid Coverage | Throughput | Molecular Information |
|---|---|---|---|---|
| ToF-SIMS | 50-200 nm | 10-30 fragment ions | Minutes per field | Class-level (fragments) |
| GCIB-SIMS | 1-5 μm | 30-100 (intact + fragments) | Minutes per field | Partial species-level |
| MALDI (HR) | 5-10 μm | 100-300 intact lipids | 30-90 min per section | Species-level (Level 2-3) |
| MALDI (Standard) | 20-50 μm | 200-500 intact lipids | 15-30 min per section | Species-level (Level 2-3) |
| DESI | 50-200 μm | 100-300 intact lipids | 5-15 min per section | Sum composition (Level 3) |
| LC-MS (bulk) | No spatial info | 500-1500 intact lipids | 30-60 min per sample | Species-to-isomer (Level 1-2) |
Correlative SIMS-MALDI Workflows
The most powerful current approach combines SIMS and MALDI on the same tissue section in three steps:
Step 1 — SIMS first. SIMS probes only the top 1-2 nm and is non-destructive to the bulk section. Acquire fragment maps at 200 nm - 2 μm resolution over regions of interest.
Step 2 — MALDI second. Apply matrix by sublimation to the same section and acquire MALDI data at 10-20 μm. SIMS removes negligible material, so MALDI data quality is unaffected.
Step 3 — Co-registration. Computational alignment lets SIMS fragment maps be interpreted against MALDI-identified lipid species. If MALDI identifies PC 34:1, PC 36:2, and SM 34:1;O2 as the dominant phosphocholine species, the SIMS m/z 184 map represents their summed nanoscale distribution. This workflow has resolved cholesterol and PC domains at synaptic clefts and correlated them with sphingolipid distributions across hippocampal subfields — revealing lipid compartmentalization invisible to either technique alone. For studies that require combining lipid spatial data with protein-level information, integrated proteomics and lipidomics services provide multi-omics co-registration workflows that place SIMS lipid maps in the context of enzyme and transporter distributions from the same tissue regions.
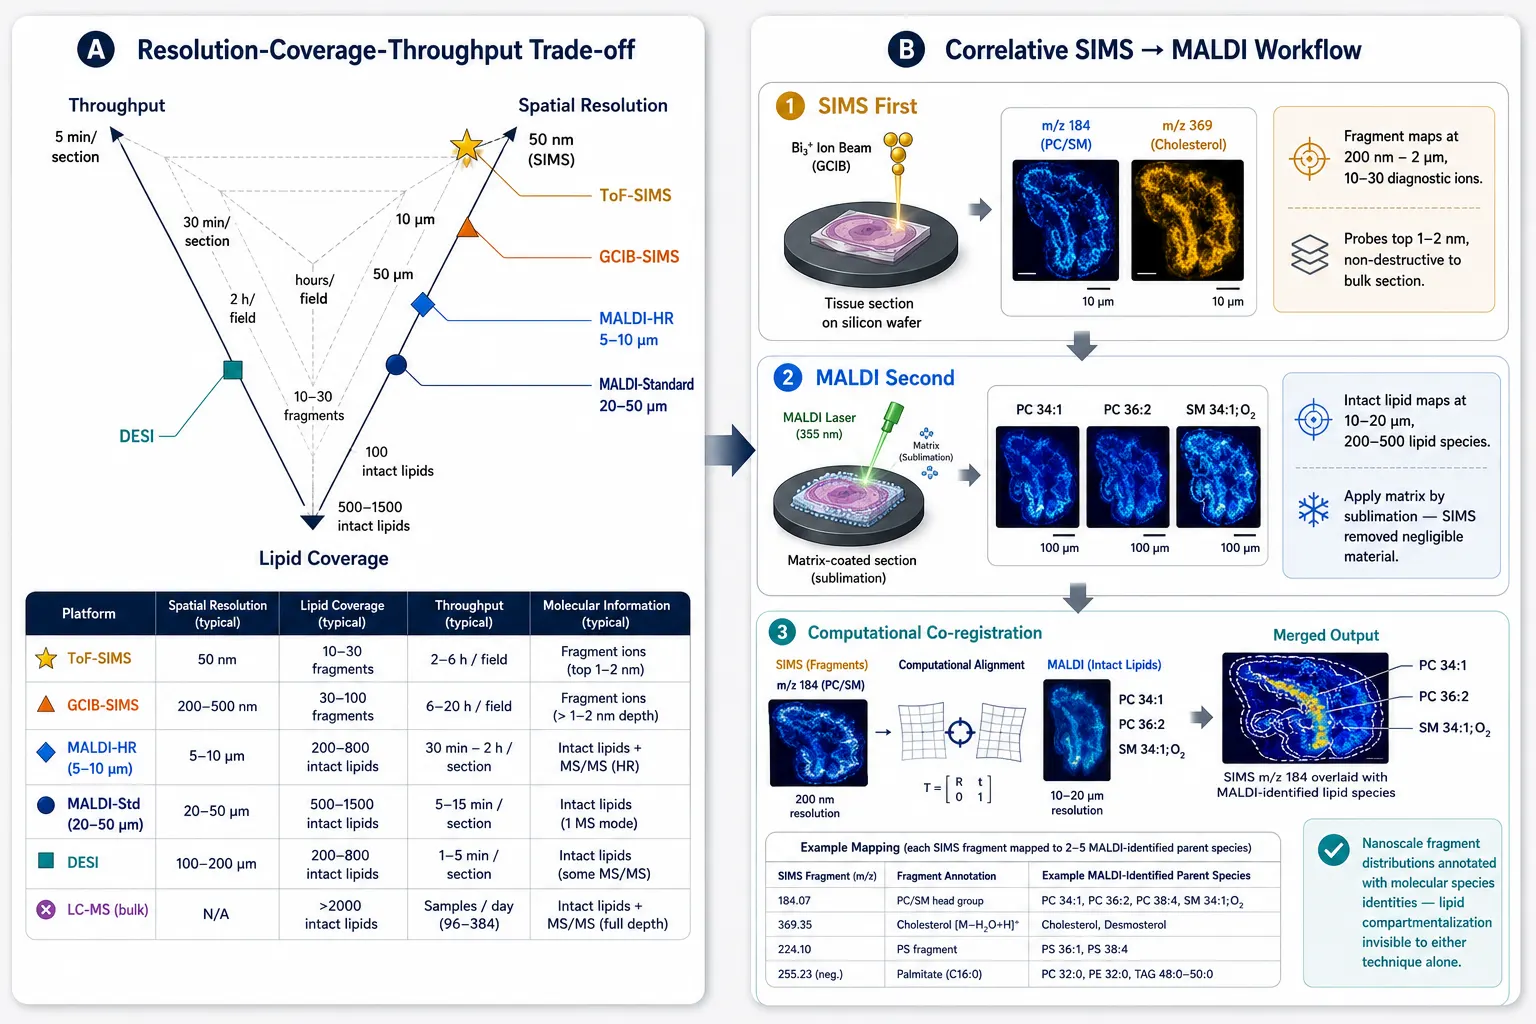 Figure 4: Multi-modal lipidomics ecosystem — resolution-coverage-throughput trade-off triangle across SIMS, MALDI, and DESI platforms, with a correlative SIMS→MALDI workflow diagram.*
Practical Considerations and Limitations
What SIMS Cannot Do
Setting realistic expectations prevents wasted instrument time and misinterpreted data:
- SIMS cannot identify intact lipid molecular species. With rare exceptions (GCIB-SIMS of abundant PC species), SIMS spectra lack intact [M+H]+ or [M-H]- ions. Lipid identification is limited to class-level assignment from fragment ions. Anyone who needs to distinguish PC 34:1 from PC 36:2 in their spatial maps should use MALDI-MSI for spatial lipidomics, not SIMS.
- Mass range is limited to ~1500 Da. The ToF analyzer's effective mass range for biological SIMS means large glycolipids (gangliosides, >2000 Da) and intact cardiolipins are inaccessible.
- Quantification is extremely challenging. Matrix effects in SIMS are severe and surface-dependent — the secondary ion yield of a given fragment depends on the local chemical environment (the "matrix effect" in the SIMS sense, meaning the surrounding material, not an applied MALDI matrix). Relative comparisons within a single sample are possible; absolute quantification across samples is not.
- Throughput is low. A high-resolution ToF-SIMS image of a 100 × 100 μm field at 200 nm pixel size contains 250,000 pixels. Even at millisecond dwell times, acquisition takes hours. SIMS is not suitable for screening large tissue areas or cohort studies — it is a targeted, high-resolution technique for pre-identified regions of interest.
When SIMS Is the Right Choice
SIMS is the right tool when:
- The biological question requires subcellular resolution (<1 μm) for lipid class or cholesterol distribution.
- The analytes of interest are abundant membrane components (PC, SM, cholesterol, PE) producing strong fragment signals.
- The study can be complemented by MALDI or LC-MS for molecular species identification, with SIMS providing the spatial precision component.
- The sample is compatible with silicon wafer substrates and matrix-free analysis.
- The research involves single particles (EVs, lipoproteins, LNPs) that are smaller than a MALDI pixel.
When these conditions are met, SIMS provides lipid spatial information that no other technique can access, filling a critical niche in the untargeted and targeted spatial lipidomics workflow — from discovery-level MALDI surveys to SIMS validation at nanoscale resolution.
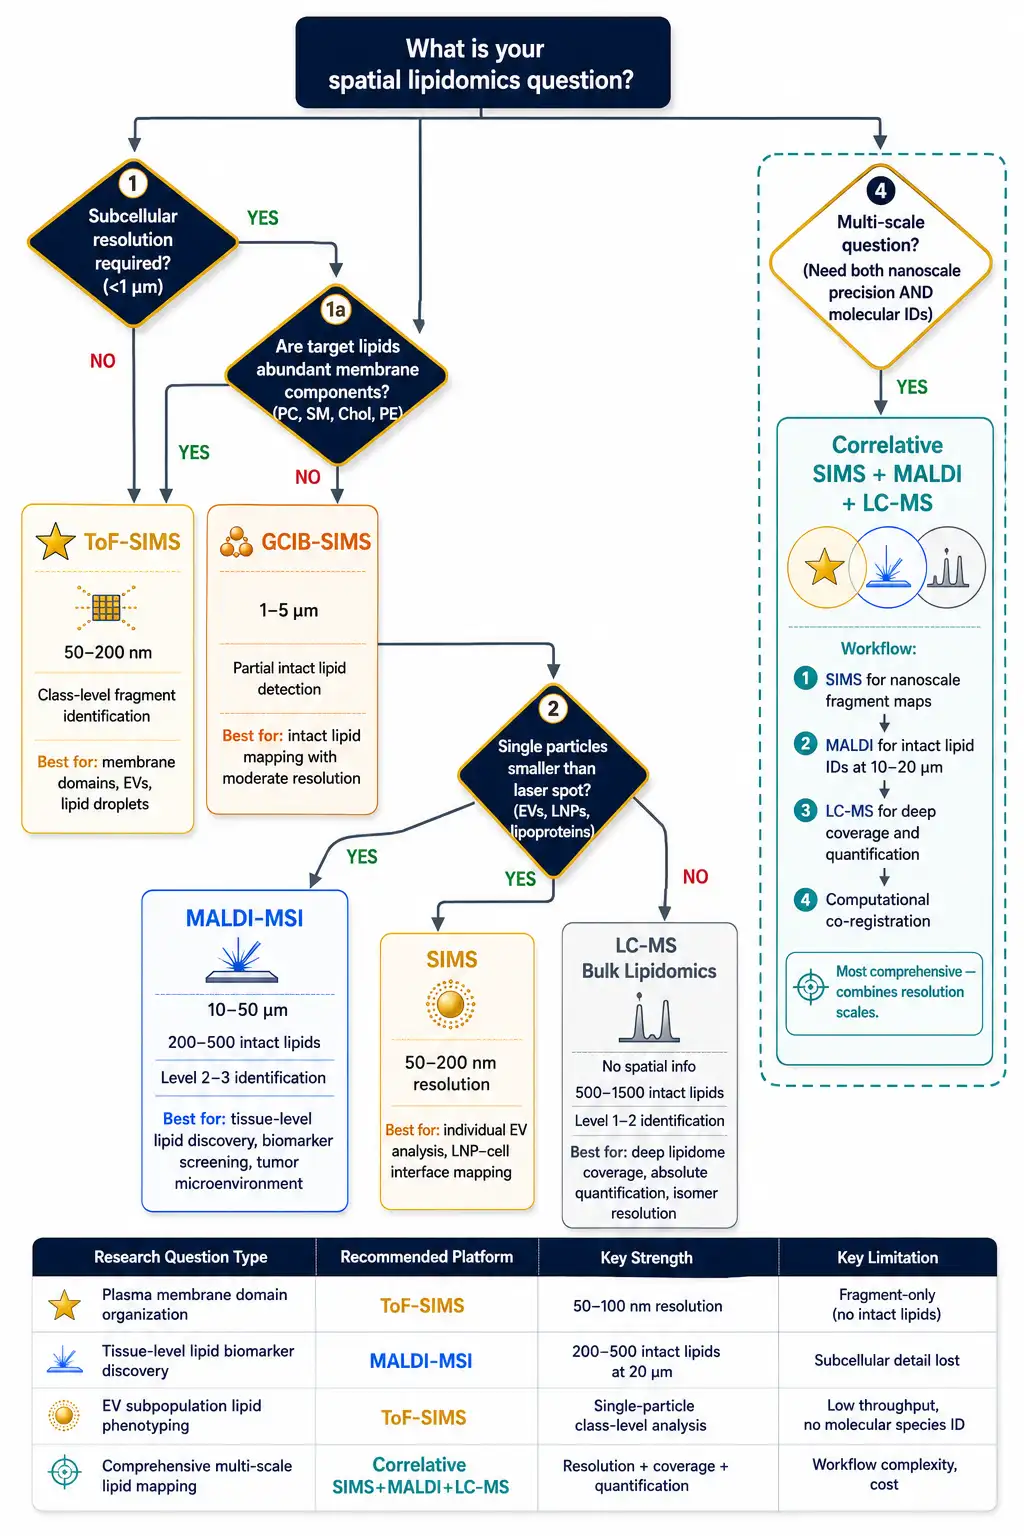 Figure 5: Decision flowchart for SIMS in spatial lipidomics — when to choose SIMS vs. MALDI vs. correlative workflows based on research question, required resolution, and acceptable molecular information trade-offs.*
FAQ
Q: What is the smallest structure SIMS can resolve for lipid imaging?
ToF-SIMS can resolve features as small as 50-100 nm, which is sufficient to distinguish plasma membrane subdomains, individual lipid droplets, and the membrane of single extracellular vesicles. However, the practical resolution limit for biological samples is often determined by signal intensity rather than instrumental optics — at very small pixel sizes, the number of secondary ions per pixel may be too low for statistically meaningful images. Most published biological SIMS studies use 200-500 nm pixel sizes as a practical compromise.
Q: Can SIMS detect intact phospholipids?
Generally no — conventional ToF-SIMS with Bi3+ or Ga+ primary ions produces extensive fragmentation, and intact [M+H]+ or [M-H]- ions are rarely observed above m/z 500. GCIB-SIMS with large gas clusters — typically (H2O)n+ or (CO2)n+ — can produce intact lipid ions for abundant species, but at a cost of spatial resolution (1-5 μm vs. 50-200 nm). If intact lipid detection is essential, MALDI-MSI is the appropriate platform.
Q: How should I validate SIMS lipid assignments?
Fragment ion assignments should be validated by: (1) high mass accuracy measurement (OrbiSIMS) to confirm elemental composition; (2) comparison with reference spectra of pure lipid standards deposited on silicon; (3) correlation with MALDI or LC-MS lipidomics data from the same sample to confirm that the inferred parent lipids are actually present; and (4) biological plausibility — does the spatial distribution of the fragment make sense given the known biology of the tissue?
Q: Is SIMS compatible with FFPE tissue?
No — for the same reasons FFPE is incompatible with lipid MALDI-MSI: formalin fixation causes N-formylation of PE and PS amines, methanol induces methyl esterification, and ethanol/xylene processing strips structural lipids. Additionally, paraffin embedding introduces hydrocarbon contaminants that produce intense SIMS signals in the lipid mass range. Fresh-frozen tissue sectioned onto silicon wafers is required.
References:
- Passarelli MK, Pirkl A, Moellers R, et al. The 3D OrbiSIMS — label-free metabolic imaging with subcellular lateral resolution and high mass-resolving power. Nat Methods. 2017;14(12):1175-1183. doi:10.1038/nmeth.4504
- Skalska ME, Durak-Kozica M, Stępień EŁ. ToF-SIMS revealing sphingolipids composition in extracellular vesicles and paternal β-cells after persistent hyperglycemia. Talanta. 2026;297(Pt A):128582. doi:10.1016/j.talanta.2025.128582
- Tian H, Rajbhandari P, Tarolli JG, et al. Multimodal mass spectrometry imaging identifies cell-type-specific metabolic and lipidomic variation in the mammalian liver. Dev Cell. 2024;59(7):869-881.e6. doi:10.1016/j.devcel.2024.01.025
- Uzoni S, Zanchin D, Chatzikyriakos V, Neittaanmäki N, Fletcher JS. Mapping the molecular landscape of human DLBCL by GCIB-SIMS. Anal Chem. 2025;97(13):7186-7194. doi:10.1021/acs.analchem.4c06594
- Skalska ME. Lipid analysis in biological structures — Is time-of-flight secondary ion mass spectrometry a valuable tool in nano-lipidomics? Bio-Algorithms Med-Syst. 2025;21(Special Issue):8-19. doi:10.5604/01.3001.0055.4327
- Fletcher JS, Vickerman JC, Winograd N. Label free biochemical 2D and 3D imaging using secondary ion mass spectrometry. Curr Opin Chem Biol. 2011;15(5):733-740. doi:10.1016/j.cbpa.2011.05.016
- Liebisch G, Fahy E, Aoki J, et al. Update on LIPID MAPS classification, nomenclature, and shorthand notation for MS-derived lipid structures. J Lipid Res. 2020;61(12):1539-1555. doi:10.1194/jlr.S120001025
- Brunelle A, Laprévote O. Lipid imaging with cluster time-of-flight secondary ion mass spectrometry. Anal Bioanal Chem. 2009;393(1):31-35. doi:10.1007/s00216-008-2367-3
- Maimó-Barceló A, Martín-Saiz L, Fernández JA, et al. A comprehensive review of lipid imaging mass spectrometry: Sample preparation to clinical translation. Prog Lipid Res. 2025;97:101319. doi:10.1016/j.plipres.2025.101319
- Chen Y, Angerer TB, Spraggins JM, Caprioli RM. Critical evaluation of sphingolipids detection by MALDI-MSI. J Am Soc Mass Spectrom. 2025;36(4):785-796. doi:10.1021/jasms.5c00012
The services described are for research use only. Not for use in diagnostic or therapeutic procedures.
















