

* This article is the definitive workflow guide for spatial lipidomics researchers transitioning from untargeted discovery to targeted validation. Unlike general MSI reviews, every section is structured as an operational decision point — lipid-class-specific MRM transition design, collision energy optimization per class, internal standard selection, LSI confidence level filtering, and cross-platform validation strategies — providing the actionable pipeline logic that no existing guide assembles in one place.
Introduction
Spatial lipidomics bridges two analytical paradigms that are usually treated separately: untargeted discovery (breadth-first, hypothesis-generating) and targeted validation (depth-first, hypothesis-testing). For research groups that have completed a discovery-phase MALDI or DESI imaging experiment and now face a list of 50-200 differential lipid m/z features, the path from statistical association to spatially validated biomarker is not a single-method problem — it requires an integrated workflow spanning instrument platforms, acquisition modes, and statistical frameworks.
This article provides that workflow. It moves sequentially through the three phases of the spatial lipid biomarker pipeline: untargeted discovery (full-scan MSI, DDA/DIA, feature detection, annotation), candidate selection (LSI confidence levels, statistical filtering, spatial coherence, biological relevance), and targeted validation (MRM/PRM panel design, lipid-class-specific transitions, internal standard strategy, cross-platform concordance). Each section addresses the operational decisions that determine whether a spatial lipidomics study produces robust, replicable biomarkers or artifacts of platform bias and statistical overfitting.
The Spatial Lipidomics Workflow Continuum
Spatial lipidomics follows the same logic as its bulk LC-MS counterpart but adds a dimension that changes everything: anatomical context. A lipid biomarker is not merely differentially abundant — it is differentially abundant in a specific tissue compartment. This spatial constraint makes the untargeted-to-targeted pipeline both more powerful and more operationally complex than its bulk analogue.
Why Lipids Need Both Untargeted and Targeted Spatial Approaches
Untargeted spatial lipidomics provides breadth: 200–500 lipid features detected across a tissue section, revealing the global lipid landscape without prior hypothesis. Targeted spatial lipidomics provides depth: 10–50 pre-selected lipid species measured with quantitative precision at each pixel, validated across biological replicates. Neither approach alone answers the full biological question. Untargeted MSI without targeted follow-up leaves candidate biomarkers unvalidated. Targeted MSI without untargeted discovery is blind — you can only measure what you already know to look for.
Lipids present a unique case for this dual approach because lipid class coverage differs systematically between acquisition modes. In untargeted full-scan MALDI-MSI, positive-ion mode detects PC and SM with high sensitivity while PE, PS, PI, and PA are suppressed or invisible. In targeted MRM mode on a triple quadrupole, each lipid class can be measured in its optimal polarity with class-optimized collision energy — eliminating the ion suppression artifacts that plague untargeted positive-mode comparisons. For a deeper treatment of MALDI-specific matrix and polarity considerations, see our guide on MALDI-MSI for spatial lipidomics.
The Biomarker Pipeline: Discovery → Verification → Validation
The spatial lipid biomarker pipeline proceeds through three phases, each with distinct analytical demands:
| Phase | Approach | Cohort | Goal | Output |
|---|---|---|---|---|
| Discovery | Full-scan MSI (untargeted) | n = 3–5/group | Breadth — detect all differential features | 20–100 candidate m/z features (Level 3–4) |
| Verification | On-tissue MS/MS or IMS | Same/adjacent sections | Confirm lipid identity | 10–30 verified candidates (Level 2–3) |
| Validation | MRM-based quantification | n = 8–15/group (independent) | Confirm generalizability | 5–15 validated biomarkers (Level 2) |
Each phase narrows the candidate pool while increasing confidence, transforming a statistical association into a spatially validated biomarker. For the broader technology landscape — including when to use DESI, SIMS, or LA-ICP-MS instead of MALDI — see our spatial metabolomics technology guide.
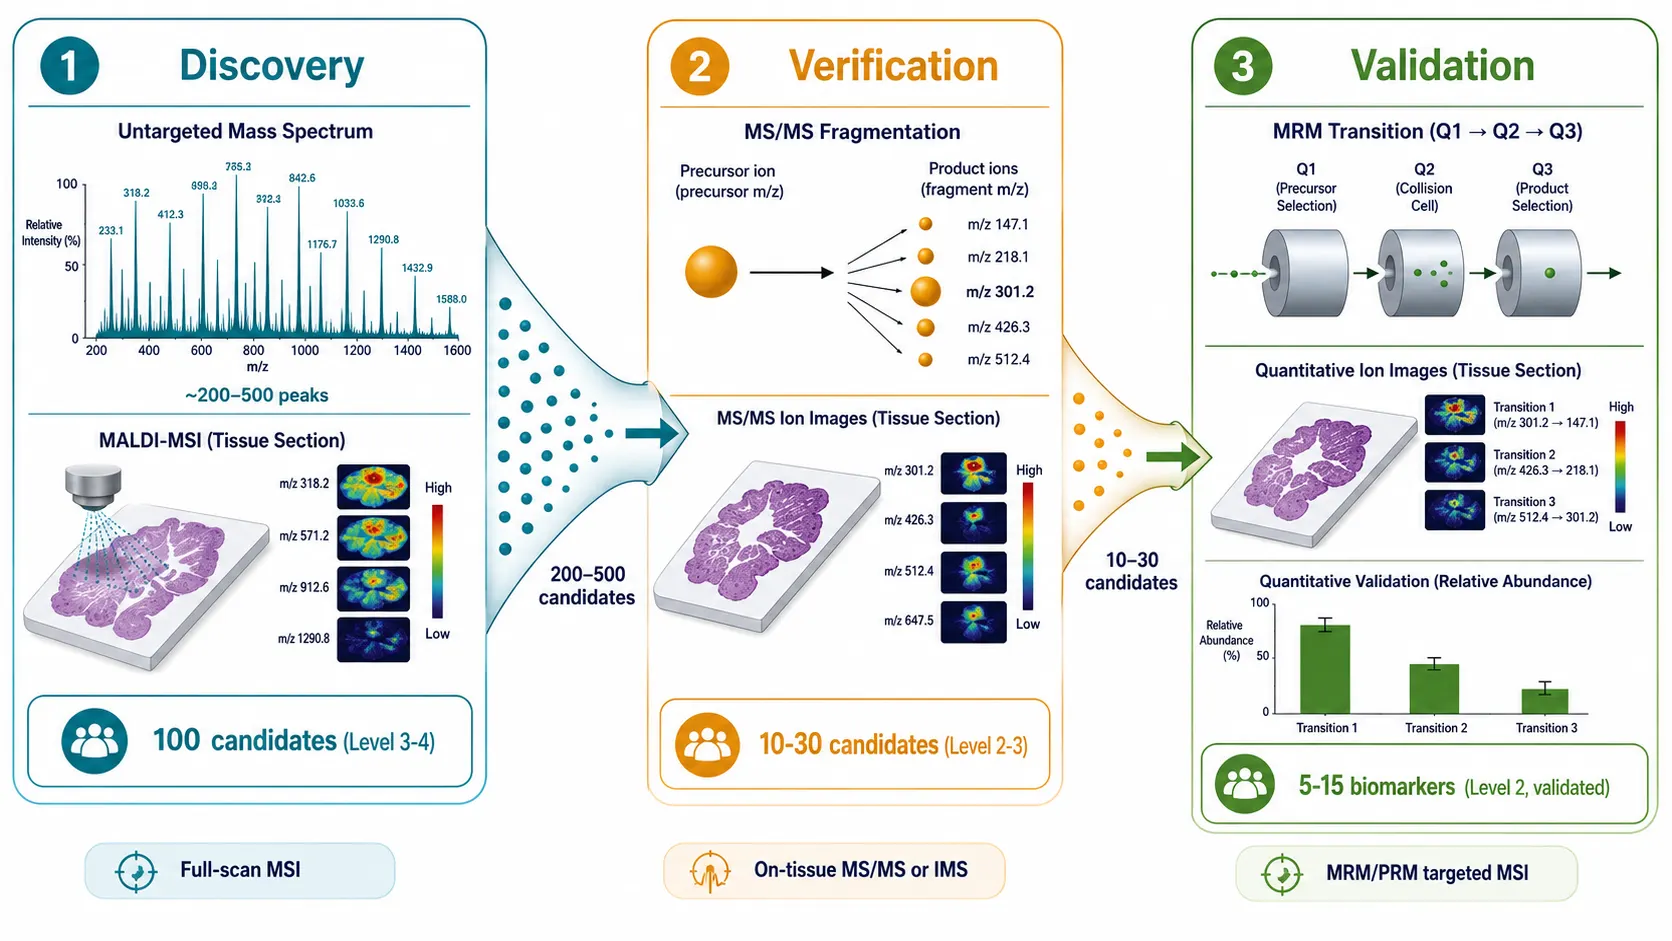 Figure 1: Discovery-to-validation workflow continuum — horizontal pipeline diagram showing the three phases (Discovery → Verification → Validation) with candidate numbers narrowing at each stage, analytical platforms specified, and example data outputs from full-scan MSI through MRM-based quantification.*
Untargeted Spatial Lipidomics — Discovery Phase
The discovery phase generates the raw material for the entire biomarker pipeline. Its success or failure determines whether downstream validation has real biology to confirm or noise to chase.
Full-Scan MSI for Comprehensive Lipid Coverage: MALDI vs. DESI for Discovery
MALDI-MSI and DESI-MSI present a trade-off between spatial resolution and molecular coverage for untargeted lipid discovery. MALDI at 20–50 μm with DHB (positive mode) or 9-AA (negative mode) detects 200–500 lipid features per tissue section, with 50–150 achieving Level 2–3 annotation after on-tissue MS/MS and METASPACE spatial FDR filtering. MALDI's higher spatial resolution (down to 5–10 μm) enables cellular-level lipid mapping, detecting heterogeneity that DESI's 50–100 μm footprint averages across multiple cell types. The trade-off is matrix interference below m/z 400 and the labor of matrix application.
DESI-MSI offers ambient operation with minimal sample preparation — no matrix, no vacuum, tissue preserved for subsequent H&E staining. Its lipid coverage is comparable to MALDI for abundant phospholipid classes (PC, SM, PE), but detection of low-abundance lipids such as PI, PS, PA, and gangliosides is generally lower. Complementary glycerophospholipid analysis by LC-MS can fill this gap for acidic phospholipid classes. For discovery-phase experiments where sample integrity for multi-omics integration is paramount, DESI's non-destructive nature is decisive.
DDA and DIA for Lipid MS/MS in Spatial Context
Data-dependent acquisition (DDA) and data-independent acquisition (DIA) are increasingly applied in MALDI-MSI for lipid structural characterization. In DDA-mode MSI, the instrument selects the top N most intense precursor ions per pixel for MS/MS fragmentation — efficient for abundant lipids but biased against low-abundance species. Modern DIA approaches using sequential window acquisition (SWATH-type strategies adapted for MSI) fragment all ions within predefined m/z windows regardless of intensity, generating comprehensive MS/MS spectra that can be retrospectively mined for any lipid feature. For a typical mouse brain section at 30 μm resolution, DIA-MSI can generate MS/MS information for 300–600 lipid features per polarity, compared to 100–200 for DDA — but at the cost of larger data files and more complex post-acquisition processing.
For untargeted lipidomics by LC-MS, complementary DDA/DIA strategies provide orthogonal depth for lipid isomers that require chromatographic separation.
Lipid Feature Detection: Peak Picking, Deisotoping, Adduct Deconvolution
Feature detection in spatial lipidomics is more challenging than in LC-MS because every pixel contains the full tissue lipidome co-ionized. Peak picking in MSI data requires spatial-aware algorithms that distinguish genuine lipid signals from chemical noise based not only on spectral quality (S/N ≥ 3–5) but also on spatial coherence — a genuine lipid should produce an anatomically structured ion image, not random salt-and-pepper noise.
Deisotoping removes ¹³C isotopologue peaks that would otherwise be counted as separate features. For lipids at m/z 700–900, the [M+1] and [M+2] isotopologues are substantial (the latter due to two ¹³C atoms or one ³⁴S in sulfatides) and must be collapsed to the monoisotopic peak. Automated bioinformatic preprocessing pipelines handle deisotoping, adduct deconvolution, and peak alignment consistently across large MSI datasets.
Adduct deconvolution is lipid-class-specific and often overlooked. In positive mode, a single PC species can appear as [M+H]⁺, [M+Na]⁺, and [M+K]⁺ — three peaks for one lipid. Sodium and potassium concentrations vary regionally within tissue, producing spatially heterogeneous adduct ratios that mimic differential lipid abundance. Computational adduct deconvolution using MALDI imaging lipidomics pipelines groups adducts based on mass differences (21.982 Da for Na→K substitution) and correlated spatial distributions.
Untargeted Lipid Annotation: LIPID MAPS and METASPACE
Database matching for spatial lipidomics uses two complementary approaches. The LIPID MAPS Structure Database (LMSD, >45,000 curated entries) supports batch accurate-mass matching (±3 ppm) with adduct specification — but produces many false positives due to the isobaric ambiguity inherent to lipids at nominal mass resolution.
METASPACE adds a spatial dimension to annotation: candidate lipid identities are evaluated not only by mass accuracy but by whether the resulting ion image is spatially coherent. A mass match that produces a random noise image is penalized; a mass match that produces an anatomically structured image (e.g., white-matter-enriched sulfatide distribution) gains confidence. METASPACE's FDR-controlled annotation and community metabolite database make it the current standard for MSI lipid annotation.
Statistical Analysis for Biomarker Discovery
Spatial lipid biomarker discovery requires statistical methods that account for spatial autocorrelation — neighboring pixels are not independent observations, and treating them as such inflates significance.
Principal component analysis (PCA) on pixel-level lipid intensity matrices reveals the dominant axes of lipid variance across tissue regions, identifying which lipid classes drive tissue-type separation. Partial least squares-discriminant analysis (PLS-DA) and orthogonal PLS-DA (OPLS-DA) incorporate group labels (e.g., tumor vs. normal) to extract discriminating lipid features, with variable importance in projection (VIP) scores ranking candidates. For spatially structured comparisons, region-of-interest (ROI)-based analysis — extracting mean intensities from histologically defined regions and comparing across biological replicates with t-tests or Mann-Whitney U tests with Benjamini-Hochberg FDR correction — provides the most statistically defensible approach because it treats biological replicates, not pixels, as the unit of observation.
Lipid Coverage Expectations
A standard untargeted MALDI-MSI experiment on fresh-frozen tissue at 20–30 μm detects 200–500 lipid features in positive mode (DHB) and 100–300 in negative mode (9-AA), with 50–150 achieving Level 2–3 annotation confidence. Coverage is tissue-dependent: brain white matter yields abundant sulfatides and galactosylceramides; liver yields rich TAG and PC profiles; kidney medulla shows strong [M+Na]⁺ adduct dominance. Understanding the expected lipid landscape of your tissue type prevents over-interpretation of tissue-specific detection biases as biological differences.
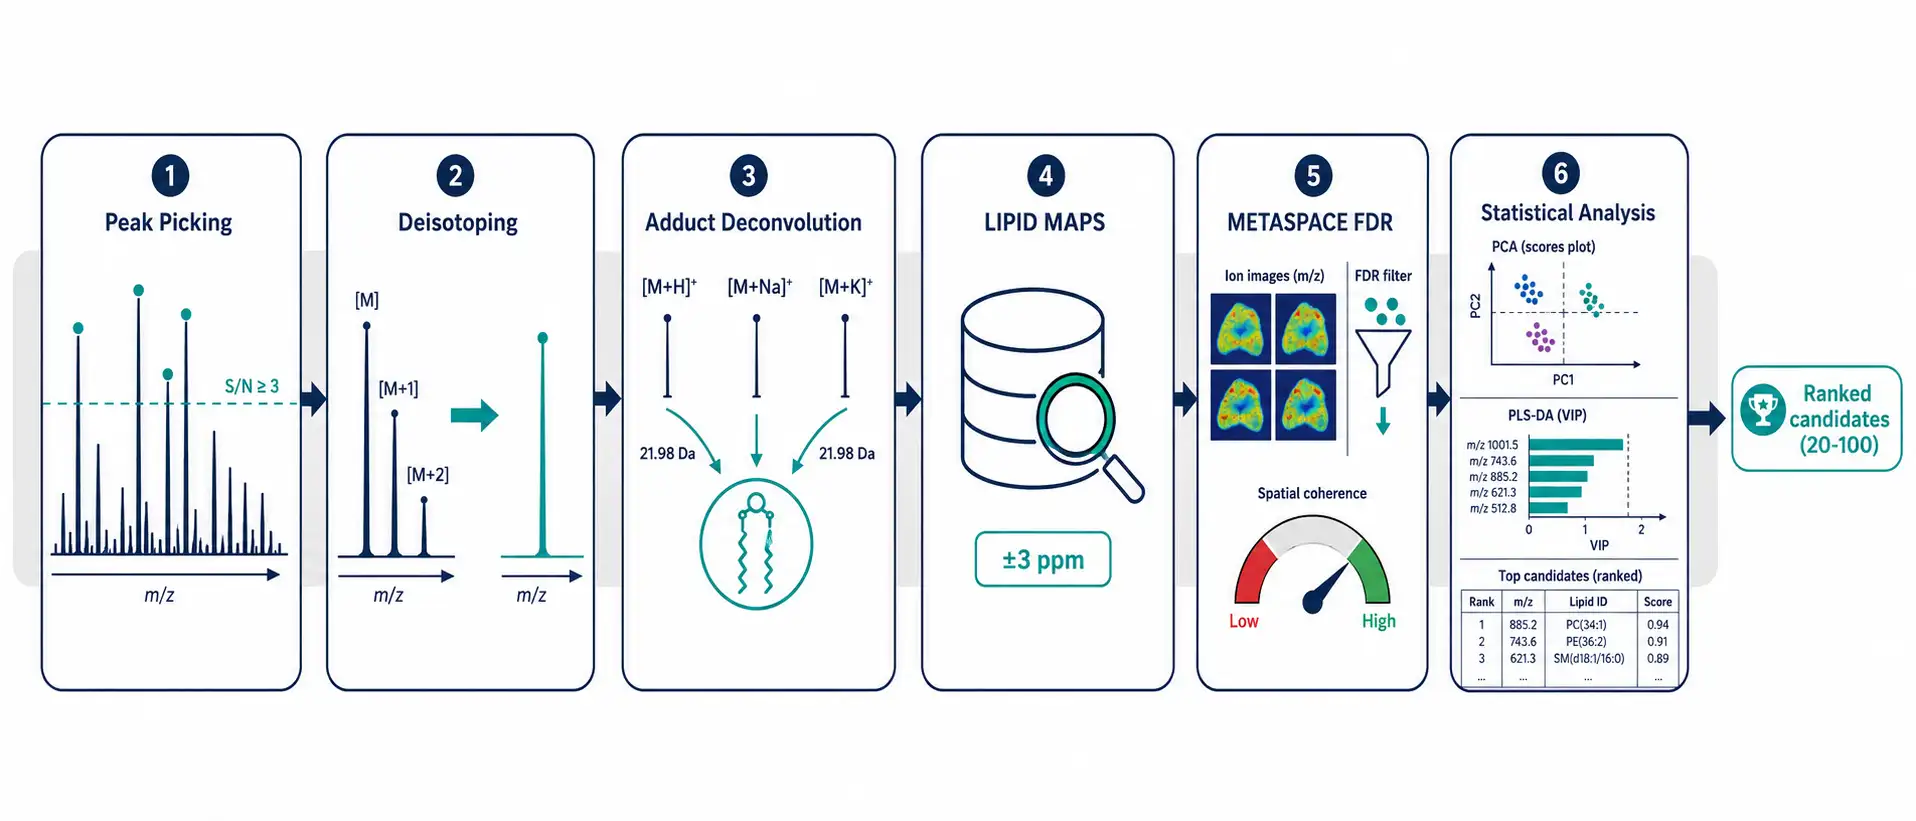 Figure 2: Untargeted MSI data analysis pipeline — peak picking → deisotoping → adduct deconvolution → LIPID MAPS matching → METASPACE spatial FDR → statistical analysis (PCA, PLS-DA, OPLS-DA) → ranked candidate list.*
From Discovery to Candidate Selection
The transition from discovery to targeted validation is where most spatial lipidomics studies lose rigor. A list of 100 differential m/z features is not a biomarker panel — it is raw material that requires systematic filtering.
Criteria for Selecting Lipid Biomarker Candidates
Candidate selection applies four filters in sequence:
1. Identification confidence: Candidates must achieve at minimum Level 3 (lipid class + sum composition confirmed by MS/MS). Level 4 candidates (accurate mass only) carry unacceptable isobaric ambiguity — a m/z 760.6 feature in positive mode could be PC(34:1) [M+H]⁺ or PE(37:1) [M+Na]⁺, and no statistical strength can compensate for uncertain identity. On-tissue MS/MS or ion mobility CCS filtering resolves this ambiguity.
2. Statistical significance: FDR-adjusted p < 0.05 in ROI-based comparison, with effect size (fold change ≥ 2.0 or Cohen's d ≥ 0.8) to filter statistically significant but biologically negligible differences.
3. Spatial coherence: The ion image must show anatomically interpretable distribution — not random noise, not edge artifact, not matrix hot-spot. METASPACE spatial FDR and visual inspection of ion images are both necessary.
4. Biological relevance: The candidate lipid class and its known biological functions must align with the disease or process under study. Ceramide accumulation at sites of inflammation, sulfatide depletion in demyelination, and PC remodeling in proliferating cells are mechanistically interpretable patterns that strengthen the case for a candidate beyond p-values alone.
Lipid Identification Confidence — LSI Levels in Practice
The Lipidomics Standards Initiative (LSI) defines four identification levels that map directly onto the candidate selection workflow:
| Level | Requirement | Role in Pipeline |
|---|---|---|
| Level 4 | Accurate mass (±3 ppm) | Initial screening only; insufficient for candidate selection |
| Level 3 | Lipid class + sum composition confirmed by MS/MS | Minimum standard for verification-phase candidates |
| Level 2 | Individual fatty acyl composition resolved | Required for validation-phase candidates; enables biological interpretation |
| Level 1 | Full structure (sn-position, C=C location, branching) | Gold standard; typically requires ion mobility, OzID, or specialized derivatization |
For most biomarker studies, Level 2 identification is the practical target: it confirms which specific lipid species is changing and enables biological interpretation without the specialized instrumentation that Level 1 demands.
Prioritization: Statistics × Effect Size × Biology
The three criteria are not equally weighted. A lipid with a compelling biological rationale and moderate p-value (p = 0.02, fold change = 1.8) may be a better biomarker candidate than one with extreme p-value (p = 0.0001, fold change = 5.0) but no known biological connection to the disease. The prioritization matrix integrates all three: rank candidates by the product of statistical confidence, effect magnitude, and biological plausibility score (0–3, where 3 = established mechanistic link to the disease, 1 = weak or unknown connection). This structured prioritization prevents the common mistake of advancing the most statistically extreme (but biologically meaningless) features to expensive targeted validation.
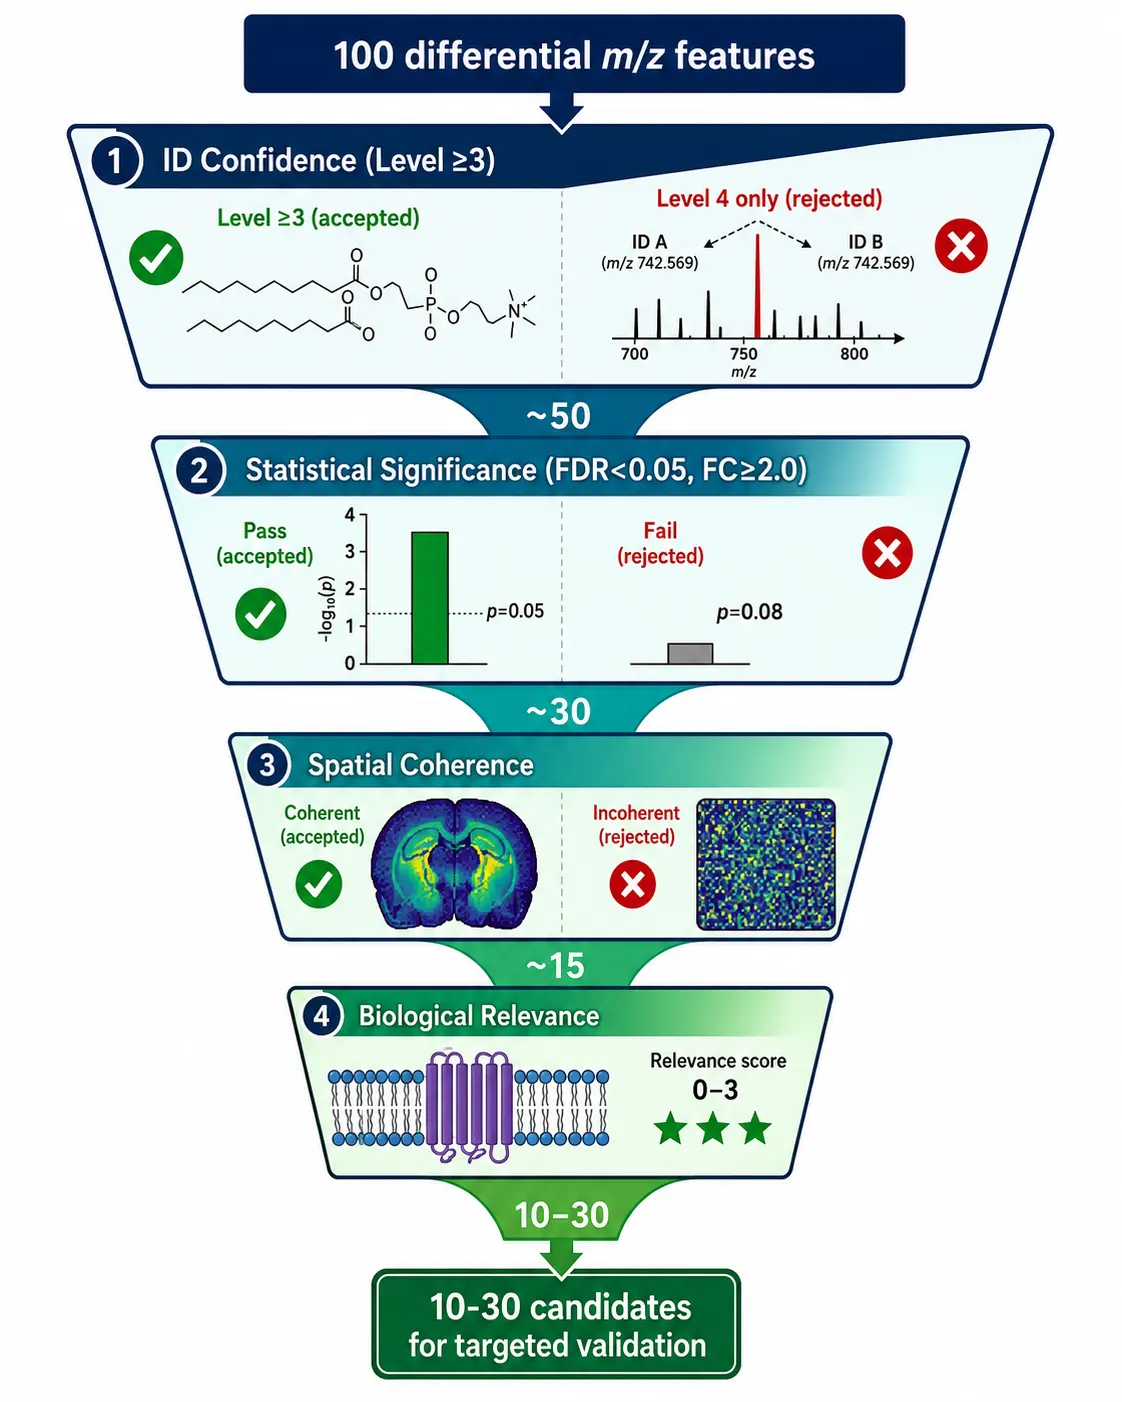 Figure 3: Candidate selection criteria and filtering flowchart — four sequential filters (ID confidence → statistics → spatial coherence → biological relevance) with example candidates passing and failing at each stage.*
Targeted Spatial Lipidomics — Validation Phase
Targeted spatial lipidomics transforms candidate m/z features into validated, quantifiable biomarkers by shifting from full-scan discovery to MRM-based quantification on an independent cohort.
MRM/PRM-Based Targeted Lipid Imaging
Multiple reaction monitoring (MRM) on a triple quadrupole mass spectrometer is the workhorse of targeted lipid quantification. In MRM mode, Q1 selects the precursor lipid ion, Q2 fragments it at optimized collision energy, and Q3 monitors a specific product ion — typically the characteristic head group fragment. This triple-filter eliminates chemical noise, producing ion images with substantially higher signal-to-noise than full-scan MSI for the same acquisition time.
For spatial lipidomics, MRM imaging on a MALDI-triple quadrupole platform achieves 20–50 μm resolution with quantitative precision comparable to LC-MRM when internal standards are co-deposited with the matrix. DESI-MRM offers the advantage of ambient operation and is particularly suited to high-throughput validation of larger cohorts (n > 20) where MALDI's matrix application becomes a throughput bottleneck. The key trade-off: MALDI-MRM provides higher spatial resolution; DESI-MRM provides higher sample throughput.
Parallel reaction monitoring (PRM) on high-resolution instruments (Q-Orbitrap) offers an alternative: all product ions are collected in parallel at high resolution, enabling post-acquisition selection of the optimal quantifier ion. PRM is advantageous when the best fragment ion is not known in advance, but acquisition speed is slower than MRM, limiting pixel density.
Custom Panel Design: Lipid Transitions and Collision Energy
Designing a targeted lipid MRM panel requires selecting precursor→product transitions that are both sensitive and specific. For each lipid candidate, the optimal MRM transition depends on the lipid class and ionization mode:
- Phosphatidylcholine (PC) and sphingomyelin (SM): Positive mode, precursor [M+H]⁺ → product m/z 184 (phosphocholine head group). CE 30–35 eV. This transition is class-characteristic but not species-specific — all PC/SM species share the m/z 184 fragment. Species specificity comes from the precursor m/z selection in Q1.
- Phosphatidylethanolamine (PE): Positive mode, precursor [M+H]⁺ → product [M+H−141]⁺ (neutral loss of phosphoethanolamine). CE 25–30 eV. Alternatively, negative mode, precursor [M−H]⁻ → fatty acyl carboxylate fragments for sn-chain composition.
- Phosphatidylinositol (PI): Negative mode, precursor [M−H]⁻ → fatty acyl carboxylate fragments. CE 35–45 eV. The inositol head group fragment (m/z 241) can also be used but is less sensitive than carboxylate fragments.
- Sulfatides (ST): Negative mode, precursor [M−H]⁻ → product m/z 97 (HSO₄⁻). CE 40–50 eV. This sulfate-specific fragment provides class-selective detection.
Collision energy optimization is lipid-species-specific and must be performed for each candidate empirically, typically by ramping CE from 15 to 55 eV on a standard lipid mixture and selecting the value producing maximum fragment intensity. For panels of 10–30 lipids spanning multiple classes, grouping transitions by class-specific CE ranges reduces acquisition overhead while maintaining near-optimal sensitivity.
Lipid Class-Specific Panels
Rather than designing a single monolithic MRM panel, class-specific sub-panels offer practical advantages for spatial lipidomics:
| Panel | Lipid Classes | Polarity | Typical Size | Key Transitions |
|---|---|---|---|---|
| Phospholipid Panel | PC, PE, PS, PI, PG, PA | Positive + Negative | 10–20 | m/z 184 (PC/SM), NL 141 (PE), m/z 87 (PS) |
| Sphingolipid Panel | SM, Cer, HexCer, ST, GM1/GM3 | Positive + Negative | 8–15 | m/z 184 (SM), m/z 97 (ST), Cer-H₂O |
| Neutral Lipid Panel | TAG, DAG, CE | Positive (+NH₄⁺) | 5–10 | [M+NH₄]⁺ → [DAG]⁺ fragments |
| Fatty Acid Panel | FA, oxidized FA, eicosanoids | Negative | 5–10 | [M−H]⁻ → specific carboxylate fragments |
Class-specific panels allow CE optimization per class, reduce cycle time per pixel compared to a single large panel, and provide built-in quality control — unexpected peak patterns within a class panel are immediately suspicious.
Internal Standard Selection
For absolute or normalized quantification, internal standards must be:
- A lipid class representative not endogenous to the tissue (odd-chain or deuterated lipids: PC 17:0/17:0, PE 15:0/15:0, PS 17:0/17:0)
- Co-deposited with the matrix for extraction-matched response
- Monitored in the same MRM acquisition as target analytes
- Used at a concentration producing similar ion intensity to endogenous lipids (typically 0.5–2.0 pmol/μL in the matrix solution)
At minimum, one internal standard per lipid class is required. For full quantification, one standard per target lipid species is ideal but rarely practical — the cost of synthesizing 30 deuterated lipid standards is prohibitive for most studies. A pragmatic compromise: one SIL standard per lipid class for normalization, with absolute quantification reserved for the top 3–5 validated biomarkers using species-matched SIL standards. For workflows requiring absolute quantification, see our guide on quantitative spatial lipidomics.
Spatial Resolution and Throughput Trade-Offs
Targeted MRM imaging involves a three-way trade-off: spatial resolution × number of transitions × acquisition time. A 20-lipid panel with 50 ms dwell time per transition requires ~1 second per pixel, or ~3 hours for a 100 × 100 pixel image. Reducing the panel to 10 lipids halves the acquisition time; reducing resolution from 20 to 50 μm divides the pixel count by ~6. For validation-phase studies, 30–50 μm resolution with a 10–15 lipid panel provides a practical balance — sufficient spatial detail with acquisition times under 2 hours per section. For targeted lipidomics by LC-MS, complementary quantitative precision is available for biomarkers that do not require spatial context.
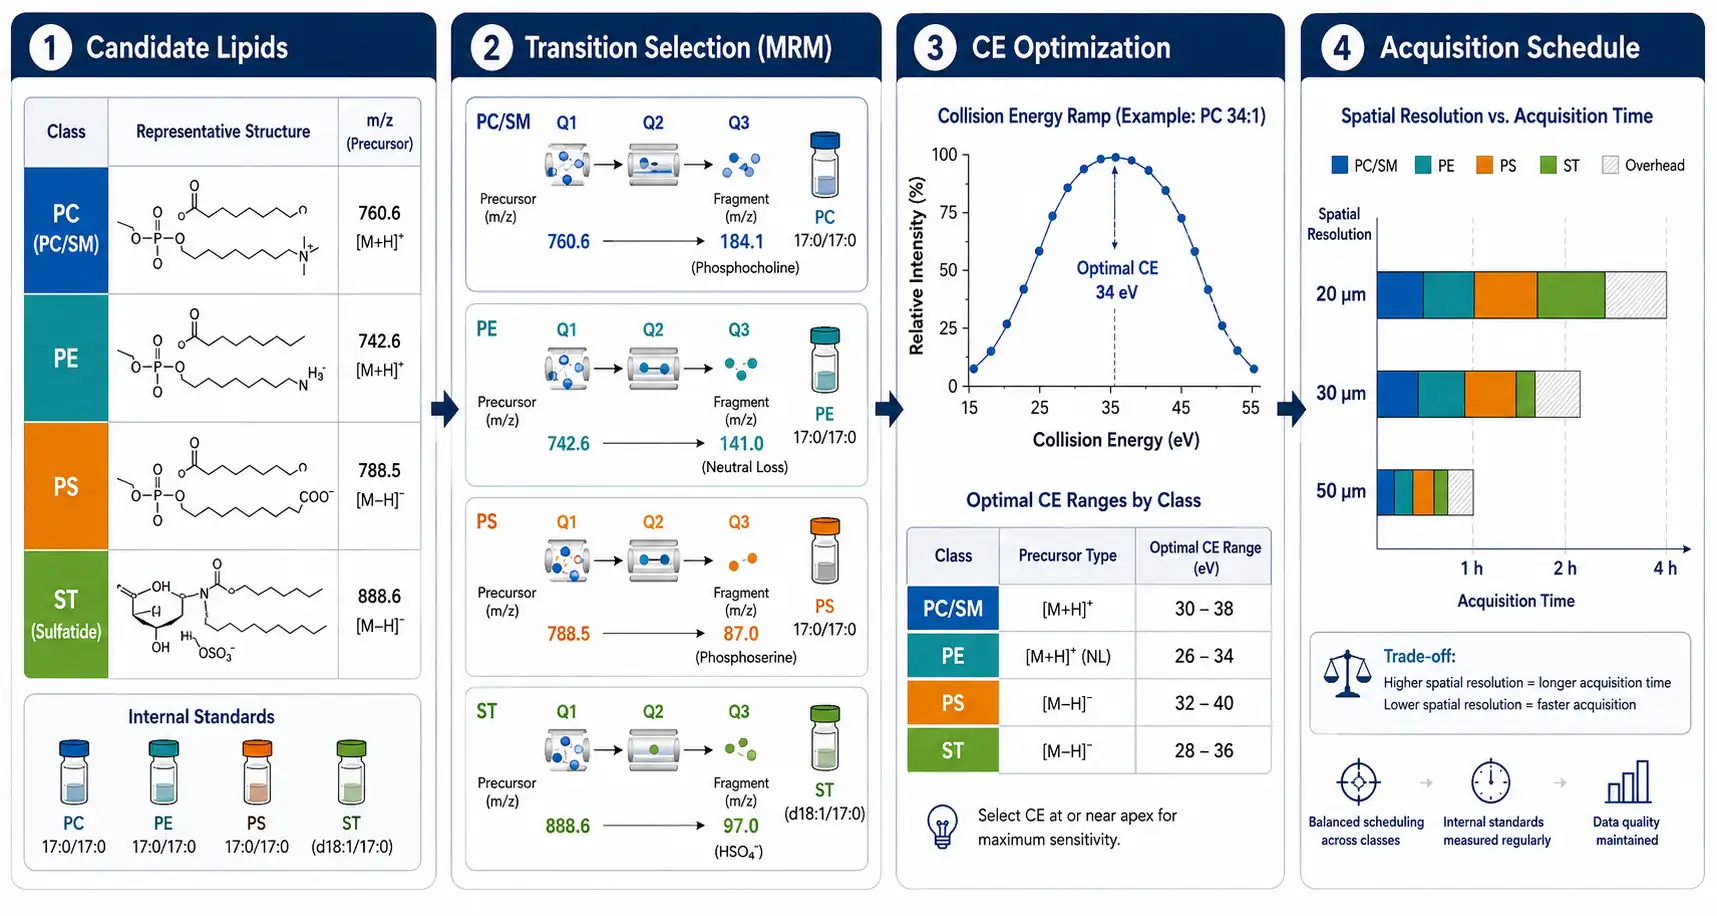 Figure 4: Targeted MRM panel design workflow — from candidate lipid list through class-specific transition selection, collision energy optimization curves, internal standard assignment, and final acquisition schedule showing spatial resolution options and estimated acquisition times.*
Integrating Untargeted and Targeted Data
The untargeted and targeted phases produce fundamentally different data types — hundreds of low-confidence features vs. tens of high-confidence, quantified lipids — and integrating them requires explicit strategy.
Cross-Platform Validation: MALDI Discovery → DESI-MRM or MALDI-MRM Follow-Up
The most common integration strategy uses MALDI-MSI for untargeted discovery on a small cohort (n = 3–5 per group) and DESI-MRM or MALDI-MRM for targeted validation on a larger independent cohort (n = 8–15 per group). The cross-platform step introduces a critical validation check: if a lipid biomarker discovered by MALDI is confirmed by DESI-MRM on a different instrument platform with different ionization physics, the biological signal is robust rather than platform-dependent. Cross-platform concordance rates for validated lipid biomarkers (Level 2–3 identification) are typically 70–90%, with discordance attributable to platform-specific ionization biases and matrix effects.
When both discovery and validation use the same MALDI platform, sensitivity is higher but platform-specific artifacts may be perpetuated. The ideal design includes at least one cross-platform step: MALDI discovery (n = 5/group) → MALDI-MRM verification (same sections) → DESI-MRM or MALDI-MRM validation on an independent cohort (n = 10–12/group).
Data Integration Strategies
Integration of untargeted and targeted spatial lipidomics data requires co-registration to a common anatomical reference. The standard approach uses H&E-stained adjacent sections as the registration bridge: untargeted ion images and targeted MRM ion images are both registered to the H&E image via affine or non-rigid transformation, enabling direct comparison of discovery-phase feature maps with validation-phase quantitative maps at the same tissue coordinates. For comparative spatial lipidomics study designs involving multiple groups, registration to a common anatomical atlas further enables cross-animal statistical comparisons.
Reporting standards for integrated studies should include: (1) the full list of discovery-phase features with tentative annotations, mass accuracy, and spatial QC metrics; (2) the candidate selection criteria and the number of features surviving each filter; (3) for each validated biomarker, the discovery-phase statistics and the independent validation-phase statistics; and (4) co-registered ion images showing the spatial concordance between untargeted and targeted measurements.
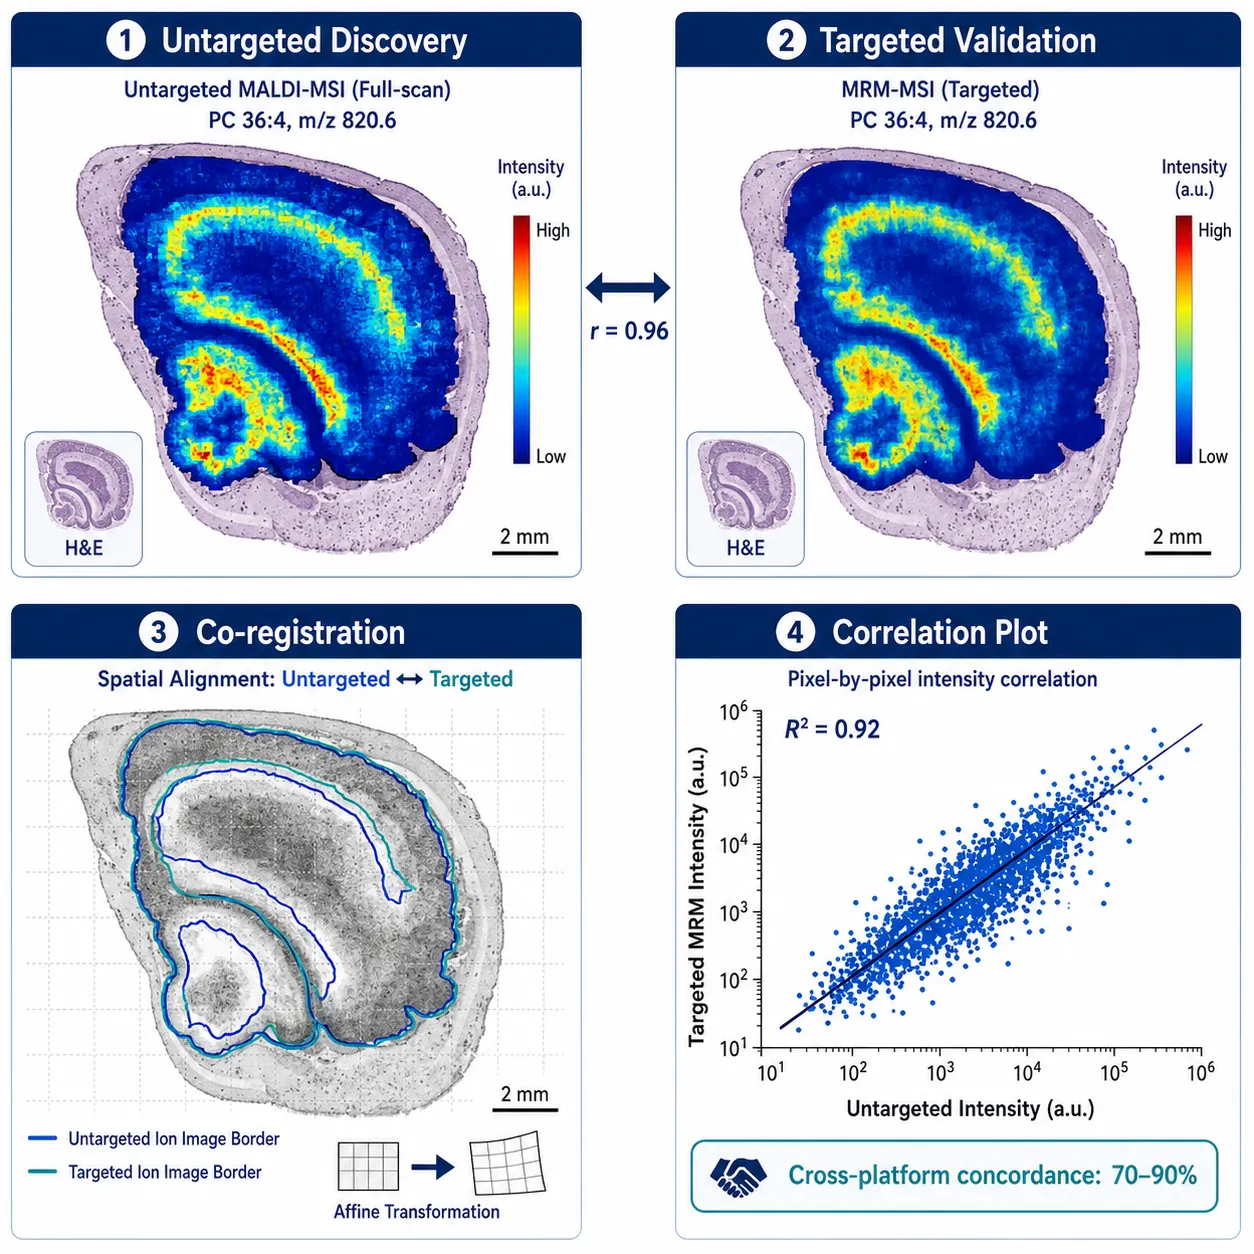 Figure 5: Integration of untargeted and targeted spatial data — multi-panel visualization showing co-registration of untargeted discovery ion images with targeted MRM validation maps on the same anatomical reference (H&E), with scatter plot of untargeted vs. targeted intensity correlation and concordance metrics.*
Key Applications
Cancer Lipid Biomarker Discovery and Validation
Spatial lipidomics is uniquely suited to cancer biomarker discovery because tumors are spatially heterogeneous — the invasive margin, necrotic core, and stromal interface each carry distinct lipid profiles that bulk analysis conflates. A 2025 integrated workflow demonstrated this approach in colon cancer: untargeted MALDI-MSI on tumor sections identified 85 differential lipid features between tumor-infiltrating lymphocyte (TIL)-rich and TIL-poor regions; MS/MS verification narrowed these to 23 candidates with Level 2–3 identification; targeted MRM validation on an independent cohort of 30 participants confirmed 12 lipid biomarkers distinguishing immune-infiltrated from immune-excluded tumors, with spatial concordance (r = 0.96) between untargeted and targeted measurements. PC 36:4 and PI 38:4 depletion in TIL-rich regions was the strongest single-biomarker signal (AUC 0.88).
Neurodegenerative Disease: Regional Lipid Alterations and Targeted Follow-Up
In Alzheimer's disease models, untargeted MALDI-MSI discovery has revealed region-specific sulfatide depletion and ceramide enrichment around amyloid plaques. Targeted MRM panels for 15 sulfatide and ceramide species subsequently validated these findings across multiple brain regions and disease stages, confirming that ST 24:1 depletion precedes histological plaque formation in the hippocampal CA1 region — a finding that bulk lipidomics could not spatially resolve. This discovery → validation pipeline exemplifies how spatial context converts a statistical lipid change into a region-specific, mechanistically interpretable biomarker.
Pharmacological Lipidomics: Screen Then Quantify
Drug-induced lipid changes present a practical use case for the untargeted→targeted workflow. In preclinical toxicology, untargeted MALDI-MSI of liver and kidney sections from treated vs. control animals screens for drug-induced steatosis, phospholipidosis, or ceramide accumulation patterns across tissue zones. Candidate lipid features that co-localize with histological lesions are then assembled into a targeted MRM panel for dose-response and time-course studies, quantifying the spatial progression of lipid pathology with treatment duration. This approach has been applied to characterize hepatic phospholipid accumulation induced by cationic amphiphilic drugs, distinguishing periportal from pericentral lipid signatures at spatial resolution that histopathology alone cannot match. For comprehensive spatial profiling of drug-induced lipid changes across multiple classes, lipidomics pathway analysis integrates spatial MSI data with enzymatic pathway mapping to identify the upstream targets of lipid dysregulation.
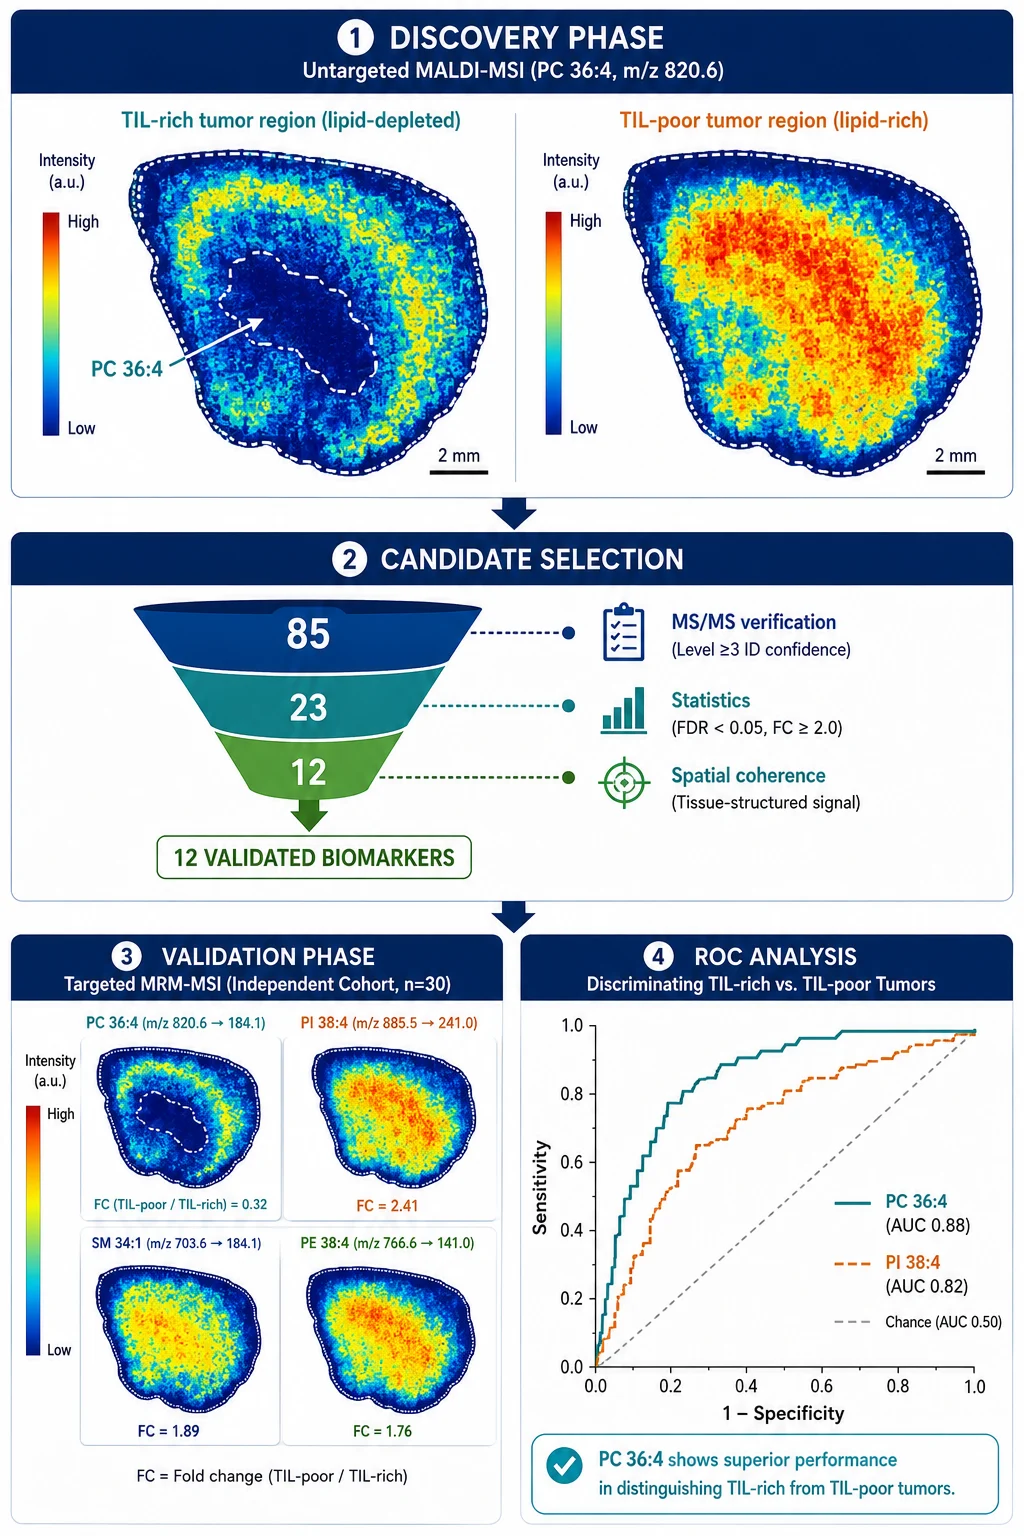 Figure 6: Application example — discovery-to-validation in cancer lipidomics: untargeted MALDI-MSI discovery ion images, candidate selection funnel, targeted MRM validation ion images on an independent cohort, and ROC curves for validated biomarkers.*
FAQ
Q: How many lipid candidates should I take from discovery to targeted validation?
Aim for 10–30 candidates after applying all four selection filters (ID confidence, statistics, spatial coherence, biological relevance). Panels larger than 30 lipids reduce spatial resolution or increase acquisition time to impractical levels; panels smaller than 5 risk missing biologically relevant biomarkers. The pipeline's filter cascade naturally narrows 100–200 differential features to 10–30 validated candidates.
Q: Can I do discovery and validation on the same tissue sections?
Discovery on adjacent sections is standard, but validation should use independent biological replicates. Using the same sections for both phases conflates discovery statistics with validation statistics and overestimates biomarker performance. The minimum design: discovery on n = 5 per group (Sections 1–5), validation on a separate cohort of n = 10–12 per group (Sections 6–17).
Q: Do I need a triple quadrupole for targeted spatial lipidomics?
A triple quadrupole (QqQ) in MRM mode provides the best sensitivity and dynamic range for targeted quantification, but a Q-Orbitrap in PRM mode is a viable alternative with the advantage of parallel high-resolution product ion collection. Q-TOF instruments in targeted MS/MS mode can also serve, though with lower quantitative precision than QqQ-MRM. The critical requirement is the ability to pre-select precursor ions and monitor specific fragment transitions — full-scan instruments are not suitable for targeted validation.
Q: How do I choose between MALDI-MRM and DESI-MRM for targeted validation?
MALDI-MRM for higher spatial resolution (20–50 μm) and direct platform continuity with discovery; DESI-MRM for higher throughput (no matrix) and larger cohorts. Cross-platform validation using both provides the strongest evidence.
Q: What is the minimum sample size for each phase?
Discovery: n ≥ 3 per group for pilot studies, n ≥ 5 for publication. Verification: can use the same samples as discovery with on-tissue MS/MS. Validation: n ≥ 8 per group, powered to detect fold change ≥ 2.0 with α = 0.05 and β = 0.2. Under-powered validation (n = 3–4) produces biomarkers that fail to replicate and is the most common preventable failure mode in the pipeline.
Summary
The untargeted-to-targeted spatial lipidomics pipeline converts a list of differential m/z features into a panel of spatially validated, quantifiable lipid biomarkers through three phases:
- Discovery (untargeted MALDI/DESI-MSI): Broad lipid detection (200–500 features), followed by peak picking, deisotoping, adduct deconvolution, and METASPACE-assisted annotation.
- Candidate selection: Filter by LSI identification confidence (Level ≥3), statistical significance (FDR<0.05, FC ≥2.0), spatial coherence (anatomically structured ion images), and biological relevance (mechanistic link to the disease process).
- Validation (targeted MRM/PRM): Lipid-class-specific transition panels with optimized collision energies, internal standard normalization per class, and cross-platform (or at minimum independent-cohort) confirmation.
The most common failure mode is under-powered validation — moving too few candidates (or too many) to expensive targeted MRM without rigorous statistical filtering. A well-designed pipeline narrows 100–200 discovery features to 10–30 validated candidates, of which 5–15 emerge as robust, replicable spatial biomarkers.
References:
- van der Vloet L, Mohren R, Bouillod C, et al. Application of a multiomics imaging workflow to explore Asparlas treatment in solid tumors integrating MALDI-MSI, LC-HRMS, and histopathological staining. Anal Chem. 2025;97(24):12736-12745. doi:10.1021/acs.analchem.5c01503
- Gu Y, et al. Nanoneedles enable spatiotemporal lipidomics of living tissues. Nat Nanotechnol. 2025;20:1262-1272. doi:10.1038/s41565-025-01955-8
- Leontyev D, Gier EC, Master VA, et al. A spatial metabolomics annotation workflow leveraging cyclic ion mobility and machine learning-predicted collision cross sections. J Am Soc Mass Spectrom. 2025. doi:10.1021/jasms.5c00090
- Pérez-Romero K, Huergo-Baños C, Maimó-Barceló A, et al. Advancing immune profiling in colon cancer through enhanced lipidomics of low-input samples. Clin Transl Med. 2025;15(7):e70399. doi:10.1002/ctm2.70399
- Lu KH, Zhang H, Yagnik GB, et al. Deciphering the three-dimensional biomolecular distribution in the Alzheimer's disease brain: A multiomic approach integrating immunohistochemistry with MALDI MS imaging. Anal Chim Acta. 2025;1379:344721. doi:10.1016/j.aca.2025.344721
- Maimó-Barceló A, Martín-Saiz L, Fernández JA, et al. A comprehensive review of lipid imaging mass spectrometry: Sample preparation to clinical translation. Prog Lipid Res. 2025;97:101319. doi:10.1016/j.plipres.2025.101319
- Liebisch G, Fahy E, Aoki J, et al. Update on LIPID MAPS classification, nomenclature, and shorthand notation for MS-derived lipid structures. J Lipid Res. 2020;61(12):1539-1555. doi:10.1194/jlr.S120001025
- Ni Z, Wölk M, Jukes G, et al. Guiding the choice of informatics software and tools for lipidomics research applications. Nat Methods. 2023;20(2):193-204. doi:10.1038/s41592-022-01710-0
- Alexandrov T. Spatial metabolomics and imaging mass spectrometry in the age of artificial intelligence. Annu Rev Biomed Data Sci. 2020;3:275-298. doi:10.1146/annurev-biodatasci-011420-031537
- Rappez L, Stadler M, Triana S, et al. SpaceM reveals metabolic states of single cells. Nat Methods. 2021;18:799-805. doi:10.1038/s41592-021-01198-0
The services described are for research use only. Not for use in diagnostic or therapeutic procedures.
















