

Introduction
A relative ion image tells you that PC 34:1 is "higher" in tumor than in stroma. It does not tell you whether the difference is 1.5-fold or 15-fold, whether the concentration crosses a known lipotoxicity threshold, or whether the same fold change would replicate on a different instrument. For research questions that demand answers beyond "lipid X is elevated in region Y" — drug-induced phospholipidosis grading, biomarker cutoff validation, cross-study meta-analysis — relative intensity is insufficient. Absolute quantification is required.
Quantitative spatial lipidomics — the measurement of lipid concentrations in tissue sections in units of pmol/mm² — bridges this gap, and is a core capability of modern MALDI-imaging lipidomics platforms. However, lipids present quantification challenges distinct from those encountered with drugs or proteins. Lipid class-specific ionization efficiencies differ by an order of magnitude. Adduct distributions vary with tissue type and matrix. Stable isotope-labeled (SIL) lipid standards are commercially available for only a fraction of the lipidome. And ion suppression differs systematically between gray matter and white matter, tumor and stroma.
This article provides a practical framework for selecting and implementing a quantitative strategy for spatial lipidomics, covering the four principal calibration approaches, normalization methods evaluated for lipid MSI data, platform-specific workflows, and reporting standards aligned with the Lipidomics Standards Initiative (LSI).
Why Quantify Lipids Spatially?
From Relative Ion Images to Absolute Concentration Maps
In a conventional untargeted MALDI-MSI experiment, each lipid species yields a grid of detector counts reflecting relative abundance across pixels. Ion intensity is not concentration: a two-fold difference in PC 34:1 signal between two tissue regions could reflect a two-fold difference in concentration, a five-fold difference, or no biological difference if matrix crystallization or salt content differs between the regions.
Absolute quantification replaces the arbitrary intensity scale with a concentration scale traceable to a known quantity of internal standard, most commonly reported as pmol/mm² — picomoles of lipid per square millimeter of tissue section [1]. This unit enables direct comparison between experiments, instruments, and laboratories, including cross-validation against gold-standard LC-MS/MS lipidomics from tissue extracts.
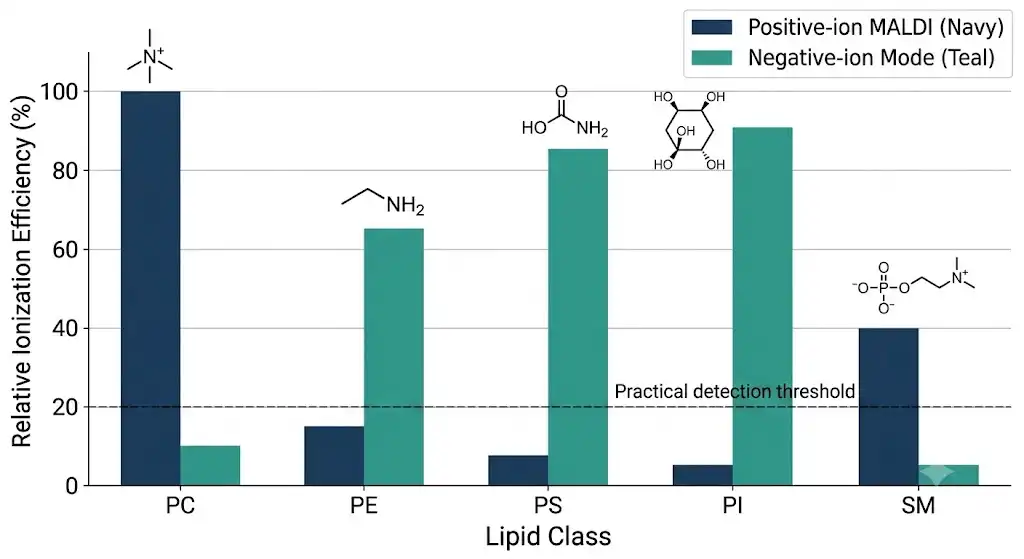 Figure 1. Lipid class-specific ionization efficiency comparison. Grouped bar chart comparing relative ionization efficiency (normalized to PC = 100%) for five major glycerophospholipid classes (PC, PE, PS, PI, SM) in positive-ion MALDI versus negative-ion mode, with molecular headgroup structures shown above each bar group.
Use Cases That Demand Absolute Quantification
Three research scenarios illustrate when relative quantification is insufficient and absolute numbers are required:
Drug-induced phospholipidosis (DIPL). Phospholipidosis — excessive phospholipid accumulation in lysosomes triggered by cationic amphiphilic drugs — requires quantitative thresholds in regulatory toxicology. A tissue phospholipid concentration exceeding 2,500 pmol/mg protein is considered indicative in liver [2]. Relative ion images cannot determine whether this threshold has been crossed.
Biomarker cutoff validation. A lipid identified as differentially abundant in a discovery cohort (n = 5 per group, relative intensity) must be validated with a concentration-based cutoff in an independent cohort. "Tumor regions with PC 36:4 > 8.5 pmol/mm² are classified as the lipid-elevated phenotype" is a testable, reproducible statement. "PC 36:4 intensity > 0.7" depends on instrument settings, matrix batch, and day-to-day variability.
Cross-study comparison. As spatial lipidomics data accumulate across laboratories, comparing results requires a common quantitative scale. Relative intensity values from different instruments cannot be meaningfully pooled; absolute concentrations can.
The Lipid Quantification Challenge
Quantifying lipids in tissue sections is harder than quantifying drugs or peptides by MSI. Four lipid-specific factors create quantification bias that must be explicitly addressed in experimental design.
Lipid Class-Specific Ionization Efficiency
In positive-ion MALDI, phosphatidylcholine (PC) species ionize with approximately 5-10 fold higher efficiency than phosphatidylethanolamine (PE) species at equimolar concentrations [3]. This reflects the intrinsic gas-phase basicity of the quaternary ammonium headgroup of PC, which outcompetes the primary amine of PE for available protons. Phosphatidylserine (PS) and phosphatidylinositol (PI) ionize even less efficiently in positive mode and are often detected primarily as sodium adducts.
The practical consequence: PC species dominate positive-ion spectra even when they are minor membrane constituents. PE and PS species, often the lipids of greatest biological interest in disease contexts, are systematically under-represented. Any quantitative strategy must correct for class-specific response — using class-matched internal standards, negative-ion mode for acidic phospholipids, or empirical response factors from standard curves. These corrections are integral to quantitative lipidomics workflows that span multiple glycerophospholipid and sphingolipid classes.
Adduct Distribution Variability
Lipids in MALDI-MSI form multiple adducts — [M+H]⁺, [M+Na]⁺, [M+K]⁺ in positive mode, [M-H]⁻, [M+Cl]⁻ in negative mode. Their relative proportions depend on local sodium and potassium concentrations, which vary with cell type, disease state, and tissue preparation. A sodium-rich extracellular pixel may show predominantly [M+Na]⁺ for PC 34:1 while an adjacent intracellular pixel shows [M+H]⁺. Summing all adducts accounts for this variability; relying on a single adduct peak introduces a tissue-region-dependent bias. The LipidQMap platform addresses this with a sodiated-to-protonated adduct ratio correction [1].
The Internal Standard Bottleneck
The gold standard for quantitative mass spectrometry — stable isotope dilution using a labeled analog of each analyte — is not achievable for spatial lipidomics at scale. Fewer than 50 deuterated or odd-chain lipid standards are commercially available for the hundreds of lipid species detected in a typical MALDI-MSI experiment. The SPLASH LIPIDOMIX panel (Avanti Polar Lipids) provides deuterated standards for approximately 14 lipid classes, but within each class, only one or two fatty acyl compositions are represented. A single PC standard thus serves as the reference for all PC species from PC 30:0 to PC 44:12, despite known ionization efficiency differences related to acyl chain length and unsaturation [4].
This bottleneck forces a pragmatic compromise: one standard per lipid class, accepting that within-class response variation (±20-30% depending on chain length differences) is an acknowledged source of uncertainty in exchange for lipidome-wide quantification. Laboratories implementing targeted lipidomics panels navigate this trade-off by prioritizing standards for the lipid classes most central to their biological hypothesis.
Tissue-Dependent Ion Suppression
Ion suppression in MALDI-MSI is not uniform across a tissue section. Gray matter and white matter in brain tissue produce different suppression environments due to differences in lipid content, salt concentration, and water content. Tumor regions with high cell density suppress ionization differently than adjacent stroma with high extracellular matrix content. Necrotic cores, which lose membrane integrity and release free fatty acids and lysophospholipids, create yet another suppression environment.
The standard approach to managing spatially variable ion suppression is pixel-wise normalization to a co-deposited internal standard. If the internal standard and the endogenous lipid experience the same suppression at each pixel, their ratio is suppression-independent. This assumption holds reasonably well for within-class standard-analyte pairs but degrades when a single standard (e.g., PC 15:0-18:1(d7)) is used to correct for suppression of a lipid from a different class [5].
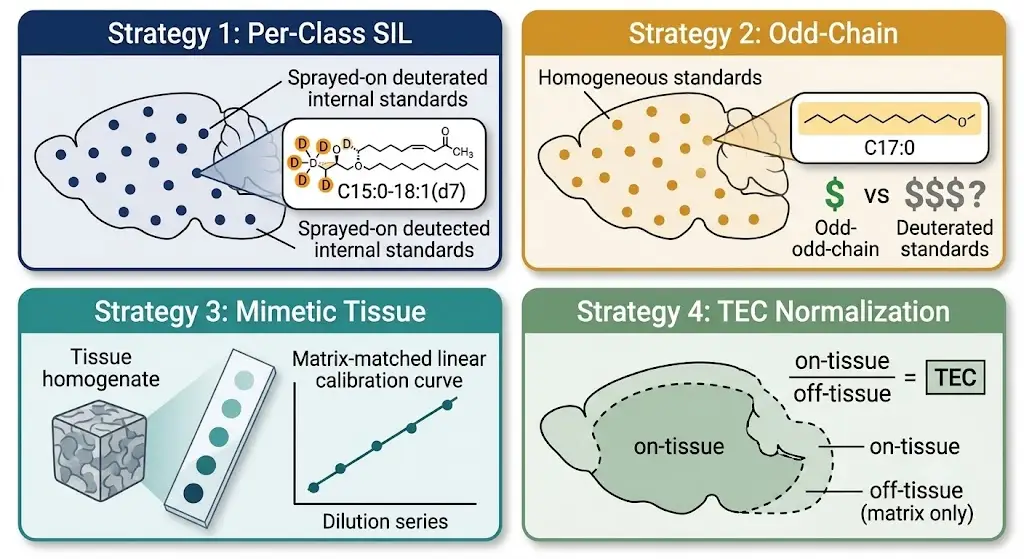 Figure 2. Four calibration strategies for quantitative spatial lipidomics. Side-by-side visual comparison of the four principal calibration approaches, each shown as a stylized tissue section with the calibration element (internal standard, odd-chain lipid, mimetic homogenate spots, or TEC reference) highlighted.
Calibration Strategies for Quantitative Spatial Lipidomics
Four calibration strategies are available for lipid qMSI, ranging from the simplest (one internal standard per class) to the most matrix-representative (mimetic tissue models). The choice depends on three factors: which lipid classes are being quantified, which standards are commercially available, and what level of accuracy the biological question demands.
Strategy 1: Per-Class Single Internal Standard
A single deuterated or odd-chain lipid standard is selected for each lipid class of interest and deposited homogeneously onto the tissue section — typically by pneumatic spray (e.g., TM-Sprayer, SunCollect) before matrix application. Quantification is performed by dividing the intensity of each endogenous lipid species by the intensity of its class-matched internal standard at each pixel, then multiplying by the known amount of standard deposited per unit area.
This is the most widely used approach in published qMSI lipidomics studies and the method implemented in the LipidQMap software [1], and it underlies the per-class normalization strategy used in routine MALDI-imaging lipidomics services. It requires the least amount of standard material and the simplest data processing. Its primary limitation is the within-class response variation: PC 30:0 and PC 44:12, normalized to the same PC 15:0-18:1(d7) standard, may have true concentrations that differ by ±30% from the reported value due to acyl chain-dependent ionization efficiency differences.
Strategy 2: Odd-Chain Lipid Standards
Odd-chain fatty acids (C15:0, C17:0, C19:0, C25:0) are essentially absent from mammalian tissues, making odd-chain lipid standards a practical alternative to deuterated standards. The Avanti Odd-Chained LIPIDOMIX provides 16 lipid standards built on C17:0 or C17:1 fatty acyl chains, covering PC, PE, PS, PG, PA, PI, Lyso PC/PE, DAG, TAG, and SM classes.
Odd-chain standards offer two practical advantages. First, they are 4-8 fold less expensive than their deuterated counterparts. Second, they avoid the deuterium isotope effect that can cause small retention time shifts in LC-MS workflows — less relevant for MSI but beneficial when MSI quantification is cross-validated against LC-MS/MS. Hofmann and Schmidt demonstrated that odd-chain lipid standards produce calibration curves statistically indistinguishable from deuterated standards for phosphatidylglycerol quantification by nano-ESI shotgun lipidomics [6].
Strategy 3: Mimetic Tissue Homogenates
The mimetic tissue model, first described by Groseclose and Castellino [7], addresses the matrix effect problem directly: a control tissue homogenate is spiked with known concentrations of the target lipid standards, creating a matrix-matched calibration series. This homogenate is then sectioned, mounted alongside the experimental tissue, and analyzed under identical conditions. The resulting calibration curve accounts for the same ion suppression environment that the experimental tissue experiences.
For lipid quantification, the mimetic tissue approach is particularly valuable when the target lipid classes are poorly represented in commercial standard panels — for example, sulfatides, gangliosides, or oxidized phospholipids. It is also the method of choice when the biological question demands the highest possible accuracy (e.g., regulatory toxicology). The trade-off is labor: preparing a homogenate calibration series, validating its homogeneity, and sectioning it alongside every experimental batch adds 1-2 days to the workflow. For research programs requiring specialized lipid quantification beyond standard panels, customized lipidomics services can implement mimetic tissue calibration for non-standard lipid classes.
Strategy 4: Per-Pixel Tissue Extinction Coefficient (TEC) Normalization
TEC normalization, originally developed for quantitative drug imaging [8], has been adapted for lipid quantification. The principle: the signal attenuation caused by tissue matrix is estimated at each pixel by comparing the signal of a pre-deposited internal standard on-tissue versus off-tissue (on the surrounding slide). The ratio — the tissue extinction coefficient — is used to correct the endogenous lipid signal at that pixel.
For lipids, TEC adapted normalization faces an additional complication: lipid internal standards partition into the tissue lipidome rather than remaining as a discrete surface layer, as drug standards do. This can be exploited (partitioning mimics the behavior of endogenous lipids) but also complicates the on-tissue/off-tissue comparison. Recent work by Moore et al. (2024) on nano-DESI QqQ quantification of drugs in mimetic tissue models provides a methodological framework that is beginning to be extended to lipids [9].
Decision Framework
The choice of calibration strategy should be guided by the lipid classes under investigation, the standards available, and the required accuracy:
| Factor | Strategy 1 (Per-Class SIL) | Strategy 2 (Odd-Chain) | Strategy 3 (Mimetic Tissue) | Strategy 4 (TEC) |
|---|---|---|---|---|
| PC, SM quantification | Excellent | Excellent | Excellent | Good |
| PE, PS, PI quantification | Good (neg mode) | Good | Excellent | Moderate |
| Low-abundance lipids | Moderate | Good | Excellent | Limited |
| Accuracy requirement | ±30% | ±30% | ±15% | ±25% |
| Labor and time | Low | Low | High | Moderate |
| Standard availability | Limited | Moderate | Not required | Not required |
| Best for | Broad lipidome surveys | Cost-constrained studies | Highest accuracy | Heterogeneous tissues |
For most spatial lipidomics workflows, Strategy 1 or 2 provides sufficient accuracy for candidate prioritization and biological interpretation. Strategy 3 is reserved for definitive findings or regulatory cutoff determination.
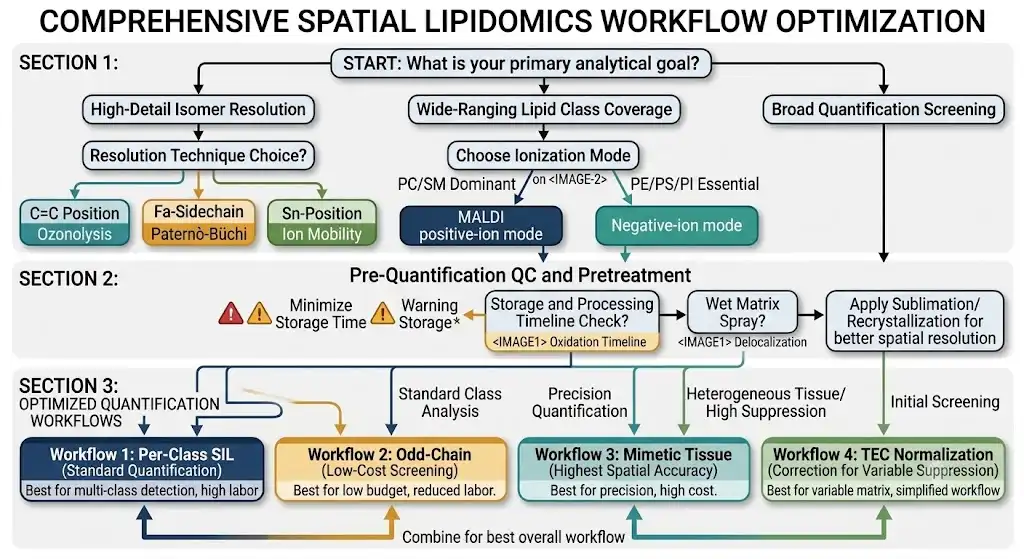 Figure 3. Decision flowchart for calibration strategy selection. A branching decision tree starting from the researcher's primary lipid class and accuracy requirement, leading to the recommended calibration strategy (1–4) with a compact reference table comparing strategies by use case, labor, and accuracy.
Normalization Strategies for Lipid MSI Data
Normalization — the mathematical correction applied after calibration — determines how lipid signals are scaled across pixels and samples. The choice of normalization method can change biological conclusions, particularly when lipid classes change in opposite directions.
Total Ion Current (TIC) Normalization
TIC normalization divides each pixel's signal by the sum of all detected signals in that pixel. It is the default in most MSI software and is adequate when the biological effect is large and affects all lipid classes proportionally. However, TIC normalization has a documented failure mode in lipid MSI: when one lipid class increases while another decreases, TIC normalization distributes the change across all lipids, attenuating both effects. Vandenbosch et al. demonstrated that TIC normalization masked biologically relevant spatial gradients in brain lipid distributions clearly visible with class-specific internal standard normalization [5].
Per-Class Normalization
Per-class normalization treats each lipid class as an independent dataset, normalizing within-class signals to a class-specific factor (the class-specific IS intensity or class total ion current). This preserves class-specific biological variation — if PC species genuinely increase 3-fold while PE species decrease 2-fold, per-class normalization preserves both changes. The limitation is it cannot reveal shifts in relative abundance between classes, since each class is normalized independently.
Internal Standard-Based Normalization
Pixel-wise normalization to a co-deposited internal standard is the most robust method when the IS is well-matched to the target lipid class. The ratio (endogenous lipid / IS) at each pixel is independent of matrix effects, laser power fluctuations, and detector sensitivity drift. This normalization is embedded in the LipidQMap one-point calibration workflow [1], where the IS-normalized intensity is converted to pmol/mm² using the known IS deposition density. Proper implementation requires careful bioinformatic data preprocessing and normalization to ensure that IS signal extraction, adduct deconvolution, and pixel-wise ratio calculation are performed consistently across the entire tissue section.
Reference Tissue Normalization
For multi-sample studies, a reference tissue section — typically a control or pooled homogenate section — is included in each analytical batch. Sample values are normalized to the reference by ratio to a stable endogenous lipid or by median-centering each lipid species across samples. This approach originated in LC-MS lipidomics [10] and has been adopted by qMSI workflows emphasizing cross-sample comparability.
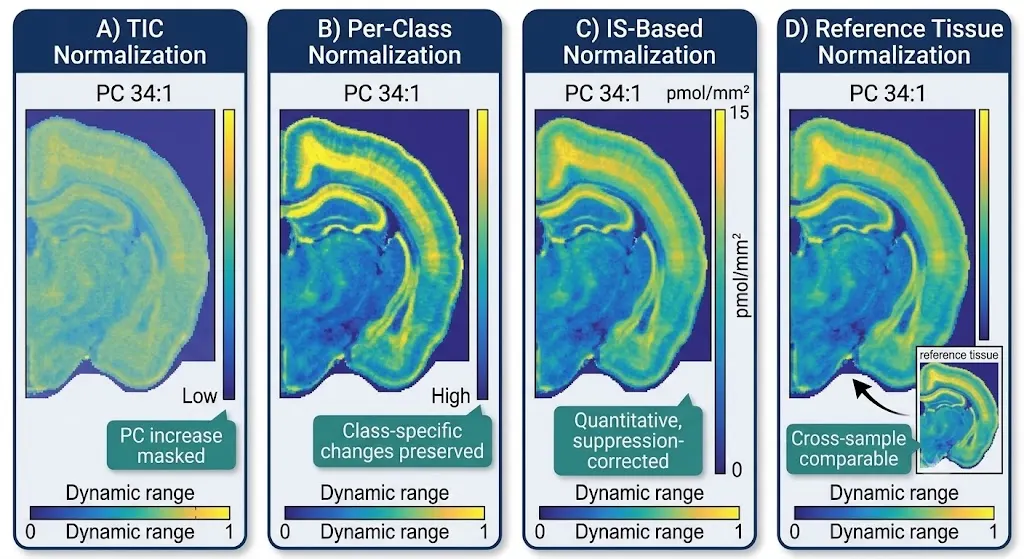 Figure 4. Normalization methods comparison for lipid MSI data. Four panels showing the same representative ion image (PC 34:1 in mouse brain coronal section) processed with TIC normalization (A), per-class normalization (B), IS-based normalization (C), and reference tissue normalization (D), with annotated dynamic range bars and spatial feature callouts for each method.
Lipid Quantification Workflows by Platform
MALDI-MSI
MALDI is the dominant platform for spatial lipidomics and the one for which quantitative workflows are most mature. The standard qMSI-MALDI workflow: (1) tissue sectioning on ITO slides, (2) internal standard deposition by pneumatic spray, (3) matrix deposition (DHB positive mode, 9-AA or DAN negative mode), (4) MSI acquisition at 20-50 µm, (5) data conversion to imzML, (6) processing in LipidQMap for IS normalization and pmol/mm² conversion.
Key QC checkpoints: verify IS deposition homogeneity (pixel-wise IS CV < 25%), confirm absence of IS-specific matrix adducts, and cross-validate a subset of quantified lipids against LC-MS/MS of an adjacent tissue extract. Our MALDI-MSI spatial lipidomics guide covers the MALDI workflow in greater technical detail.
DESI-MRM
DESI coupled to a triple quadrupole enables quantitative targeted lipid imaging without matrix application. The spray solvent (methanol:water 95:5) extracts lipids from the tissue surface in real time, and the QqQ monitors pre-selected MRM transitions for each target lipid. The sample remains intact for subsequent H&E staining.
Quantitative DESI-MRM uses external calibration: a dilution series of lipid standards spotted on a control slide and imaged under identical conditions converts MRM peak area to concentration. Moore et al. (2024) demonstrated this for drugs in mimetic tissue with nano-DESI-QqQ, achieving LODs below 1 ng/mL [9]. Extension to lipid panels requires class-optimized MRM transitions — m/z 184→184 for PC/SM (phosphocholine headgroup) or neutral loss of 141 Da for PE species — a key design consideration in targeted lipidomics assay development. For MRM panel design for lipids, see our untargeted-to-targeted spatial lipidomics guide.
IR-MALDESI
Infrared matrix-assisted laser desorption electrospray ionization (IR-MALDESI) uses a mid-IR laser to desorb lipids from frozen tissue into an electrospray plume. Endogenous water in the frozen tissue acts as the matrix, eliminating matrix-related ion suppression heterogeneity — a distinct advantage for quantification. Quantitative IR-MALDESI lipid imaging has been demonstrated using both external standard curves and on-tissue internal standard spraying [11]. Though less widely available than MALDI or DESI, it offers matrix-free quantification well-suited to lipid analysis.
Reporting Standards for Quantitative Lipid MSI
Quantitative spatial lipidomics data are only as useful as they are reproducible. The Lipidomics Standards Initiative (LSI) has published guidelines for quantitative lipidomics reporting directly applicable to MSI [12]. Minimum reporting items for a quantitative lipid MSI experiment include:
Minimum Reporting Items for a Quantitative Lipid MSI Experiment
- For each quantified lipid species: limit of detection (LOD), limit of quantification (LOQ), and linear dynamic range, determined from the calibration strategy employed
- Calibration method (Strategy 1-4 as described above), including the identity and deposited amount of each internal standard
- Normalization method applied (TIC, per-class, IS-based, reference tissue), with justification
- Spatial resolution and the number of pixels used for quantification per ROI
- Cross-validation method, if any (e.g., LC-MS/MS of tissue extract from adjacent section)
- Data processing software and version, including any custom parameters
LSI confidence levels for lipid identification remain applicable in quantitative MSI: a lipid quantified at Level 2 (sum composition confirmed by MS/MS) should be reported with this annotation, and quantitative values for Level 3 (lipid class + total carbons:double bonds) or Level 4 (accurate mass only) identifications should be treated as provisional.
Adopting these reporting standards ensures that quantitative lipid MSI data can be compared across laboratories, incorporated into lipidomics data repositories, and used as input for systems biology models that depend on absolute concentration values. For research programs requiring end-to-end support, comprehensive lipidomics services that integrate quantitative MSI with LC-MS/MS validation and LSI-compliant reporting can accelerate the transition from relative imaging to absolute quantification. For the broader methodological context of MSI experiment design, see our spatial metabolomics technology guide.
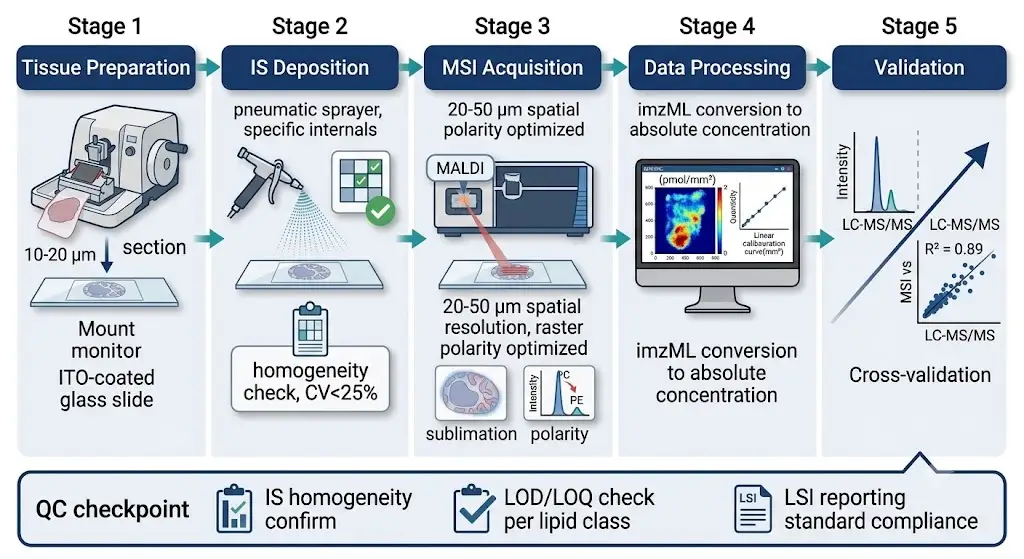 Figure 5. Quantitative spatial lipidomics workflow. Horizontal five-stage pipeline from tissue section preparation through IS deposition, MSI acquisition, data processing in LipidQMap, to final pmol/mm² concentration output, with cross-validation by LC-MS/MS and QC checkpoints at each stage.
FAQ
Q: Can I quantify lipids from an existing untargeted MALDI-MSI dataset that was acquired without internal standards?
Not absolutely. Without a co-deposited internal standard, you can perform relative quantification (fold changes, normalized intensities) but cannot convert to concentration units (pmol/mm²). You can, however, re-analyze an adjacent tissue section from the same sample block with internal standards applied and cross-reference the relative patterns.
Q: How many internal standards do I really need for quantitative lipid MSI?
At minimum, one standard per lipid class you intend to quantify. For broad lipidome coverage (10+ classes), the SPLASH LIPIDOMIX or Odd-Chained LIPIDOMIX panels (14-16 standards) are practical starting points. If your biological question focuses on a single class (e.g., PC only), one well-matched standard is sufficient.
Q: What spatial resolution is compatible with quantitative lipid MSI?
At 20-50 µm, internal standard signal per pixel is typically sufficient for reliable quantification (CV < 25%). At 5-10 µm — the resolution achievable with MALDI-2 and transmission-mode MALDI — per-pixel IS signal drops substantially, and spatial binning (combining adjacent pixels) may be necessary to maintain quantification quality. The SMASH imaging approach (Uchino et al., 2026) demonstrated quantitative lipid detection at 5 µm but required signal averaging across multiple serial sections.
Q: How do I validate that my quantitative MSI values are correct?
The accepted cross-validation method is to extract lipids from an adjacent tissue section (or from laser capture microdissected ROIs matched to the MSI image), quantify the same lipids by LC-MS/MS using established LIPID MAPS protocols, and compare the MSI-derived concentrations to the LC-MS/MS gold standard. Concordance within ±30% is considered good agreement for most lipid classes [5].
Q: Can I use the same calibration curve across multiple tissue sections in a batch?
Partially. A calibration curve from standard spots on a control slide can be applied across sections within the same analytical batch if instrumental conditions remain stable. However, matrix deposition and internal standard spray homogeneity vary between slides. Best practice is to include at least one QC tissue section with internal standards per batch and monitor IS signal stability. If IS signal CV exceeds 25% between sections, apply a per-section correction factor derived from the IS signal.
Summary
Quantitative spatial lipidomics transforms MSI from a discovery tool that answers "where is this lipid?" into a measurement platform that answers "how much lipid is in this tissue compartment, and is the concentration biologically meaningful?" The path from relative ion images to absolute concentration maps requires deliberate choices at three decision points: calibration strategy, normalization method, and reporting standard — driven by the specific lipid classes, the accuracy requirements of the biological question, and standard availability. Creative Proteomics has validated these quantitative strategies across multiple lipid classes in brain, liver, and tumor tissue sections, with cross-validation against LC-MS/MS achieving concordance within ±25% for major glycerophospholipid classes.
Creative Proteomics provides quantitative spatial lipidomics services spanning the complete workflow described in this article, from internal standard selection and deposition through MSI acquisition, LipidQMap-based data processing, and cross-validation by LC-MS/MS. Our lipidomics team can assist with experimental design, calibration strategy selection, and quantitative interpretation for spatially resolved lipid biomarker studies.
This service is for research use only and is not intended for clinical diagnostic purposes.
References:
- Dehairs J, Idkowiak J, Ravoet C, et al. LipidQMap — An open-source tool for quantitative mass spectrometry imaging of lipids. bioRxiv. 2025. doi:10.1101/2025.10.15.682422
- Reasor MJ, Hastings KL, Ulrich RG. Drug-induced phospholipidosis: issues and future directions. Expert Opin Drug Saf. 2006;5(4):567-583. doi:10.1517/14740338.5.4.567
- Taylor AJ, Dexter A, Bunch J. Exploring ion suppression in mass spectrometry imaging of a heterogeneous tissue. Anal Chem. 2018;90(9):5637-5645. doi:10.1021/acs.analchem.7b05005
- Wang M, Wang C, Han X. Selection of internal standards for accurate quantification of complex lipid species in biological extracts by electrospray ionization mass spectrometry — what, how and why? Mass Spectrom Rev. 2017;36(6):693-714. doi:10.1002/mas.21492
- Vandenbosch M, Ellis SR, Ekroos K, et al. Toward omics-scale quantitative mass spectrometry imaging of lipids in brain tissue using a multiclass internal standard mixture. Anal Chem. 2023;95(51):18719-18730. doi:10.1021/acs.analchem.3c02724
- Hofmann T, Schmidt C. Instrument response of phosphatidylglycerol lipids with varying fatty acyl chain length in nano-ESI shotgun experiments. Chem Phys Lipids. 2019;223:104782. doi:10.1016/j.chemphyslip.2019.05.007
- Groseclose MR, Castellino S. A mimetic tissue model for the quantification of drug distributions by MALDI imaging mass spectrometry. Anal Chem. 2013;85(21):10099-10106. doi:10.1021/ac400892z
- Hamm G, Bonnel D, Legouffe R, et al. Quantitative mass spectrometry imaging of propranolol and olanzapine using tissue extinction calculation as normalization factor. J Proteomics. 2012;75(16):4952-4961. doi:10.1016/j.jprot.2012.07.035
- Moore AM, Bowman A, Wali SN, et al. Quantitative analysis of drugs in a mimetic tissue model using nano-DESI on a triple quadrupole mass spectrometer. J Am Soc Mass Spectrom. 2024;35(12):3170-3177. doi:10.1021/jasms.4c00345
- Liebisch G, Fahy E, Aoki J, et al. Update on LIPID MAPS classification, nomenclature, and shorthand notation for MS-derived lipid structures. J Lipid Res. 2020;61(12):1539-1555. doi:10.1194/jlr.S120001025
- Bagley MC, Garrard KP, Muddiman DC. Recent advances in IR-MALDESI: improvements in spatial resolution, sensitivity, and quantitative capabilities. J Mass Spectrom. 2023;58(5):e4918. doi:10.1002/jms.4918
- Liebisch G, Ahrends R, Arita M, et al. Lipidomics needs more standardization. Nat Rev Mol Cell Biol. 2022;23:779-780. doi:10.1038/s41580-022-00597-1















