

* This App Note addresses a gap in the spatial lipidomics literature: while many resources describe individual MSI techniques, few provide practical guidance on designing statistically rigorous multi-group comparative studies. It offers a methodological framework for researchers planning comparative spatial lipidomics experiments — covering experimental design fundamentals, normalization and batch correction strategies, statistical methods for spatial multi-group comparisons, and software tool selection.
The Challenge of Multi-Group Spatial Lipidomics
Comparative spatial lipidomics — the systematic comparison of lipid distributions across multiple biological conditions, time points, or tissue regions — represents one of the most powerful yet methodologically demanding applications of mass spectrometry imaging (MSI). Unlike bulk lipidomics, where sample handling and data analysis workflows are reasonably mature, spatial lipidomics introduces unique statistical challenges: each tissue section generates millions of spatially correlated data points, batch effects operate simultaneously across pixels, sections, slides, and acquisition days, and conventional statistical assumptions of independent observations are routinely violated by spatial autocorrelation. For researchers entering this field, a foundational understanding of spatial metabolomics by mass spectrometry imaging provides the broader technology context within which comparative lipidomics studies are designed.
The stakes are high. Poor experimental design in comparative MSI manifests in ways that bulk lipidomics practitioners may not anticipate: a statistically significant difference between disease and control groups can arise from a batch effect introduced by two slides processed on different days rather than from true biological variation. A PLS-DA model with apparently excellent cross-validated accuracy (Q2 > 0.8) can collapse when tested on an independent section because pixel-level cross-validation fails to account for spatial autocorrelation — the "replicate trap" that has been recognized as a fundamental pitfall in MSI classification studies (Balluff et al., 2021).
This App Note provides a practical framework for designing, executing, and analyzing comparative spatial lipidomics studies. It assumes familiarity with MALDI mass spectrometry imaging workflows and focuses on the methodological decisions that determine whether a comparative study yields reproducible biological insight or statistically confounded artifacts.
Experimental Design Fundamentals for Comparative MSI
The Five-Level Batch Effect Framework
Balluff et al. (2021) articulated a framework that should be the starting point for any multi-group MSI study design. Batch effects in MALDI-MSI operate at five distinct levels, and each demands specific design countermeasures:
- Pixel level. Spatial-dependent ion suppression, matrix coating inhomogeneities, detector sensitivity drift, and tissue topography differences create correlated noise within individual tissue sections. Mitigation: pixel-wise normalization using class-specific internal standards rather than TIC alone.
- Section level. Individual tissue sections experience unique artifacts from cutting order, mounting orientation, and storage duration. Mitigation: randomize section allocation across experimental groups — never process all sections from Group A before Group B.
- Slide level. All sections on a single slide share the same matrix application and MS acquisition run. Mitigation: distribute sections from each experimental group across multiple slides; include at least one QC section per slide.
- Time level. Day-to-day variation in instrument performance, environmental conditions, and reagent freshness. Mitigation: block experimental designs so that each acquisition day includes sections from all comparison groups.
- Location level. Inter-laboratory variation when multi-site studies are involved. Mitigation: standardize protocols across sites; include identical reference tissue sections at each site.
Randomization, Blocking, and Replication
The core principles of experimental design — randomization, blocking, and replication — apply to MSI with specific operational considerations. For researchers implementing these designs in lipid-focused studies, MALDI imaging lipidomics services provide the acquisition infrastructure for well-controlled comparative experiments.
Randomization. Tissue sections from different experimental groups must be randomly assigned to slides and acquisition order, not processed in group blocks. If all control sections are cut, mounted, and sprayed with matrix on Monday and all treatment sections on Tuesday, any observed group difference is confounded with the day effect. Practical randomization can be achieved by assigning each section a random number and ordering slide preparation accordingly. Many groups now use randomized complete block designs where each "block" (an acquisition day or slide) contains at least one section from every experimental condition.
Blocking. Known sources of technical variation — acquisition day, slide, instrument operator — should be incorporated as blocking factors rather than ignored. A blocked design where each acquisition day includes sections from all groups, analyzed in randomized order, allows the day-to-day variation to be statistically partitioned from the biological effect of interest. This is particularly important for large cohort studies where data collection spans weeks to months.
Biological replication. The fundamental question is: what is the experimental unit? In MSI, individual pixels are not independent replicates — they are spatially correlated subsamples of a single tissue section. The biological replicate is the independent tissue sample (from different animals, patients, or cell cultures). A study with three animals per group and one tissue section per animal has n = 3 biological replicates, regardless of how many millions of pixels are acquired. Statistical inferences must be drawn at the level of the biological replicate, not the pixel. Lukowski et al. (2020) demonstrated that even within a single tissue section, storage conditions — particularly whether sections are stored at room temperature, at −80 °C, or under nitrogen atmosphere — dramatically affect lipid stability and reproducibility, with nitrogen-atmosphere storage at −80 °C best preserving the lipid profile relative to freshly cut sections.
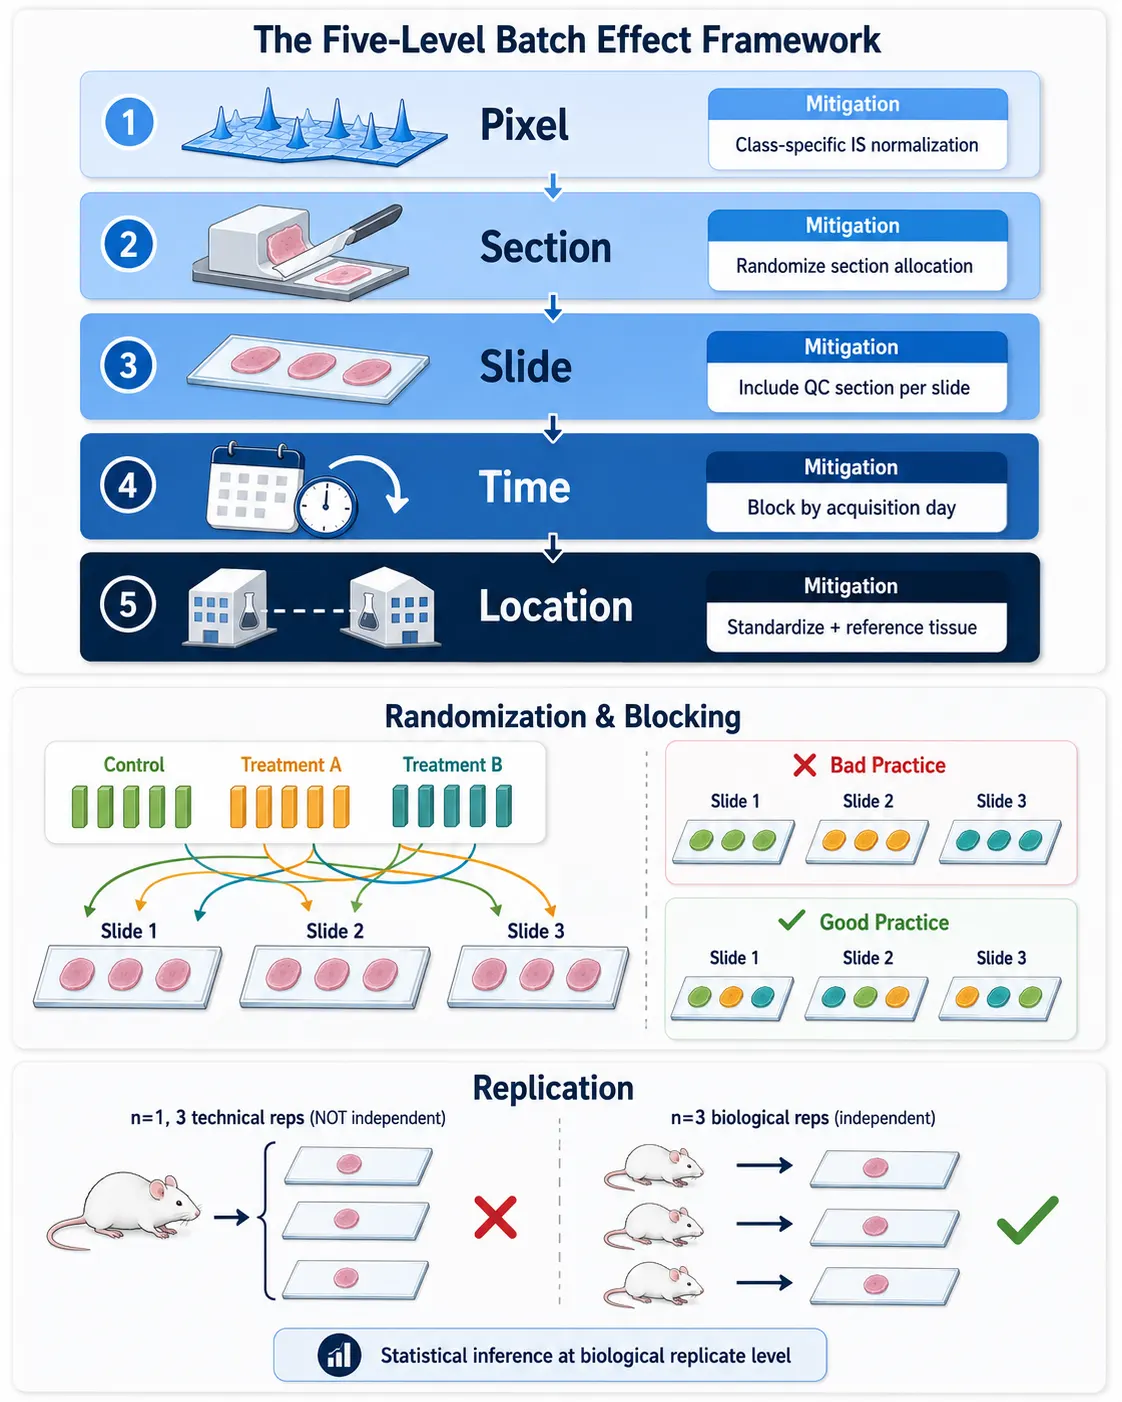 Figure 1: Experimental design framework for comparative spatial lipidomics — the five-level batch effect hierarchy, randomization and blocking strategies, and minimum replication requirements.*
Sample Size Considerations
Determining adequate sample sizes for MSI studies is complicated by the absence of standardized power analysis tools adapted to spatial data. Guidance from metabolomics and lipidomics best practices suggests that pilot data from 3-5 biological replicates per group can inform formal power calculations. For discovery-phase comparative studies, a minimum of 5-6 biological replicates per group is increasingly regarded as the threshold for reproducible biomarker identification, with verification and validation phases requiring independent cohorts of 20-30 or more samples. When effect sizes are unknown, the rule of thumb is conservative: if you cannot detect a difference with n = 5 per group, the effect is likely too small to be biologically meaningful or too variable to be analytically reproducible in a spatial context. For studies integrating untargeted lipidomics with spatial imaging, coordinating sample allocation across LC-MS and MSI pipelines from the same tissue specimens maximizes biological insight from limited material.
Data Normalization and Batch Correction Strategies
From TIC to Multi-Class Internal Standards
Normalization in spatial lipidomics has evolved through three generations of approaches:
First generation — Global scaling. Total ion current (TIC) normalization divides each pixel's intensity by the sum of all detected peaks. While computationally trivial, TIC normalization is vulnerable to a fundamental limitation: if a highly abundant lipid species changes dramatically between conditions, TIC normalization compresses or inflates all other signals in proportion, creating spurious differences. Root-mean-square (RMS) normalization and median scaling share similar vulnerabilities. These methods are adequate for exploratory visualization but insufficient for quantitative comparisons.
Second generation — Single or limited internal standards. Spraying one or two isotope-labeled lipid standards onto tissue before MSI provides anchors for normalization. However, a single PC standard cannot correct for the distinct ionization behavior of sulfatides, ceramides, or cardiolipins — lipid classes that span orders of magnitude in ionization efficiency within the same tissue pixel.
Third generation — Multi-class internal standard mixtures. Vandenbosch et al. (2023) introduced the "MSI SPLASH" approach: a 13-class internal standard mixture containing stable isotope-labeled or odd-chain, non-endogenous representatives of PA, PE, PG, PI, PS, LPE, sulfatide, lactosylceramide, ceramide, glucosylceramide, SM, LPC, and PC. By applying pixel-wise normalization to the class-specific internal standard, this method corrects for class-dependent ionization efficiencies and regional matrix effects across the tissue. Lipid concentrations are reported in pmol/mm2 across approximately three orders of magnitude of dynamic range. For researchers pursuing quantitative comparisons across groups, this class-specific normalization approach is the current gold standard and the foundation upon which quantitative spatial lipidomics builds absolute quantification workflows.
Computational Batch Correction Methods
Even with optimal experimental design and internal standard normalization, residual batch effects persist in multi-day, multi-slide studies. Huang et al. (2025) provided the first systematic evaluation of batch correction algorithms specifically adapted to MALDI-MSI data, using a tissue-mimicking quality control standard (QCS) composed of propranolol in gelatin:
- ComBat (from the sva R package). An empirical Bayes method originally developed for microarray data that adjusts for location and scale differences across batches. ComBat performed well on MALDI-MSI data, significantly reducing QCS coefficient of variation and improving sample clustering in PCA space.
- WaveICA. Combines wavelet transform decomposition with independent component analysis to separate biological signal from batch-related variation in the frequency domain. Particularly effective when batch effects manifest at specific spatial frequencies.
- NormAE. A deep neural network autoencoder with adversarial training that learns nonlinear batch effect representations. While powerful, NormAE requires substantial training data and careful regularization to avoid removing biological signal alongside technical noise.
The open-source QCS pipeline from Huang et al. enables researchers to evaluate which correction method is most appropriate for their specific dataset. For routine comparative studies, ComBat remains the pragmatic first choice — it is well-characterized, computationally efficient, and effective for the location-scale batch shifts most commonly encountered in MALDI-MSI. When batch-corrected relative quantification needs to be converted to absolute concentrations for cross-study comparisons, quantitative lipidomics by LC-MS/MS provides the necessary calibration framework.
Intra- and Inter-Sample Drift Correction
Stevens et al. (2025) addressed a subtler normalization challenge: systematic signal drift both within individual tissue sections (intra-sample) and across multiple biological replicates (inter-sample). Their RegioMSI R package implements sparse LOESS normalization — a locally estimated scatterplot smoothing approach that corrects drift without overfitting — enabling robust comparison of lipid abundances across six biological replicates per group with sex and regional stratification. This level of normalization rigor is essential for detecting the interactions (treatment × sex × anatomical region) that define biologically nuanced comparative studies.
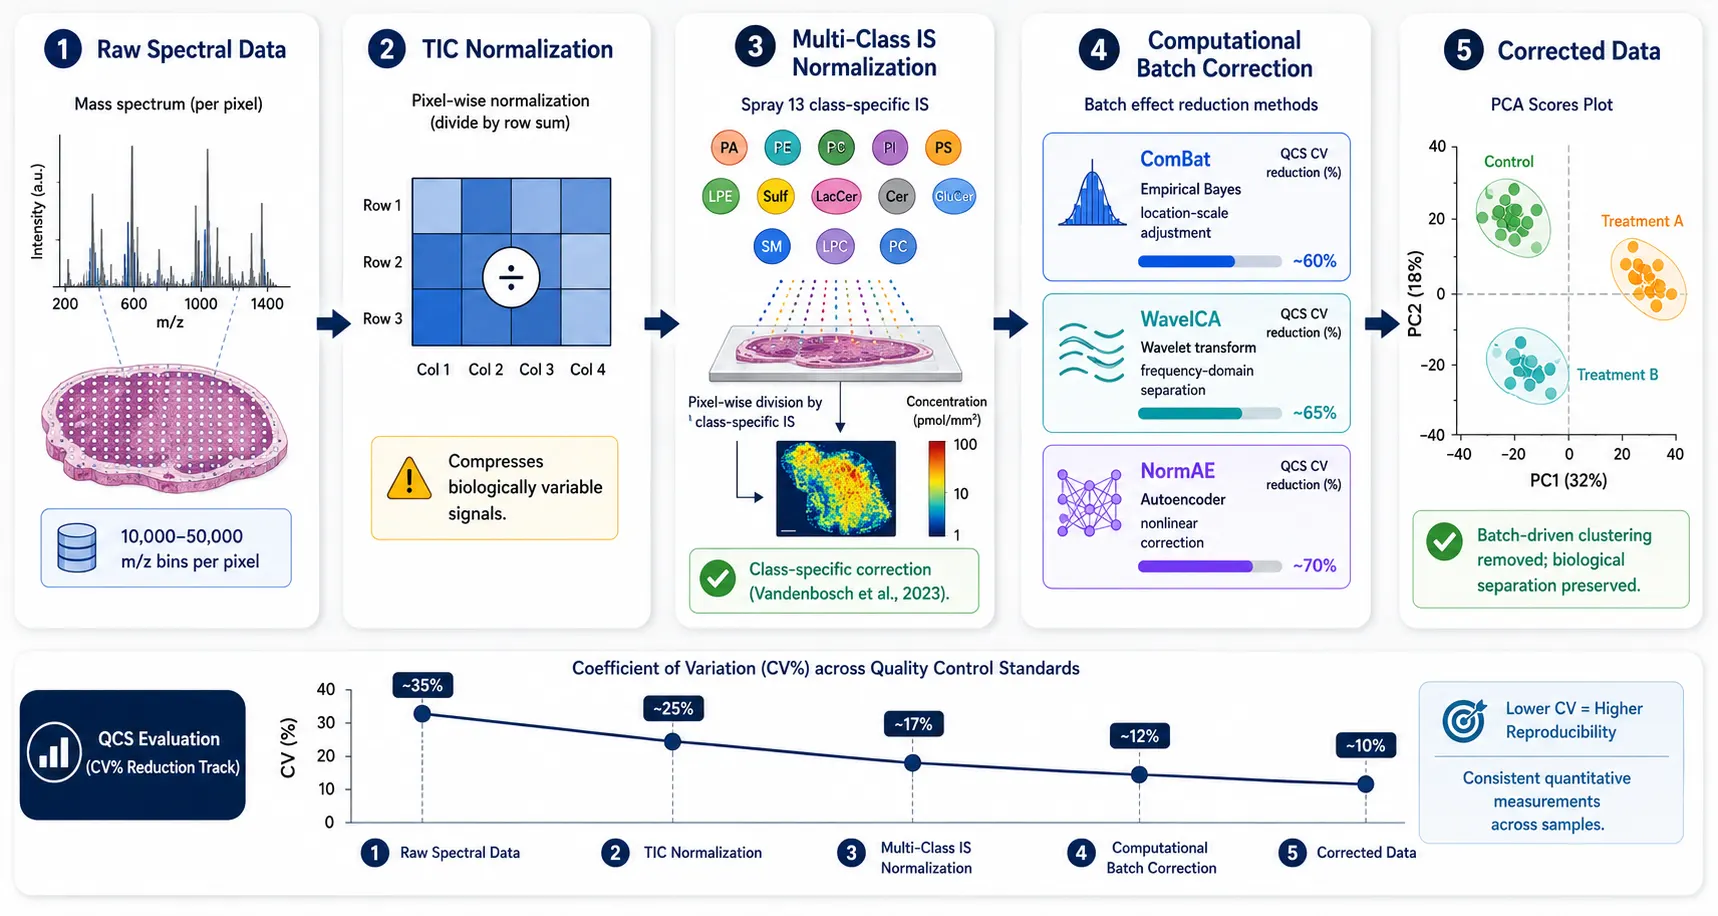 Figure 2: Normalization and batch correction workflow — from raw spectral data through TIC normalization, multi-class internal standard normalization, and computational batch correction methods (ComBat, WaveICA, NormAE), with QCS-based evaluation metrics at each stage.*
Statistical Methods for Spatial Multi-Group Comparisons
Univariate Approaches and Multiple Testing
For two-group comparisons, pixel-wise t-tests with false discovery rate (FDR) correction remain the most commonly applied univariate method. For multi-group designs (three or more conditions), ANOVA with post-hoc tests (Tukey's HSD for all pairwise comparisons, Dunnett's test for comparisons against a reference group) extend the framework. The critical consideration is the multiple testing burden: a typical MSI dataset may contain 10,000-50,000 m/z bins, and testing each independently at α = 0.05 produces hundreds of false positives. Benjamini-Hochberg FDR control at 5% is the minimum standard; for studies feeding into targeted validation, a more stringent threshold (FDR < 1%) reduces the validation burden.
However, pixel-wise univariate tests ignore a defining feature of spatial data: neighboring pixels are not independent. Spatial autocorrelation — the tendency of nearby pixels to exhibit similar lipid abundances — increases the effective number of independent tests in ways that conventional multiple testing corrections do not fully address. This is where spatial-aware statistical approaches become essential.
Multivariate Methods: PCA, PLS-DA, and OPLS-DA
Multivariate methods are the workhorses of comparative spatial lipidomics, simultaneously modeling hundreds of lipid features to identify patterns that distinguish experimental groups:
Principal Component Analysis (PCA). Unsupervised dimensionality reduction that projects high-dimensional lipid data into lower-dimensional space. PCA is an exploratory tool for visualizing sample clustering, detecting outliers, and assessing whether biological groups separate more than technical replicates. Strong separation in PCA scores space along biological rather than batch axes is the first validation that an experimental design is working.
Partial Least Squares-Discriminant Analysis (PLS-DA). A supervised method that incorporates group labels to maximize class separation. PLS-DA produces Variable Importance in Projection (VIP) scores that rank lipids by their contribution to group discrimination — VIP > 1.0 is the conventional threshold for selecting discriminant features. However, PLS-DA is susceptible to overfitting, particularly with small sample sizes and high-dimensional MSI data. Rigorous validation is non-negotiable.
Orthogonal PLS-DA (OPLS-DA). Extends PLS-DA by partitioning systematic variation into predictive (correlated with the outcome) and orthogonal (uncorrelated) components. OPLS-DA often produces cleaner biomarker panels with fewer features, facilitating biological interpretation.
Chappel et al. (2024) reviewed these methods in the context of lipidomics more broadly and emphasized that no single multivariate method is universally optimal — the choice depends on study design, data structure, and the specific biological question. For routine multi-group comparisons in spatial lipidomics, PLS-DA with VIP-based feature selection, validated by permutation testing (≥100 permutations, p < 0.05 for model significance) and independent section validation, represents the most widely adopted approach.
Spatial-Aware Validation: Avoiding the Replicate Trap
The most consequential statistical pitfall in comparative MSI is the "replicate trap": pixel-level random cross-validation produces inflated accuracy estimates because training and test pixels from the same tissue section are spatially correlated. A PLS-DA model may appear to achieve 95% classification accuracy when pixels are randomly split, but drop to 60% when tested on an independent tissue section — the accuracy that actually matters for biological generalizability.
Three validation strategies address this, in order of increasing rigor:
- CORRS-CV (Constrained Repeated Random Subsampling Cross-Validation). Pérez-Guaita et al. (2020) introduced this method, which enforces a minimum Euclidean distance threshold between training and test pixels, ensuring spatial independence without requiring large numbers of independent sections. CORRS-CV produces accuracy estimates intermediate between overly optimistic pixel-level CV and overly conservative section-level CV.
- Section-aware cross-validation. Pixels from the same tissue section are never split across training and test folds. Each fold consists of one or more complete tissue sections, so model performance reflects genuine generalizability to new biological material.
- Independent cohort validation. The strongest approach: train the multivariate model on a discovery cohort, lock all parameters, and test on a completely independent cohort acquired separately. Ntshangase et al. (2025) exemplified this approach in a cross-species comparative MSI study of atherosclerotic plaques, identifying 67 differential lipids in rabbit plaques and 199 in human plaques, with pathway enrichment independently validated across species.
For discovery-phase studies, CORRS-CV provides a practical balance of statistical validity and feasibility. For studies intended to support biological claims or biomarker nomination, section-aware CV or independent validation is the minimum standard. Researchers developing custom statistical models should also explore bioinformatics analysis for metabolomics studies, which provides computational infrastructure adaptable to spatial lipidomics data.
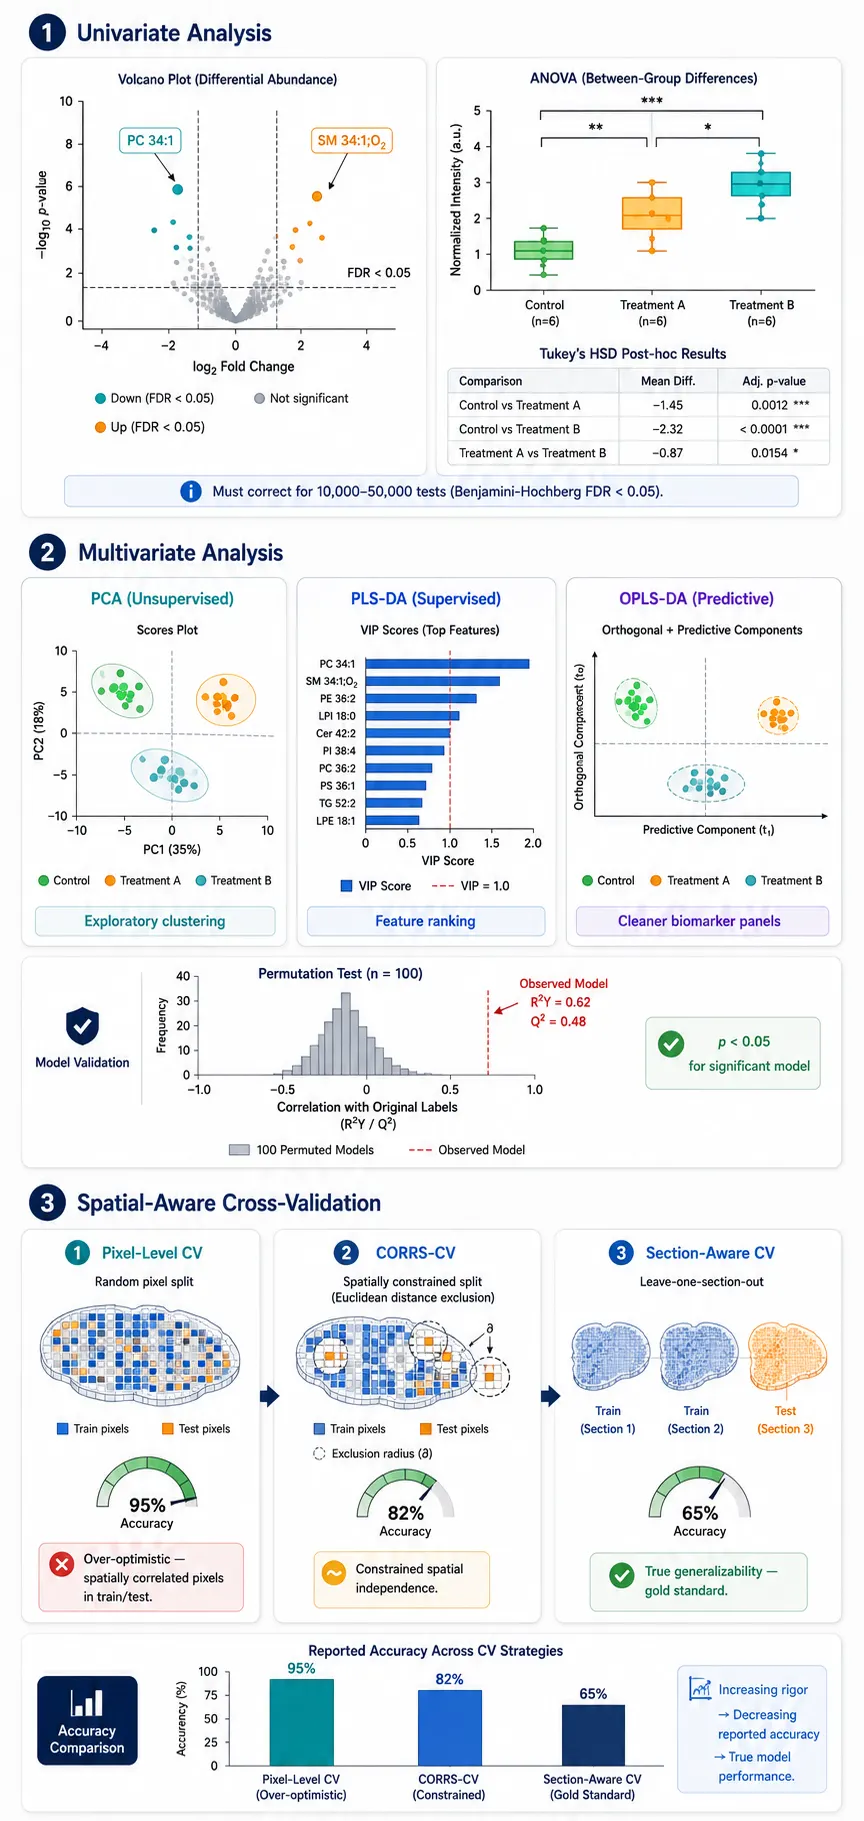 Figure 3: Statistical methods overview — from univariate pixel-wise testing through multivariate PLS-DA/OPLS-DA to spatial-aware cross-validation strategies, with performance comparison across validation approaches.*
Multi-Factorial Designs and Interaction Effects
Contemporary comparative spatial lipidomics increasingly employs multi-factorial designs that test interactions between treatment, sex, anatomical region, time point, and genotype. Stevens et al. (2025) demonstrated this capability by resolving sex-specific regional lipid alterations in lung tissue following combined allergen and ozone exposure — effects that would have been averaged out in a simple treated-vs-control comparison. Multi-factorial analysis of spatial lipidomics data requires careful attention to statistical power (each interaction term consumes degrees of freedom), balanced designs (equal representation across factor combinations), and clear a priori specification of hypotheses to avoid post-hoc rationalization of complex interaction patterns.
Software Tools and Computational Workflows
The software ecosystem for comparative spatial lipidomics spans dedicated MSI platforms, general-purpose lipidomics tools, and emerging machine-learning frameworks. Selecting the right tool depends on the analytical task:
Dedicated MSI statistical platforms. Cardinal (R/Bioconductor) provides comprehensive support for MSI data structures, including pre-processing, visualization, and statistical testing with awareness of pixel-level spatial context — its cvapply function supports user-defined folds for section-aware cross-validation. RegioMSI (R package; Stevens et al., 2025) specializes in multi-image normalization and unsupervised tissue segmentation using KNN and graph-based clustering adapted from single-cell RNA-seq methods.
Lipidomics-specific statistical tools. LipidSig 2.0 (Liu et al., 2024) is a web-based platform offering 24 data processing methods and six analytical modules — differential expression, enrichment, machine learning, correlation, network analysis, and profiling — specifically designed for lipid characteristics. Its multi-group analysis module supports complex experimental designs without requiring programming expertise. LION/web (Molenaar et al., 2019) provides web-based lipid ontology enrichment analysis, linking differentially abundant lipids to biophysical properties (membrane curvature, bilayer thickness) and subcellular localization — complementary dimensions that targeted lipidomics can then validate with absolute quantification.
General statistical environments. R/Bioconductor (Cardinal, sva for ComBat, ropls for OPLS-DA) and Python (scikit-learn for machine learning, SpatialDE for spatial variance analysis) provide the flexible infrastructure needed for custom analytical workflows. The MetaboAnalyst platform supports standard metabolomics/lipidomics statistical workflows including PCA, PLS-DA, hierarchical clustering, and pathway enrichment, and can accept pre-processed MSI feature matrices. For studies where statistical analysis reveals pathway-level lipid alterations, lipidomics pathway analysis maps differentially abundant spatial lipid features onto curated metabolic networks for biological contextualization.
Vendor and commercial platforms. SCiLS Lab (Bruker), High-Definition Imaging (Waters), and LipostarMSI (Molecular Horizon) provide integrated environments that handle data import, pre-processing, multivariate analysis, and visualization. While convenient, researchers should verify that the built-in cross-validation procedures account for spatial data structure rather than defaulting to pixel-level random splits.
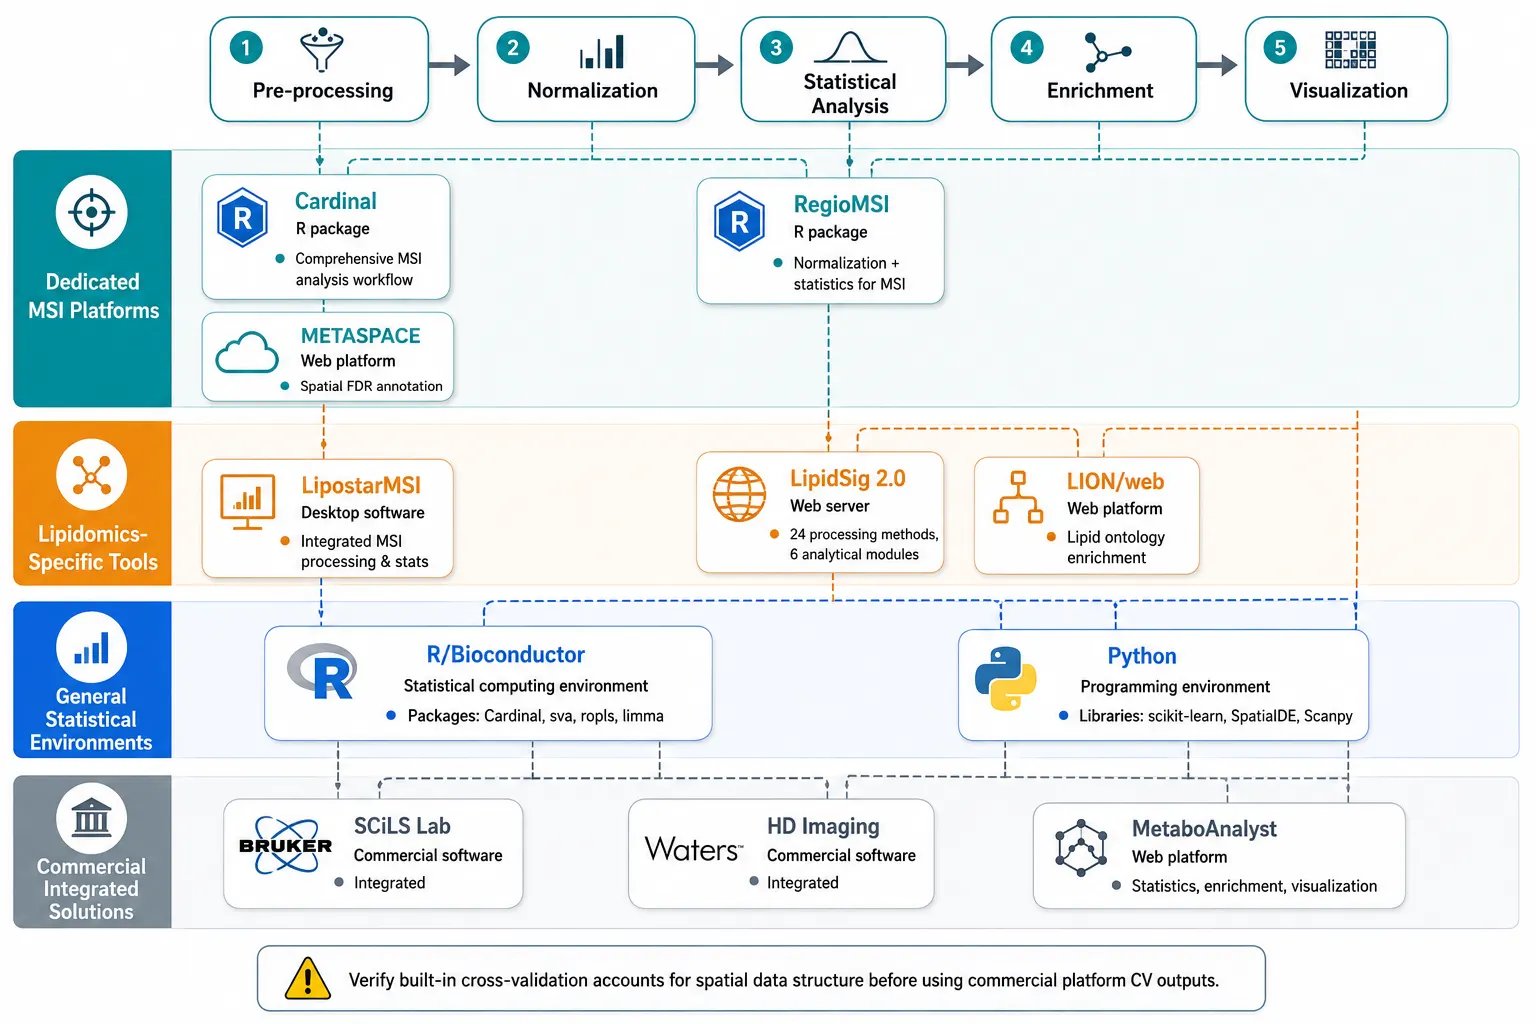 Figure 4: Software ecosystem for comparative spatial lipidomics — dedicated MSI platforms, lipidomics-specific tools, general statistical environments, and commercial integrated solutions, mapped to analytical tasks in the comparative workflow.*
Best Practices and Recommendations
The following recommendations synthesize the methodological literature into actionable guidance for planning and executing comparative spatial lipidomics studies:
1. Design for the statistical analysis, not just the acquisition. Before cutting the first tissue section, specify: the experimental unit (individual organism, tissue specimen), the comparison structure (which groups, which factors, which interactions), the blocking scheme (slide, acquisition day), and the validation strategy (independent sections, independent cohort). A study designed around the analytical plan is orders of magnitude more likely to yield reproducible results than one where statistics are applied post-hoc.
2. Invest in normalization infrastructure. At minimum, include class-specific internal standards for the lipid classes of primary interest. The MSI SPLASH multi-class IS mixture (Vandenbosch et al., 2023) provides a validated starting point. Complement internal standard normalization with computational batch correction (ComBat) when acquisition spans multiple days or slides. For studies seeking the deepest lipid coverage, coupling MSI with lipidomics profiling by LC-MS/MS provides the intact lipid species identifications that contextualize spatial fragment or ion maps.
3. Validate at the correct level of independence. The validation strategy must match the intended generalization. If the claim is that lipid pattern X distinguishes disease from control tissue, validation on independent sections from independent biological replicates is required — pixel-level validation within a single section is insufficient. Adopt CORRS-CV as the minimum standard and section-aware or independent cohort validation for confirmatory studies.
4. Report methods transparently. Specify the number of biological replicates, the randomization procedure, which normalization method was applied (and why), which batch correction algorithm was used (with before/after metrics), the cross-validation strategy, and all software versions and parameter settings. Comparative spatial lipidomics findings are only as credible as the experimental and analytical methods that produced them. When spatial lipid differences are validated and warrant deeper molecular characterization, phospholipids analysis services can resolve the individual molecular species — chain length, unsaturation, and linkage type — underlying the class-level spatial patterns observed by MSI.
5. Bridge discovery and validation. A comparative spatial lipidomics study is most valuable when its findings can be followed up with orthogonal validation. The untargeted and targeted spatial lipidomics workflow — where discovery-phase untargeted MSI identifies candidate lipid biomarkers that are subsequently validated by targeted MRM-based MSI on independent tissue sections — represents the most complete analytical pipeline from comparative hypothesis generation to quantitative spatial confirmation.
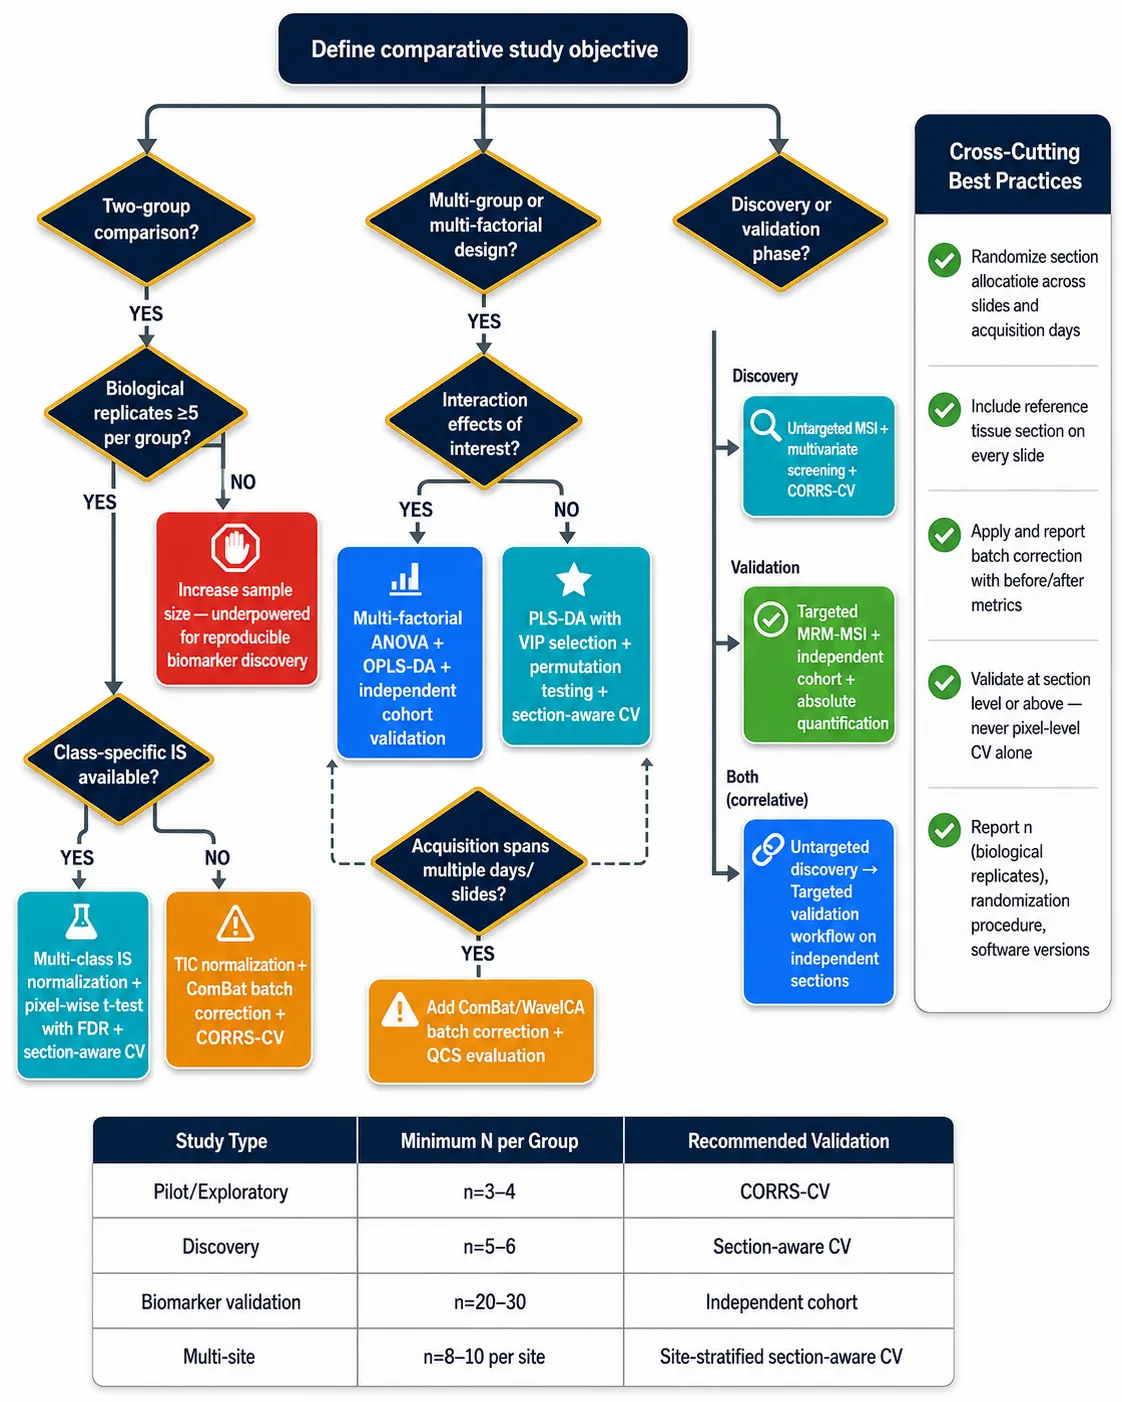 Figure 5: Best-practice decision tree for comparative spatial lipidomics — from study objective through experimental design choices, normalization strategy, statistical method selection, and validation approach.*
FAQ
Q: How many biological replicates do I need for a comparative MSI study?
For discovery-phase studies, a minimum of 5-6 biological replicates per group is recommended — fewer than 5 makes it impossible to distinguish biological variation from technical noise, and statistical tests at n = 3 per group lack the power to detect anything but extremely large effects. For formal biomarker validation, independent cohorts of 20-30 or more samples per group are standard. Crucially, the biological replicate is the independent tissue sample (individual animal, patient, or culture), not the tissue section or pixel — multiple sections from the same biological specimen are technical, not biological, replicates.
Q: What is the best normalization method for multi-group MSI comparisons?
Multi-class internal standard (IS) normalization using a mixture that includes class-specific representatives for each lipid class of interest is the current gold standard (Vandenbosch et al., 2023). When a comprehensive IS mixture is unavailable, TIC normalization can serve for exploratory visualization, but group comparisons should be interpreted cautiously. Computational batch correction (ComBat is the pragmatic first choice) should supplement — not replace — IS normalization when data acquisition spans multiple days or slides.
Q: Why does my PLS-DA model perform well in cross-validation but fail on new tissue sections?
This is the classic "replicate trap" — pixel-level random cross-validation violates the independence assumption because nearby pixels on the same tissue section are spatially correlated. The solution is section-aware cross-validation (each fold contains complete tissue sections) or CORRS-CV (spatial distance-constrained subsampling). If section-aware validation substantially reduces model performance, the original model was overfitting to section-specific artifacts rather than capturing generalizable biological signal.
Q: How should I handle batch effects when comparing tissue sections acquired months apart?
Acquiring all sections for a comparative study within a single acquisition campaign is ideal but often impractical for large cohort studies. When acquisition must span extended periods: (1) randomize the order of sections from different groups within each acquisition day; (2) include a reference tissue section (e.g., a homogeneous tissue homogenate section or commercial tissue standard) on every slide; (3) apply ComBat or an equivalent empirical Bayes batch correction; and (4) use PCA before and after correction to verify that batch-driven clustering is reduced while biological group separation is preserved. Critically, never acquire all samples from one experimental group in one batch and all samples from another group in a second batch — this irreparably confounds biological and technical variation.
References:
- Balluff B, Hopf C, Porta Siegel T, Grabsch HI, Heeren RMA. Batch effects in MALDI mass spectrometry imaging. J Am Soc Mass Spectrom. 2021;32(3):628-635. doi:10.1021/jasms.0c00393
- Vandenbosch M, Mutuku SM, Mantas MJQ, et al. Toward omics-scale quantitative mass spectrometry imaging of lipids in brain tissue using a multiclass internal standard mixture. Anal Chem. 2023;95(51):18719-18730. doi:10.1021/acs.analchem.3c02724
- Huang L, Kim Y, Balluff B, Cillero-Pastor B. Quality control standards for batch effect evaluation and correction in mass spectrometry imaging. Anal Chem. 2025;97(20):10919-10928. doi:10.1021/acs.analchem.5c02020
- Stevens NC, Shen T, Martinez J, et al. Resolving multi-image spatial lipidomic responses to inhaled toxicants by machine learning. Nat Commun. 2025;16:2954. doi:10.1038/s41467-025-58135-4
- Lukowski JK, Pamreddy A, Velickovic D, et al. Storage conditions of human kidney tissue sections affect spatial lipidomics analysis reproducibility. J Am Soc Mass Spectrom. 2020;31(12):2538-2549. doi:10.1021/jasms.0c00256
- Liu CH, Shen PC, Lin WJ, et al. LipidSig 2.0: integrating lipid characteristic insights into advanced lipidomics data analysis. Nucleic Acids Res. 2024;52(W1):W390-W397. doi:10.1093/nar/gkae335
- Chappel JR, Kirkwood-Donelson KI, Reif DM, Baker ES. From big data to big insights: statistical and bioinformatic approaches for exploring the lipidome. Anal Bioanal Chem. 2024;416(9):2189-2202. doi:10.1007/s00216-023-04991-2
- Ntshangase S, Khan S, Bezuidenhout L, et al. Spatial lipidomic profiles of atherosclerotic plaques: a mass spectrometry imaging study. Talanta. 2025;282:126954. doi:10.1016/j.talanta.2024.126954
- Pérez-Guaita D, Quintás G, Kuligowski J. Discriminant analysis and feature selection in mass spectrometry imaging using constrained repeated random sampling - cross validation (CORRS-CV). Anal Chim Acta. 2020;1098:110-118. doi:10.1016/j.aca.2019.10.039
- Molenaar MR, Jeucken A, Wassenaar TA, van de Lest CHA, Brouwers JF, Helms JB. LION/web: a web-based ontology enrichment tool for lipidomic data analysis. Gigascience. 2019;8(6):giz061. doi:10.1093/gigascience/giz061
The services described are for research use only. Not for use in diagnostic or therapeutic procedures.
















