

What Is a COA for Research Peptides?
You ordered a synthetic peptide. A vial arrived. Inside is a white powder and a document. That document — the Certificate of Analysis — is the only thing standing between you and a set of experiments built on an unverified reagent. Ignore it at your peril. For further reading on this topic, see our dedicated resource on lc-ms/ms biologics quantitation.
A Certificate of Analysis (COA) is a batch-specific quality document reporting the analytical test results for your peptide. It answers three deceptively simple questions: Is this the right molecule? How pure is it? What else is in the vial that shouldn't be? The value of a COA lies not in the fact that it exists — every supplier provides one — but in what data it contains and what it leaves out.
From a research workflow standpoint, the COA serves as the first experimental gate. Before you dissolve the powder, before you pipette it into your assay, before you interpret a single data point, the COA tells you whether the material in your hand matches what you paid for. A peptide with 98% HPLC purity but the wrong sequence is a 98% pure waste of your time. A peptide with the correct sequence but 0.5 EU/mg endotoxin will trigger TLR4 responses that masquerade as biological activity. The COA catches both problems — if you read it properly.
Key Components of a Complete COA
Header Information and Batch Traceability
 Figure 1: Annotated layout of a comprehensive Certificate of Analysis showing the header section (peptide name, sequence, batch number, testing date), chromatogram panel with integration marks, mass spectrum with charge-state labels, amino acid analysis results table, and signature/authorization block.
The top section of a COA looks bureaucratic. It is not. The peptide name, one-letter sequence, molecular formula, and theoretical molecular weight establish what was ordered. The batch or lot number links the analytical data to the specific vial in your hand. If the batch number on the COA does not match the number printed on your vial label, stop. The document does not describe your material.
Additional header fields carry underappreciated weight. The testing date tells you when the analysis was performed — a COA dated 18 months before shipment raises legitimate stability concerns. Peptides degrade through oxidation, deamidation, and aggregation during storage; analytical results from last year may not reflect today's powder. The testing laboratory's name and address should be visible, not hidden behind a supplier's letterhead. ISO/IEC 17025 accreditation, indicated by the accreditation body's logo (A2LA, UKAS, or equivalent), means the lab operates under a documented quality system subject to external audit. An authorizing signature — electronic or wet-ink — closes the chain of custody. Without it, the document carries no accountable party.
HPLC Purity Data
Reversed-phase HPLC with UV detection at 214 or 220 nm is the primary purity method on virtually every peptide COA. The chromatogram — not the purity number printed beside it — is the data. A COA that reports "Purity: 98.3%" without showing the chromatogram is offering a conclusion without evidence.
The chromatogram displays the main product peak and any impurity peaks eluting at different retention times. What to scrutinize: the column type (C18, 4.6 × 150 mm, 5 µm particles is the default for peptides up to ~30 residues), the mobile phase system (water/acetonitrile with 0.1% TFA), the detection wavelength, and — critically — the integration marks showing where the software drew the baseline and how it separated overlapping peaks. A chromatogram with a single symmetrical peak, baseline resolution (Rs ≥1.5) from the nearest impurity, and stable baseline free of drift indicates a well-developed method and a reasonably pure sample.
The purity percentage is the main peak area divided by total integrated peak area — area-normalized purity. It carries a built-in blind spot: it only counts species that absorb at the detection wavelength. Water, inorganic salts, trifluoroacetate counterions, and any contaminant lacking a chromophore at 214 nm are invisible. A peptide reported as 98% pure by HPLC may contain only 75–85% peptide by mass once you account for these non-UV-active components. This is why peptide content by amino acid analysis matters for quantitative work. For labs needing independent purity verification, Creative Proteomics offers peptide purity and homogeneity characterization with full chromatographic traceability and orthogonal method validation.
MS Identity Confirmation
HPLC tells you how pure the sample is. Mass spectrometry tells you whether the main peak is actually your peptide. These are two independent questions. A COA that answers only one is incomplete.
The MS section reports the observed molecular mass alongside the theoretical mass calculated from the peptide sequence. For a 1,000–3,000 Da peptide analyzed by ESI-MS on a modern single-quadrupole or ion-trap instrument, the mass error should fall well within ±1 Da. High-resolution instruments — Q-TOF or Orbitrap systems — routinely deliver mass accuracy within 5 ppm, sufficient to distinguish deamidation (+1 Da) from the correct sequence. The mass spectrum itself should be presented, not summarized in a sentence. Charge-state envelopes for multiply charged ions ([M+2H]²⁺, [M+3H]³⁺) should be labeled. A single dominant molecular ion series at the expected mass confirms identity.
ESI-MS is the most common ionization method on peptide COAs because it couples directly to LC systems. MALDI-TOF is faster and tolerates salts and buffers better but sacrifices mass accuracy — in linear mode, typically ±0.05–0.1% of mass (±1–2 Da for a 2,000 Da peptide), which is sufficient to miss a deamidation event. Modern reflectron MALDI-TOF instruments with internal calibration achieve 2–10 ppm mass accuracy, though linear-mode operation remains common in QC settings for throughput. For sequence-level verification, LC-MS/MS with collision-induced dissociation (CID) or higher-energy collisional dissociation (HCD) generates b- and y-ion fragment series that confirm the amino acid sequence directly. For detailed guidance on MS-based identity verification, see our article on mass confirmation and structure verification of synthetic peptides. Creative Proteomics provides peptide identification and characterization services with high-resolution MS and MS/MS fragmentation for unambiguous sequence confirmation.
Amino Acid Analysis and Peptide Content
HPLC purity and MS identity together tell you the sample contains the right peptide at a certain UV purity. Neither tells you how much peptide is actually in the vial. That requires amino acid analysis (AAA).
AAA quantifies peptide content through acid hydrolysis, derivatization, and chromatographic quantification. The peptide is hydrolyzed in 6 M HCl at 110°C for 18–24 hours, releasing free amino acids. After derivatization with AccQ-Tag, OPA/FMOC, or ninhydrin-based reagents, individual amino acids are separated by reversed-phase HPLC and quantified against calibrated standards. The sum of the recovered amino acid masses, corrected for the water added during hydrolysis, divided by the weighed sample mass yields the peptide content — typically expressed as a percentage.
Peptide content of 65–90% is common for lyophilized research peptides, even when HPLC purity reads >95%. The mass deficit consists primarily of water, residual trifluoroacetate (from cleavage and HPLC mobile phases), and acetate or chloride counterions. The practical consequence: if you weigh 1.0 mg of powder assuming it is all peptide, but the true peptide content is 72%, your 10 µM solution is actually 7.2 µM. That 28% error propagates through every concentration-dependent measurement — IC₅₀ values, binding constants, kinetics parameters. For quantitative pharmacology and biophysical studies, Creative Proteomics provides amino acid analysis (AAA) with peptide content determination and amino acid molar ratio verification.
Analytical Methods Behind the COA
The preceding section described what data appears on a COA. This section examines how that data is generated — the instrument parameters, method choices, and analytical rigor that separate a trustworthy result from a perfunctory one.
HPLC Parameters That Matter
The quality of an HPLC purity result depends on method details that abbreviated COAs frequently omit. Understanding these parameters helps distinguish a rigorous analysis from a perfunctory one.
Column chemistry is the starting point. C18 bonded silica (4.6 × 150 mm or 250 mm, 5 µm or 3.5 µm particles) is the default for peptides up to ~30 residues. The retention mechanism is reversed-phase partitioning: peptides interact with the hydrophobic stationary phase and elute in order of increasing hydrophobicity as the organic modifier concentration rises. For larger or highly hydrophobic peptides, C8 or C4 columns reduce retention and improve recovery. For short hydrophilic peptides (<5 residues), a polar-embedded or C18-AQ column improves retention at the high aqueous mobile phase composition needed to retain them.
The mobile phase is nearly always water + 0.1% trifluoroacetic acid (TFA) as solvent A and acetonitrile + 0.1% TFA as solvent B, delivered as a linear gradient — typically 5–65% B over 20–40 minutes. TFA serves two functions: it acts as an ion-pairing agent, improving peak shape for basic and hydrophilic peptides, and it suppresses pH to ~2, protonating residual silanol groups on the silica surface to reduce peak tailing. Detection at 214 nm or 220 nm targets the amide carbonyl absorption; 254 nm or 280 nm can be used additionally to detect aromatic residues and identify impurities containing Trp, Tyr, or Phe.
Method quality indicators on the chromatogram include: peak symmetry factor between 0.8 and 1.5 (values outside this range indicate column degradation, overload, or poor mobile phase conditions), baseline resolution (Rs ≥1.5) between the main peak and the nearest impurity, and a flat, drift-free baseline. Column temperature of 25–40°C sharpens peaks by reducing mobile phase viscosity but can promote on-column deamidation or oxidation of sensitive sequences at the upper end of this range. For a broader discussion of HPLC method optimization, see our guide on peptide purity analysis by HPLC and LC-MS. For labs requiring method development support, Creative Proteomics offers de novo peptide sequencing and characterization services covering HPLC method optimization and full purity profiling.
MS Techniques on the COA
Three levels of MS evidence appear on peptide COAs, and knowing which one you are looking at matters. Single-stage MS — ESI-MS or MALDI-TOF — measures the intact molecular mass. This is the minimum acceptable data; it confirms the average mass of the synthesized product but provides no sequence-level information. LC-MS adds chromatographic separation before MS detection, linking each mass spectrum to a specific chromatographic peak. This confirms that the HPLC main peak and the MS signal correspond to the same species, ruling out co-elution artifacts. LC-MS/MS goes further: the parent ion is isolated, fragmented, and the product ion spectrum is recorded. The resulting b- and y-ion series provide direct sequence-level evidence.
For a peptide in the 1,000–4,000 Da range, ESI-MS on a single-quadrupole instrument with unit resolution is adequate for mass confirmation. The observed average mass should match the theoretical average mass within ±1 Da. A COA reporting only "MS: consistent with theoretical mass" without numerical values or the spectrum itself is not acceptable documentation. Request the raw data. For mass measurement at high resolution, Creative Proteomics offers accurate mass determination using Q-TOF and Orbitrap instrumentation.
Amino Acid Analysis in Detail
The quality of an AAA result depends on hydrolysis optimization and calibration rigor. Hydrolysis in 6 M HCl at 110°C for 18–24 hours is standard, but amino acid recovery is not uniform. Tryptophan is completely destroyed under these conditions and requires alkaline hydrolysis or methanesulfonic acid for quantification. Serine and threonine undergo partial degradation (5–10% loss), corrected using recovery factors from hydrolyzed standards. Cysteine and methionine are partially oxidized; performic acid oxidation to cysteic acid and methionine sulfone before hydrolysis stabilizes these residues for accurate quantification. Asparagine and glutamine are deamidated to aspartic acid and glutamic acid, respectively, so AAA reports Asx and Glx rather than the individual residues.
Post-hydrolysis, amino acids are derivatized — AccQ-Tag (6-aminoquinolyl-N-hydroxysuccinimidyl carbamate) and OPA/FMOC are the most common reagents — to produce fluorescent adducts separated by reversed-phase HPLC with fluorescence detection. Quantification against a calibrated amino acid standard mixture (typically Sigma AA-S-18 or Pierce AAA standard) generates molar ratios for each residue. Molar ratios within ±10% of theoretical for each amino acid confirm the correct composition. The sum of individual amino acid masses, corrected for the water molecules incorporated during hydrolysis (one H₂O per peptide bond cleaved), yields the total peptide mass in the sample, from which peptide content percentage is calculated.
Acceptance Criteria Framework
Purity Thresholds by Application Type
Not every experiment requires 99% purity. Applying a single purity threshold across all applications either wastes budget on unnecessarily pure material or risks experimental integrity with insufficiently pure peptide. The appropriate threshold depends on what the impurities can do in your specific experimental context.
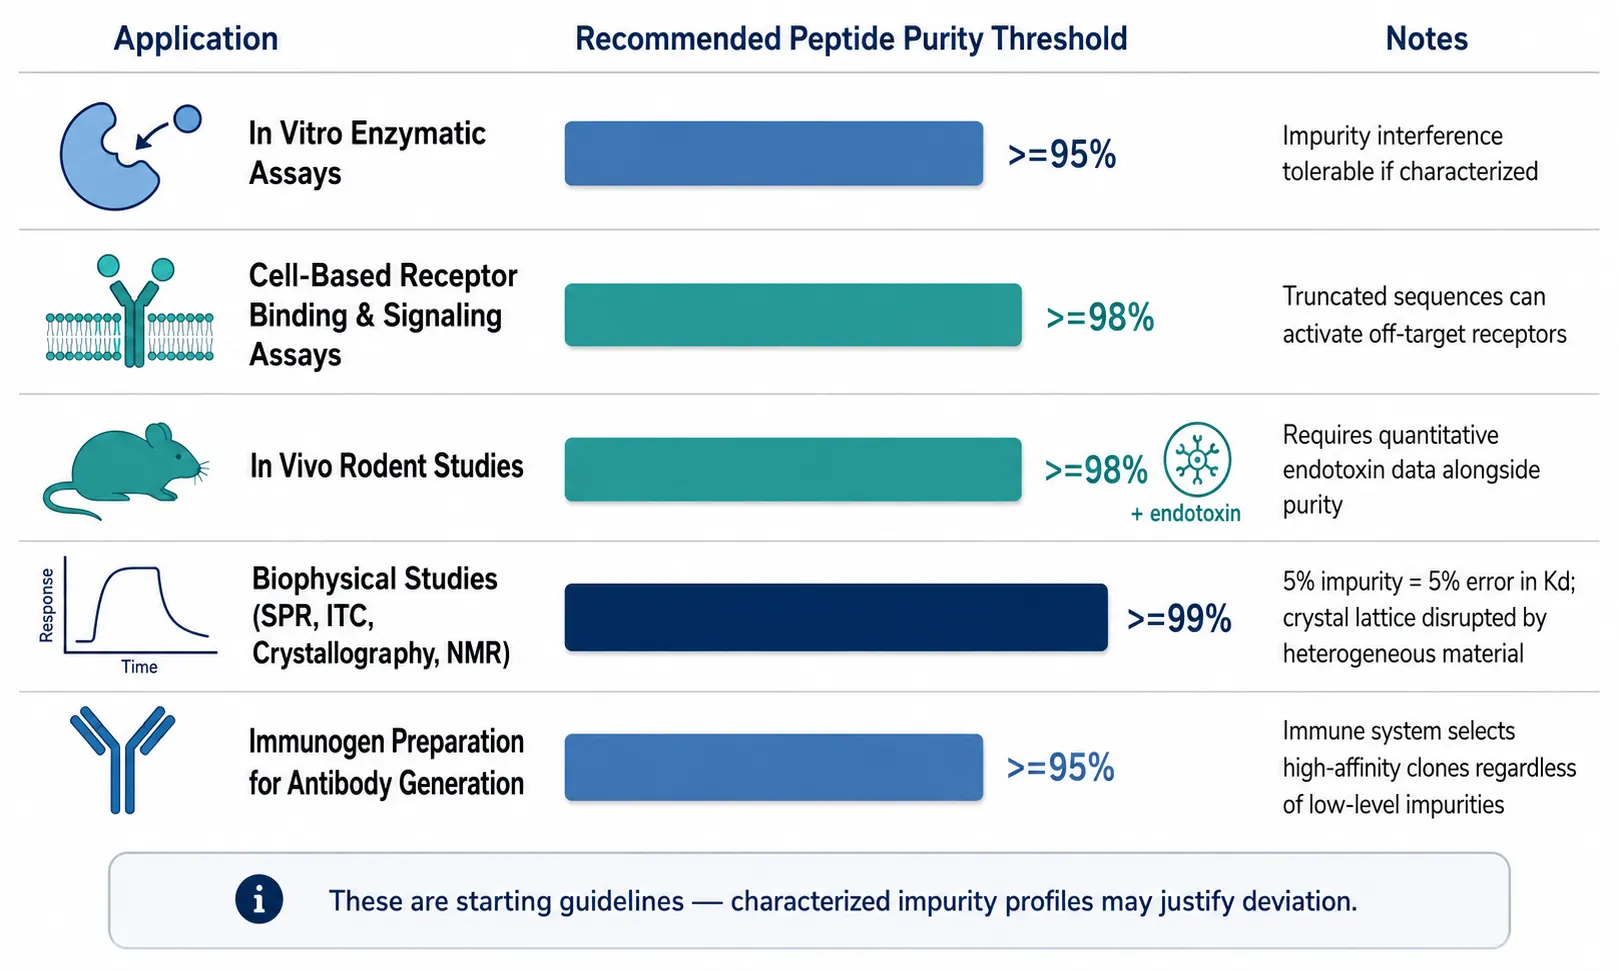 Figure 2: Decision framework table mapping five application types (in vitro enzymatic assays, cell-based receptor assays, in vivo rodent studies, biophysical studies, immunogen preparation) to their recommended purity thresholds (≥95%, ≥98%, ≥99%), with notes on the primary risk factor at each level and the rationale for the threshold.
For in vitro enzymatic assays, ≥95% purity is typically adequate. Impurities at the 5% level can shift IC₅₀ values if they possess intrinsic inhibitory or activating activity against the target enzyme, but for most discovery-phase screening, this level of interference is acceptable.
For cell-based receptor binding and signaling assays, ≥98% purity is recommended. Truncated sequences and deletion peptides — common synthesis byproducts — can bind and activate off-target receptors, generating signals that are indistinguishable from the intended biological response. Endotoxin control is equally critical at this level.
For in vivo rodent studies, ≥98% purity plus quantitative endotoxin data is the minimum. Impurities confound pharmacokinetic and pharmacodynamic interpretation by introducing uncharacterized chemical species into the circulation. Endotoxin at even moderate levels triggers systemic cytokine release that can mimic or mask the peptide's pharmacological effect.
For biophysical studies — surface plasmon resonance (SPR), isothermal titration calorimetry (ITC), and X-ray crystallography — ≥99% purity is the standard. SPR and ITC binding thermodynamics are exquisitely sensitive to the concentration of the active species; a 5% impurity in the analyte translates to a 5% error in the calculated binding constant, which can shift Kd values enough to alter mechanistic conclusions. Crystal formation demands homogeneous material; impurities disrupt lattice packing and prevent diffraction-quality crystal growth. For NMR structure determination, impurity resonances complicate chemical shift assignment, and ≥99% purity is expected.
For immunogen preparation for antibody generation, ≥95% purity is generally sufficient. The adaptive immune system selects for high-affinity B cell clones regardless of the presence of low-level impurities in the immunogen. Excess purity investment here yields diminishing returns.
These thresholds are starting guidelines, not fixed rules. A 95%-pure peptide whose 5% impurity profile is characterized — where you know the impurities are deletion sequences that cannot bind your target — may outperform a 99%-pure peptide whose 1% impurity is a potent partial agonist at the same receptor. For more on how purity interacts with in vivo experimental design, see our article on endotoxin and sterility testing for research-grade peptides.
Identity Confirmation Standards
Identity confirmation should employ at least two orthogonal analytical methods. The industry-standard pair is HPLC retention time plus MS molecular mass. Retention time alone is not identity confirmation — peptides of similar hydrophobicity co-elute on standard gradients, and a single retention time cannot distinguish between the target peptide and a sequence isomer. MS alone, without chromatographic corroboration, cannot differentiate between the correct peptide and a sequence isomer of identical mass (e.g., Leu/Ile substitution). The combination — correct mass at the expected retention time — provides strong presumptive identity evidence that is adequate for most research applications.
For publication-grade work, a third orthogonal method provides additional confidence. LC-MS/MS with sequence ion assignment directly confirms the amino acid sequence through b- and y-ion series matching. Amino acid analysis independently confirms composition. For smaller peptides (<20 residues), ¹H-NMR can provide complete structural confirmation. Each method constrains the identity claim along a different dimension; agreement across two methods makes a misidentification very unlikely, and agreement across three methods makes it extraordinarily improbable.
Batch-to-Batch Consistency
A single COA covers one batch. Most research projects span multiple orders and multiple batches over months or years. Batch-to-batch variability — in purity, peptide content, and impurity profile — is a systematically underappreciated source of irreproducibility in peptide-dependent research.
When a new batch arrives, compare its COA side by side with the previous batch. Retention time of the main HPLC peak should be consistent within ±0.2 minutes under identical method conditions. The observed mass should match. Impurity peaks present in the previous batch should appear at comparable relative abundances in the new batch. A new impurity peak — even at 0.3% relative area — signals a process change: different cleavage conditions, incomplete deprotection, a new side reaction during synthesis, or a change in purification cutoff. Each of these warrants investigation before the batch enters your experimental workflow.
For critical long-term studies, the lowest-risk strategy is to order a single large synthesis batch, verify it comprehensively with one COA, aliquot into single-use vials, and store at -20°C under desiccant. This eliminates batch-to-batch variability as a confounding variable. Creative Proteomics offers custom peptide synthesis with comprehensive QC documentation and batch reservation options for multi-year projects.
Contaminant Testing on the COA
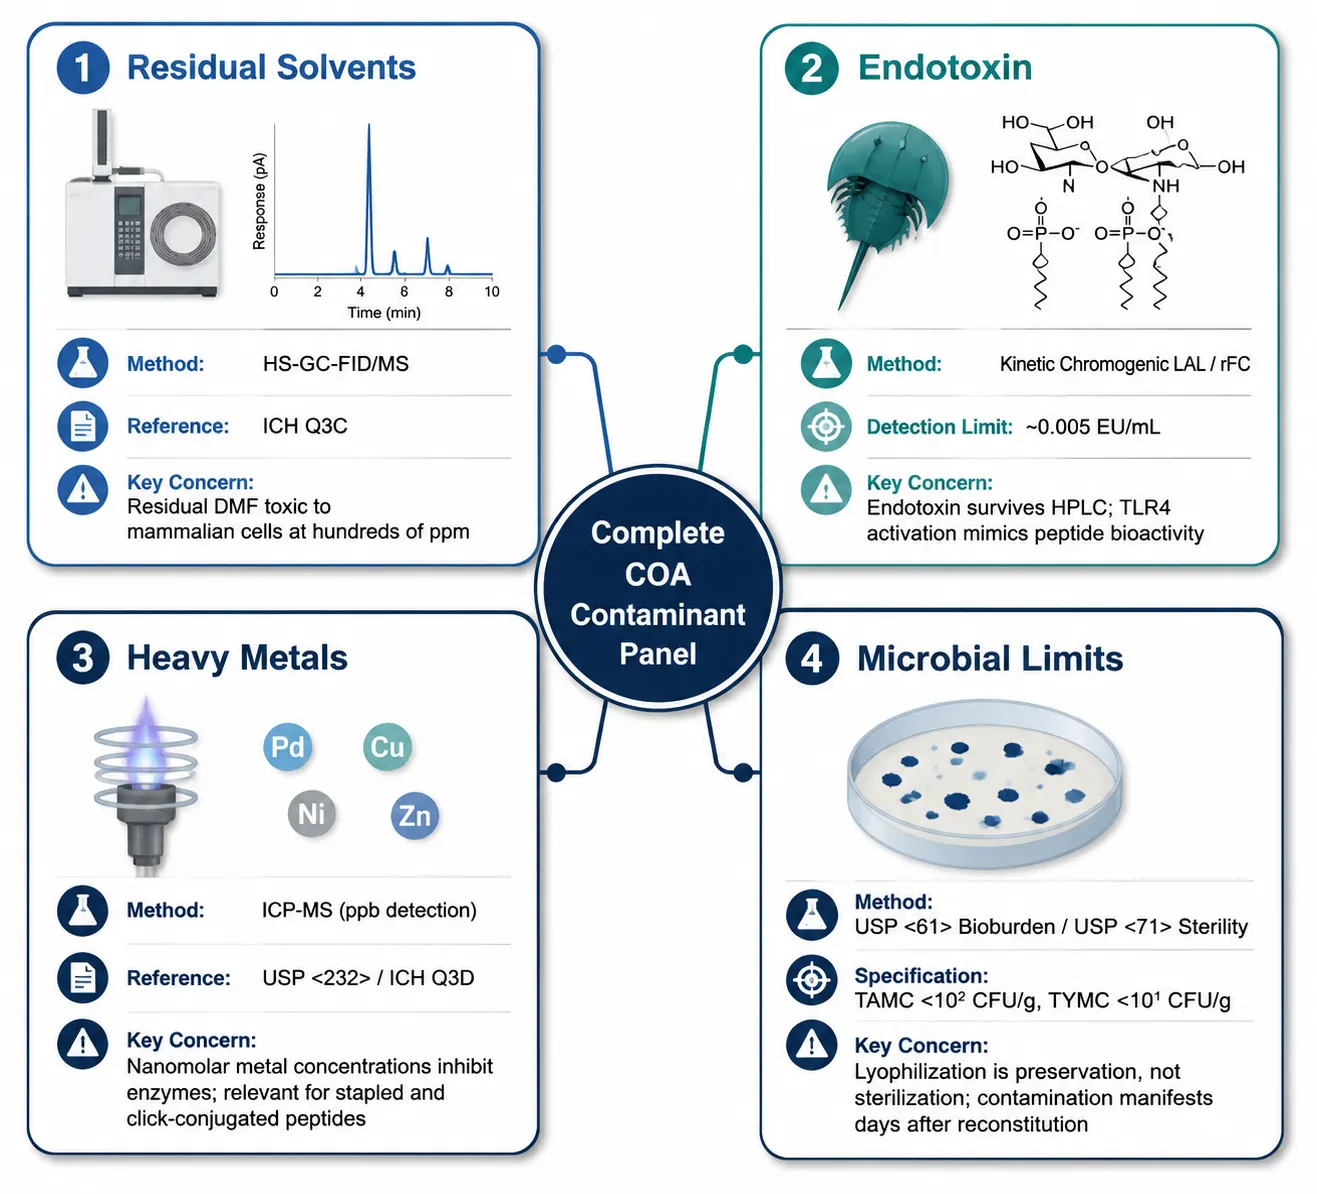 Figure 3: Overview table of the four contaminant testing categories covered on a complete peptide COA — residual solvents (method: HS-GC-FID/MS, reference standard: ICH Q3C), endotoxin (method: LAL/rFC, detection limit: 0.005 EU/mL), heavy metals (method: ICP-MS, reference standard: USP<232>), and microbial limits (method: USP<61>/<71>, specification: TAMC<10² CFU/g) — with typical acceptance criteria and the experimental contexts where each test becomes important.
Most research-grade peptide COAs address identity and purity but stop short of contaminant testing. For many in vitro biochemical applications, this is acceptable. For cell-based work, in vivo pharmacology, and any experiment where biological responses are the endpoint, contaminants matter. Four categories warrant attention.
Residual Solvents
Solid-phase peptide synthesis and HPLC purification expose the peptide to organic solvents at multiple stages: DMF and DCM during amino acid coupling and deprotection, TFA during cleavage from the resin, and acetonitrile during preparative and analytical HPLC. Residual quantities of these solvents persist in the lyophilized powder because lyophilization removes water efficiently but organic solvents with higher boiling points less completely.
The ICH Q3C guideline classifies residual solvents by toxicity risk and sets permitted daily exposure (PDE) limits for pharmaceutical products. For research peptides not intended for human administration, these limits serve as reference thresholds rather than regulatory requirements — but exceeding them can still compromise experiments. Residual DMF at concentrations in the hundreds of ppm range is toxic to many mammalian cell lines, producing cytotoxicity that may be misattributed to the peptide itself. Residual TFA acidifies reconstitution solutions and can alter peptide solubility.
Residual solvents are measured by gas chromatography with headspace sampling and flame ionization detection (HS-GC-FID) or mass spectrometry detection (HS-GC-MS). If your cell-based assay produces unexpected cytotoxicity, residual solvent testing should appear early on your troubleshooting list, before you conclude the peptide sequence is inherently toxic.
Endotoxin
Endotoxins are lipopolysaccharide (LPS) fragments shed from the outer membrane of Gram-negative bacteria. They are ubiquitous in laboratory environments and are not removed by reversed-phase HPLC — they co-elute or pass through the column and partition into the product fraction. A peptide that is 98% pure by HPLC can contain enough endotoxin to trigger robust TLR4-mediated cytokine release in cell-based assays and systemic inflammatory responses in vivo.
The standard detection method is the Limulus Amebocyte Lysate (LAL) assay, available in gel-clot (semi-quantitative, detection limit ~0.03 EU/mL), turbidimetric (quantitative, ~0.01 EU/mL), and chromogenic formats (quantitative, ~0.005 EU/mL). The kinetic chromogenic LAL assay is preferred for peptide QC due to its wide dynamic range and quantitative output. The recombinant Factor C (rFC) assay provides comparable sensitivity using a cloned Factor C enzyme — the first component of the horseshoe crab coagulation cascade exploited by LAL — and eliminates reliance on animal-derived reagents. Both methods are susceptible to peptide-specific matrix interference; a positive product control (spiking a known endotoxin concentration into the peptide solution) must be included to rule out LAL inhibition or enhancement by the peptide.
Endotoxin acceptance limits depend on experimental context. For standard cell-based work,<1 EU/mg is a reasonable specification. For in vivo studies, ≤0.5 EU/mg is typical. For primary immune cell culture, TLR-focused research, or assays intended to measure cytokine responses, <0.1 EU/mg is recommended. A COA reporting "Endotoxin: Pass" without the numerical result is insufficient — a pass/fail designation with an unspecified threshold is uninformative. Request the quantitative data.
Heavy Metals
Metal catalysts employed during peptide synthesis can persist as trace contaminants in the final product. Palladium is used for allyl-based protecting group removal; copper catalyzes click chemistry conjugation of fluorophores, biotin, or affinity tags; nickel and zinc appear from various catalytic steps. Certain metals are potent enzyme inhibitors at nanomolar concentrations, making even trace levels relevant for enzymatic and cell-based experiments.
The ICH Q3D guideline and USP<232>classify elemental impurities by toxicity risk and specify concentration limits based on the permitted daily exposure for each element. Analysis is by inductively coupled plasma mass spectrometry (ICP-MS), which achieves parts-per-billion detection limits and quantifies multiple elements simultaneously from a single sample digest. Heavy metal testing is not standard on research-grade COAs. It becomes relevant when the peptide carries a stapling modification (palladium), a click-conjugated moiety (copper), or an unnatural amino acid introduced via metal-catalyzed cross-coupling (palladium or nickel), or when the peptide will be used in enzymatic assays where certain metals at trace concentrations act as catalytic inhibitors. For comprehensive characterization, Creative Proteomics offers peptide sequence and composition analysis covering the full range of quality attributes including trace element profiling.
Microbial Limits
Research peptides are not manufactured as sterile products unless specified at the time of order. Lyophilization is a preservation step, not a sterilization step — it halts microbial proliferation but does not eliminate existing bioburden. USP<61>(Microbiological Examination of Nonsterile Products) specifies total aerobic microbial count (TAMC) and total yeast and mold count (TYMC) specifications. For nonsterile research peptides, TAMC<10² CFU/g and TYMC <10¹ CFU/g are typical acceptance criteria. For peptides destined for long-term cell culture or in vivo administration, sterility testing per USP <71>or bioburden data should be explicitly requested. A peptide powder with a high microbial load, once reconstituted in aqueous buffer and added to culture medium, can introduce contamination that manifests days to weeks later — often after irreplaceable cells or experimental time points have been lost.
Third-Party vs In-House COAs
A supplier COA is generated by the same organization that synthesized and sold the peptide. There is a structural tension here: the entity that benefits commercially from reporting high purity is also the entity producing the purity number. This does not mean supplier COAs are inherently untrustworthy — many reputable manufacturers maintain rigorous internal QC programs with calibrated instruments, trained analysts, and documented quality systems — but the conflict of interest is real and should be acknowledged.
Third-party COAs, produced by ISO/IEC 17025-accredited independent laboratories that receive the peptide blind, eliminate this conflict. The independent lab has no commercial interest in the result and reports directly to the customer. Third-party testing is the standard in regulated pharmaceutical QC and is increasingly expected in academic research. High-impact journals, including Nature and Journal of Biological Chemistry, now routinely expect peptide characterization data — including independent purity and identity verification — in supplementary information for manuscripts reporting peptide-based experiments.
The practical decision framework depends on experimental stakes. For routine use of a well-characterized peptide in an established assay with historical batch data, a supplier COA with complete chromatogram and mass spectrum is adequate. For a peptide entering a new project direction, supporting in vivo pharmacology, or anchoring a publication's central claim, independent third-party verification is recommended. The optimal approach combines both: supplier COA for rapid initial assessment, third-party COA for independent confirmation before committing to large-scale experiments.
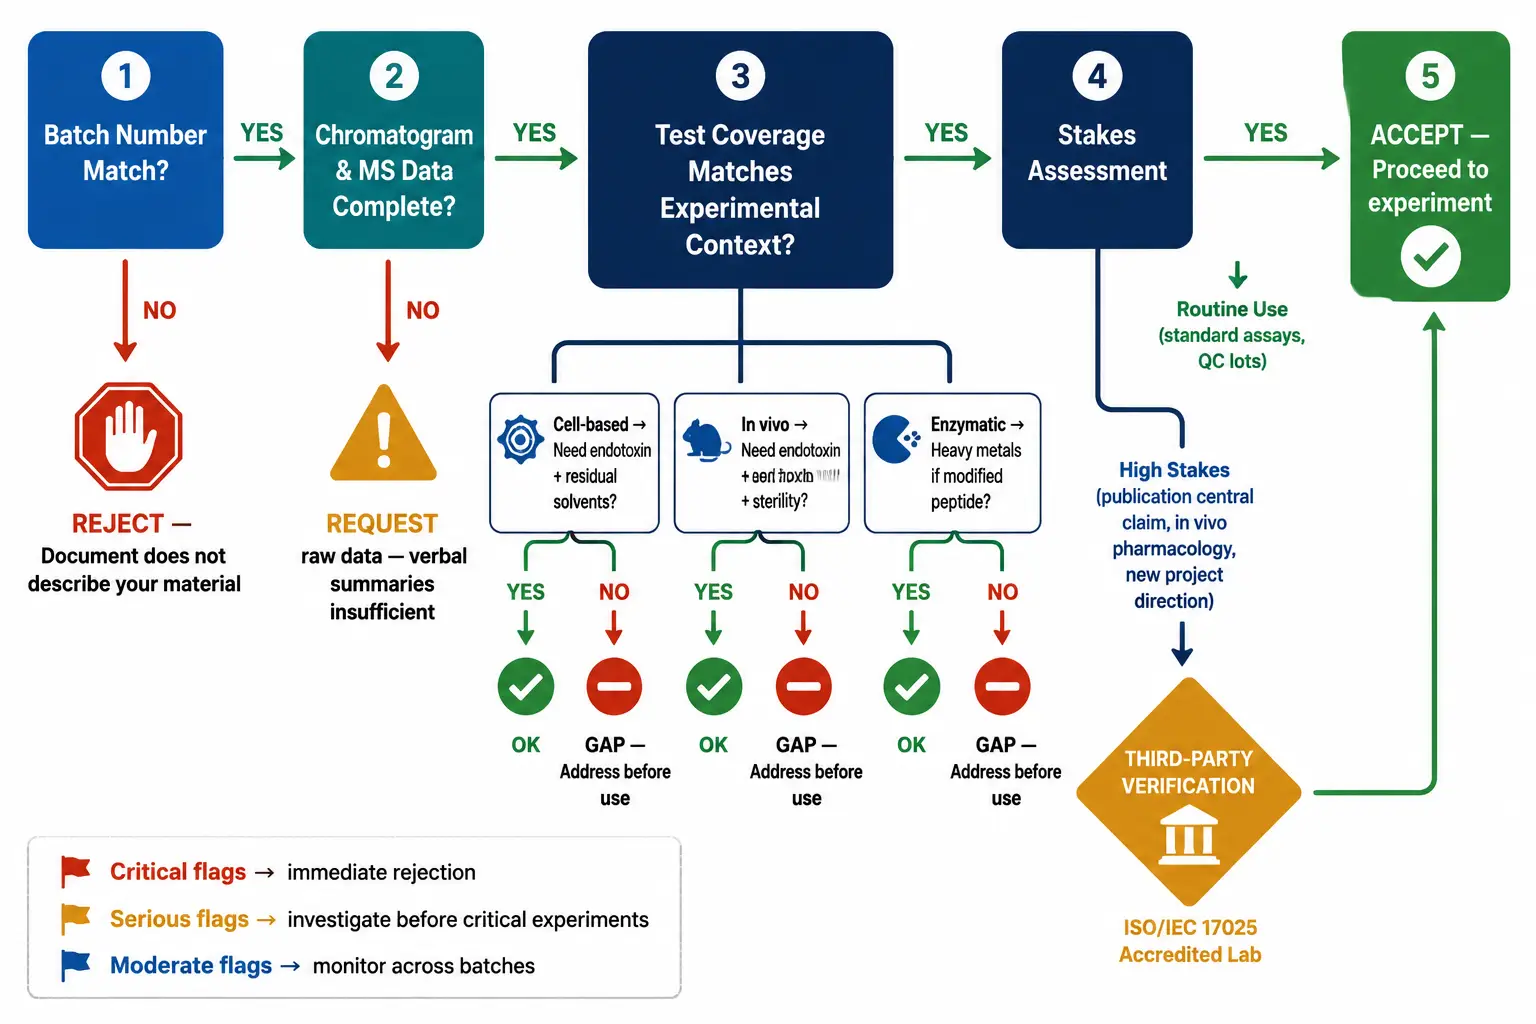 Figure 4: Decision flowchart for COA verification — start with batch number match check → review chromatogram and mass spectrum completeness → check for missing test categories based on experimental context (cell-based? in vivo?) → if supplier COA is incomplete or stakes are high, route to third-party verification → final gate: accept and proceed or reject and request new data. Each decision node includes the specific checklist items from the relevant section.
For peptide characterization and quality verification, Creative Proteomics provides peptide mapping and host cell protein analysis for orthogonal quality assessment.
Red Flags Checklist
Not all COAs are created equal. Some are incomplete. Some are misleading. Some are fabricated. The following checklist, organized by severity, identifies warning signs that should trigger further investigation before you trust the data.
Critical flags — reject the batch or demand documentation before proceeding:
- Batch or lot number absent, or the number on the COA does not match the vial label
- HPLC purity reported as a single percentage without a chromatogram
- MS result reported verbally (e.g., "consistent with theoretical mass") without numerical mass values or the spectrum
- Testing laboratory not identified — you cannot verify who generated the data
- COA dated more than 12 months before shipment without retest data
- Purity claims exceeding 99.9% — this is at or beyond the reliable detection limit of standard HPLC-UV
Serious flags — investigate and resolve before committing to critical experiments:
- Chromatogram shows a single peak but no integration marks or retention time labels
- Mass spectrum contains unexplained additional ion series at significant relative abundance
- No endotoxin data for a peptide destined for cell-based or in vivo use
- Peptide content by AAA or elemental analysis not reported, yet the peptide is sold by weight
- COA identical to one received for a different batch ordered six months prior
- "Representative COA" or "example COA" language indicating the data describes a historical batch, not the one in your hand
- Testing laboratory is the supplier's in-house QC department with no external accreditation
Moderate flags — note and monitor across batches:
- No retest or expiry date
- Residual solvent data absent
- Appearance reported as "powder" or "solid" with no color, texture, or solubility description
- Integration parameters not specified (minimum peak area threshold, slope sensitivity, baseline type)
- Single-wavelength detection (214 nm only) without a second confirmatory wavelength
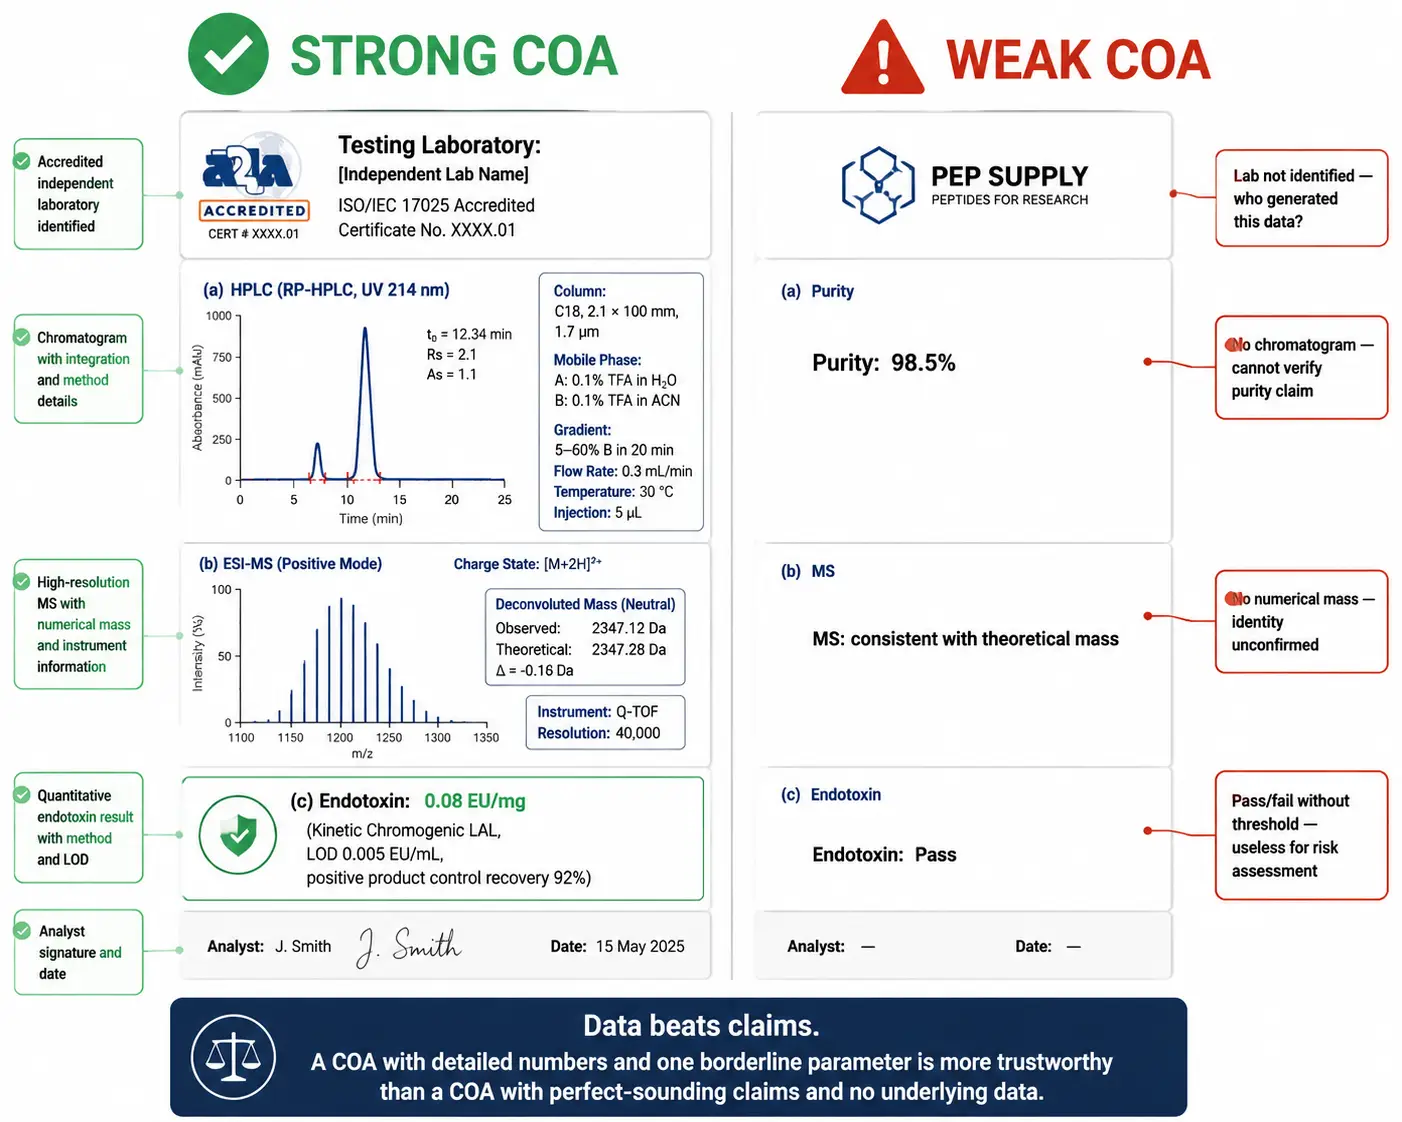 Figure 5: Side-by-side comparison of a strong COA versus a weak COA — the strong COA shows a labeled HPLC chromatogram with integration marks and retention times, an annotated mass spectrum with charge-state envelopes, a quantitative endotoxin result with LAL method details, and an ISO/IEC 17025-accredited laboratory header. The weak COA shows a bare "Purity: 98%" statement with no chromatogram, a verbal-only MS confirmation, "Endotoxin: Pass" with no numerical data, and no testing laboratory identification. Red-highlight callouts mark each deficiency on the weak COA and green callouts mark each strength on the strong COA.
A systematic COA review takes under five minutes once you know what to examine. The foundational principle: data beats claims. A COA with detailed numerical results, annotated chromatograms, and labeled spectra — even if one parameter falls slightly short of an ideal threshold — is far more trustworthy than a COA with perfect-sounding claims and no underlying data.
FAQ
What is a COA and why do I need one for research peptides?
A COA (Certificate of Analysis) is the batch-specific quality document shipped with your peptide. Without it, you are working with an unverified reagent — you have no independent confirmation of the molecule's identity, purity, or contaminant load. Always match the batch number on the COA to your vial label before proceeding.
What purity level do I need for my experiment?
≥95% for in vitro enzymatic assays, ≥98% for cell-based and in vivo studies, and ≥99% for biophysical applications (SPR, ITC, crystallography, NMR). The right threshold depends on what the specific impurities in your sample can do in your experimental system.
Does HPLC purity equal true peptide content?
No. Area-normalized HPLC purity only counts UV-absorbing species. Water, counterions, and salts that make up 10–35% of the powder mass are invisible. Peptide content by AAA is the relevant measurement for accurate concentration calculations.
How can I tell if a COA is from a legitimate testing lab?
Verify ISO/IEC 17025 accreditation through the accreditation body's database (A2LA, UKAS, or ILAC). The laboratory's name and contact information should appear on the COA, not just the supplier's branding.
What is the difference between a supplier COA and a third-party COA?
A supplier COA is generated by the same company that synthesized and sold the peptide. A third-party COA comes from an independent, ISO/IEC 17025-accredited laboratory that receives the peptide blind. Third-party COAs eliminate the inherent conflict of interest in self-testing.
How important is endotoxin testing for peptide COAs?
Critical for cell-based and in vivo experiments. Endotoxins survive HPLC purification and activate TLR4 signaling, producing biological responses that can be mistaken for peptide activity. Request quantitative endotoxin data, not just pass/fail.
What are the most common COA red flags?
Missing batch number matching your vial, purity percentage without a chromatogram, MS data without a spectrum or numerical mass values, COA dated more than 12 months before shipment, and "representative COA" language indicating the data is from a different batch.
Can I use the same COA criteria for every peptide?
No. Match your COA review standards to your experimental requirements. A peptide for enzyme kinetics needs accurate concentration and defined purity. A peptide for antibody generation can tolerate lower stringency since the immune system selects high-affinity clones regardless of impurities.
References:
- McCarthy J, Rosin D, Mulder R, et al. Reference Standards to Support Quality of Synthetic Peptide Therapeutics. Pharmaceutical Research, 2023, 40:1317-1328. doi:10.1007/s11095-023-03493-1.
- Carcelén N, González-Gago A, Marchante-Gayón JM, et al. Evaluation of different isotope dilution mass spectrometry strategies for the characterization of naturally abundant and isotopically labelled peptide standards. Analytical and Bioanalytical Chemistry, 2024, 416:1717-1731. doi:10.1007/s00216-024-05176-1.
- Kang HS, Lee JE, Park SY, et al. A Study on the Application of Recombinant Factor C (rFC) Assay Using Biopharmaceuticals. Microorganisms, 2024, 12(3):516. doi:10.3390/microorganisms12030516.
- Qasrawi H, Sakhnini N, Abu-Dayyih W, et al. Amino acid analysis for peptide quantitation using reversed-phase liquid chromatography combined with multiple reaction monitoring mass spectrometry. Analytical and Bioanalytical Chemistry, 2023, 415:5261-5267. doi:10.1007/s00216-023-04840-2.
- Purohit K, Reddy N, Sunna A. Exploring the potential of bioactive peptides: from natural sources to therapeutics. International Journal of Molecular Sciences. 2024;25(3):1391. doi:10.3390/ijms25031391.
- Petersson P, Åsberg D, Leek T, et al. Efficient Quality Control of Peptide Pools by UHPLC and Simultaneous UV and HRMS Detection. Separations, 2024, 11(5):156. doi:10.3390/separations11050156.














