

You ordered a custom 15-mer peptide for a dose-response study. The Certificate of Analysis states "Expected MW: 1789.95 Da, Purity: 97.8%." How do you know the vial contains the peptide you designed — not a deletion sequence, not a deamidated variant? Mass confirmation answers this: proving your peptide is correct, not just pure.
The m/z Principle
Every mass spectrometry experiment begins with a single physical principle: charged particles accelerate in an electric field, and their trajectory depends on their mass-to-charge ratio (m/z). If two ions carry the same charge, the lighter one deflects more. The mass spectrometer is not weighing molecules — it is sorting ions by their m/z, and mass is derived from that sorting.
For a peptide with molecular mass M that picks up z protons during ionization, the instrument detects it at m/z = (M + z x 1.0078) / z. A peptide of 1500 Da carrying three protons appears at approximately m/z 501. This is why we deconvolute — mathematically reconstructing the neutral mass from the charge-state envelope — to confirm whether the measured mass matches the theoretical value.
In practice, intact mass confirmation means asking one question: does the dominant ion after deconvolution correspond to the expected molecular formula within an acceptable error window? For high-resolution instruments (Orbitrap, Q-TOF), this window is typically under 5 ppm. For unit-mass instruments (single quadrupole), plus or minus 1 Da is standard. A mass match within tolerance confirms elemental composition — not sequence order.
Ionization Methods: ESI vs MALDI
Figure 1: ESI vs MALDI Spectrum Comparison — Side-by-Side of a Peptide Mass Spectrum Acquired by Each Ionization Method

Before a peptide can be analyzed, it must be transferred into the gas phase as an intact, charged species. The two dominant soft ionization techniques for peptides — electrospray ionization (ESI) and matrix-assisted laser desorption/ionization (MALDI) — accomplish this by different mechanisms, and the choice shapes every downstream decision. For additional insights into testing peptides analytical, explore our in-depth resource.
ESI — Multiple Charging and Online LC Coupling
In ESI, the peptide solution passes through a high-voltage capillary. The electric field disperses the liquid into charged droplets; as solvent evaporates, Coulombic repulsion triggers droplet fission until desolvated peptide ions enter the gas phase. The hallmark of ESI is multiple charging: a single peptide produces a charge-state envelope — peaks at m/z values for z = 2+, 3+, 4+, etc. Multiply charged precursors fragment more efficiently in tandem MS, producing richer b/y ion series for sequence verification.
The critical practical benefit is direct online coupling to liquid chromatography. An RP-HPLC column separates a crude peptide mixture upstream of the ESI source, and the mass spectrometer acquires spectra in real time as peaks elute. This LC-MS configuration is the backbone of modern peptide QC: one injection delivers a chromatogram for purity and a mass spectrum for identity in a single run. ESI is not forgiving of contaminants — salts, TFA, and detergents suppress ionization by competing for charge. Samples should be desalted and dissolved in volatile buffers (0.1% formic acid in water/acetonitrile).
MALDI — Speed, Simplicity, and Salt Tolerance
MALDI co-crystallizes the peptide on a metal target plate with a large excess of a small organic matrix — typically α-cyano-4-hydroxycinnamic acid (CHCA). A pulsed UV laser irradiates the co-crystal; the matrix absorbs the energy, vaporizes, and carries intact peptide ions into the gas phase, predominantly as singly charged [M+H]+.
The key operational difference: MALDI spectra are far simpler. A peptide appears as a single [M+H]+ peak rather than a multi-peak envelope — no deconvolution needed. MALDI tolerates salts, buffers, and modest amounts of TFA better than ESI, consumes very little material (a single 1 uL spot yields thousands of laser shots), and plates hold dozens of samples for sequential analysis without LC run-to-run delays.
The trade-off is that MALDI is offline — you lose chromatographic separation. A crude mixture produces a composite spectrum where all species compete within the same laser spot, and singly charged ions are generally less informative for MS/MS than ESI's multiply charged precursors.
Choosing Between ESI and MALDI
Choose ESI when you need online LC-MS — purity and identity in one integrated run — or when MS/MS sequence verification is needed. This covers the majority of routine synthetic peptide QC.
Choose MALDI when speed and salt tolerance are paramount — rapid screening of dozens of crude peptides, or samples that suppress ESI.
For maximum confidence, the two techniques are complementary. ESI favors hydrophobic species, MALDI favors basic and aromatic residues — using both catches more impurity species than either alone.
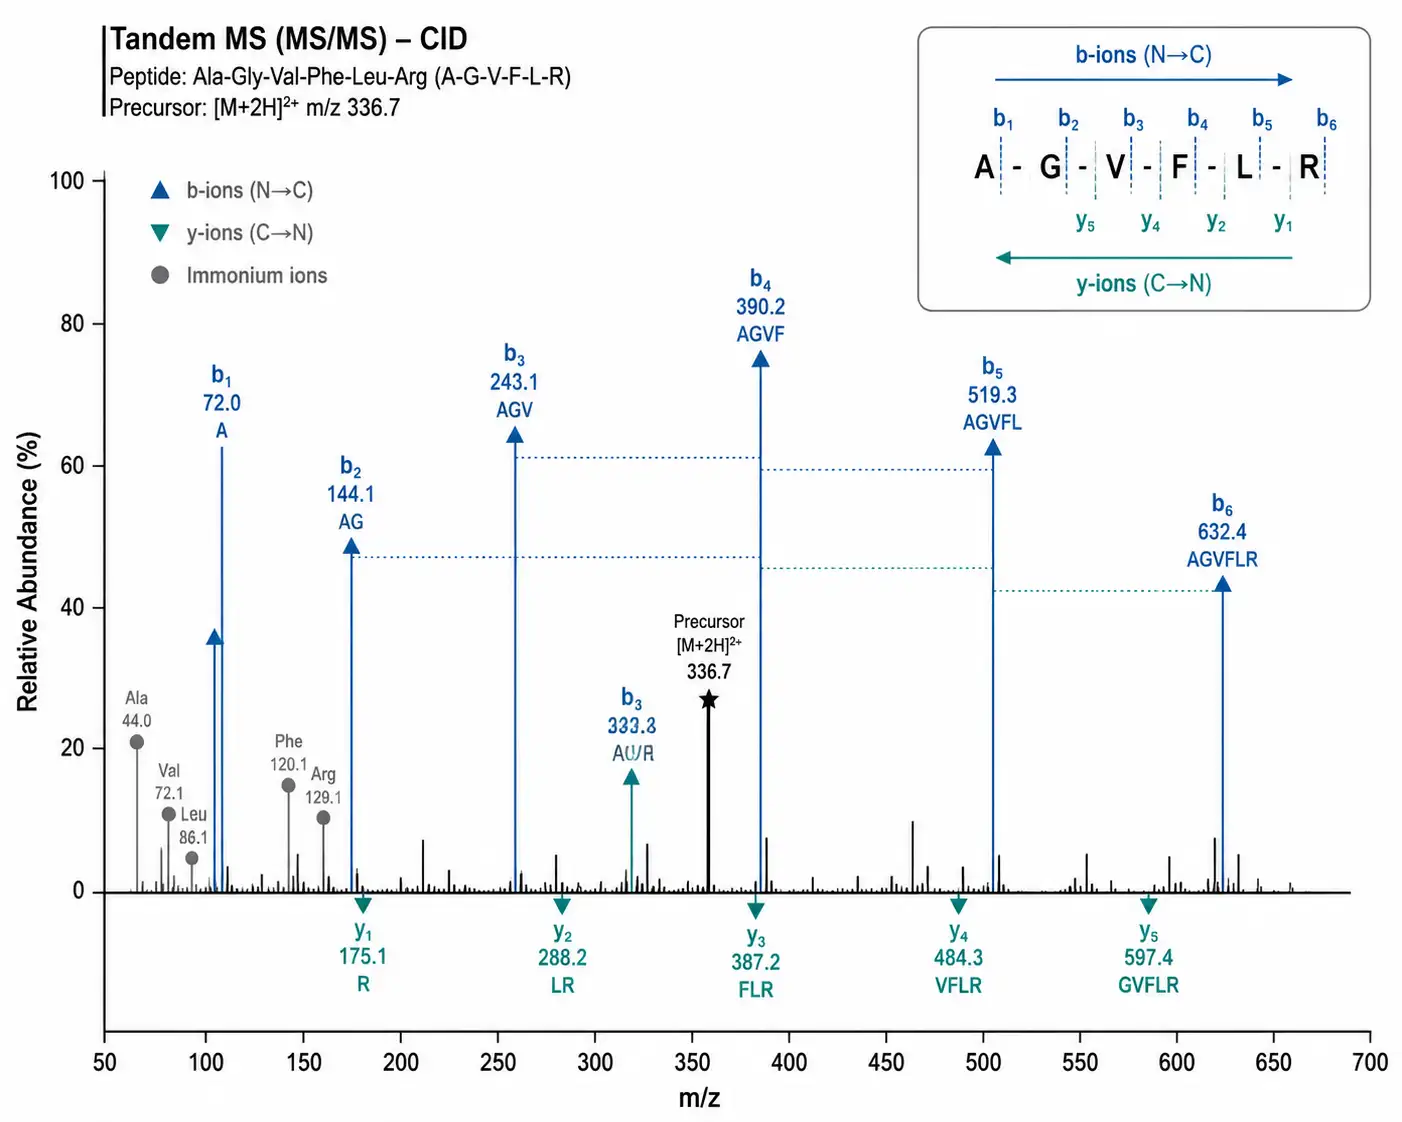
Figure 2: Annotated MS/MS Spectrum with b/y Ion Walkthrough — Step-by-Step Sequence Readout from a CID Fragmentation Spectrum
Mass Analyzer Types
After ionization, ions enter the mass analyzer — the component that physically separates them by m/z. Three analyzer types dominate peptide analysis, and understanding their trade-offs helps interpret COA data.
A quadrupole uses oscillating DC and RF voltages applied to four parallel rods: only ions of a specific m/z pass through at a given voltage combination. Quadrupoles are robust, fast, and inexpensive, but offer only unit-mass resolution — sufficient for intact mass confirmation (±1 Da) but incapable of resolving fine isotopic structure.
A time-of-flight (TOF) analyzer measures the time ions take to traverse a field-free flight tube — lighter ions arrive earlier. TOF analyzers offer high resolution (10,000–60,000 FWHM) and fast scan speeds. Q-TOF instruments combine a quadrupole front end for precursor selection and CID with a TOF analyzer for high-resolution fragment measurement, providing an ideal balance for routine peptide QC: sub-2-ppm mass accuracy, MS/MS sequencing capability, and fast data-dependent acquisition across an LC gradient.
An Orbitrap traps ions in an electrostatic field around a central spindle electrode; the oscillation frequency depends on m/z, and a Fourier transform yields a mass spectrum. Orbitraps achieve 100,000–500,000 resolving power with sub-ppm mass accuracy — the gold standard for distinguishing deamidation (+0.984 Da) from a 13C isotope peak, or resolving Lys from Gln (delta-m = 0.036 Da). An Orbitrap adds resolving power for heavily modified peptides, complex impurity profiles, or regulatory submissions requiring the highest accuracy.
Figure 3: Mass Analyzer Comparison Table — Quadrupole vs Q-TOF vs Orbitrap for Peptide Analysis
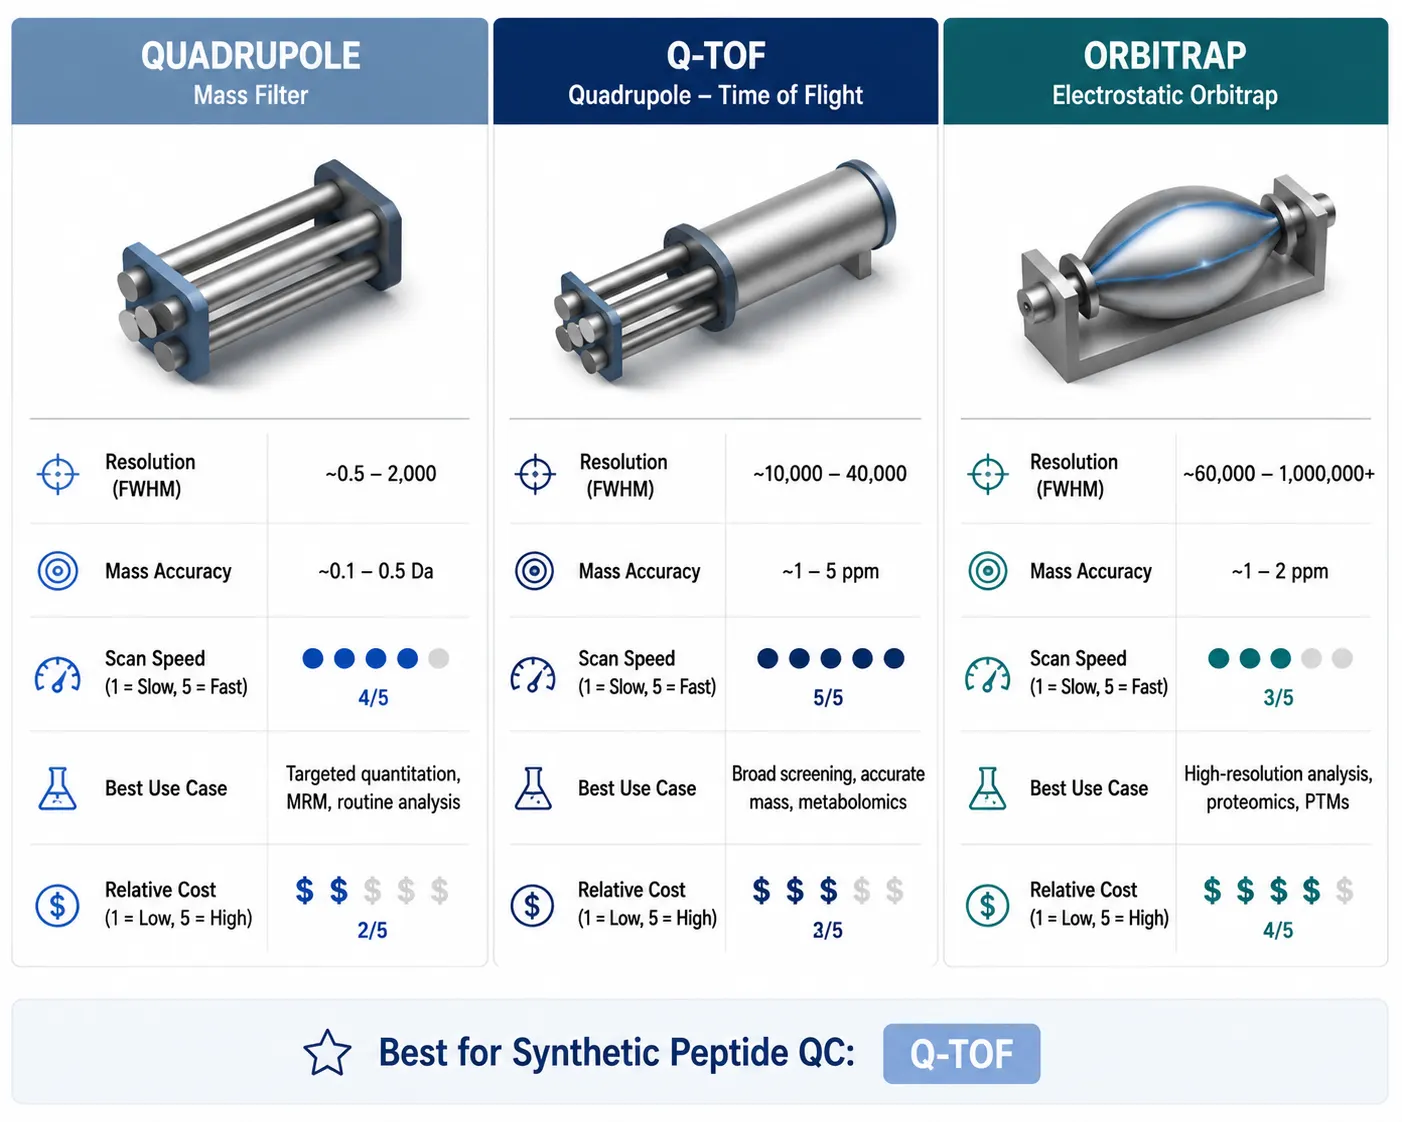
| Feature | Quadrupole | Q-TOF | Orbitrap |
|---|---|---|---|
| Resolution (FWHM) | 1,000 (unit mass) | 40,000–100,000 | 140,000–500,000 |
| Mass accuracy | ±1 Da | <2 ppm | <1 ppm |
| Scan speed | Fast | Very fast | Moderate |
| Typical use | Routine QC, single-mass check | Discovery, MS/MS sequencing | Deep characterization, PTM analysis |
| Relative cost | Low | Moderate–High | High |
Resolution, Accuracy, and Sensitivity — What Matters for Peptide Confirmation
For routine identity confirmation of a synthetic peptide, a Q-TOF platform provides an ideal balance: sub-2-ppm mass accuracy confirms the elemental composition unambiguously, MS/MS capability verifies the sequence, and the fast scan rate supports data-dependent acquisition across an LC gradient. An Orbitrap adds resolving power for challenging cases — heavily modified peptides, complex impurity profiles, or regulatory submissions requiring the highest mass accuracy. A single quadrupole is adequate for a rapid intact mass check when the peptide is well-characterized and sequence verification is not required, but it cannot perform MS/MS.
Reading a Peptide Mass Spectrum
A mass spectrum is not a molecular weight printout — it is a dataset that requires interpretation, and the most common mistakes in peptide QC come from misreading it.
Monoisotopic Peak and Isotope Envelope
Every peptide exists as a mixture of isotopologues — molecules with identical chemical structure but different numbers of heavy isotopes, primarily 13C (1.1% natural abundance). A peptide containing 80 carbon atoms has roughly 60% probability that at least one 13C is present. The mass spectrum of even a pure peptide therefore appears as an isotope envelope: a cluster of peaks spaced ~1.003 Da apart.
The monoisotopic peak — the leftmost peak in the envelope, corresponding to molecules containing only the lightest isotopes — is the mass that matters for database matching and formula confirmation. As peptide mass increases, the monoisotopic peak's relative intensity decreases. Above ~1900 Da, the first 13C peak becomes taller than the monoisotopic peak; above ~5000 Da, the monoisotopic peak may be undetectable. If a COA reports "observed MW" without specifying monoisotopic vs. average mass, ask which was used — for peptides below 2 kDa the difference is small, but for larger constructs the distinction matters.
Charge State Determination
In ESI, the spacing between adjacent isotope peaks directly reveals the charge state: z = 1.003 / delta(m/z). For a doubly charged ion, isotope peaks are separated by 0.50 m/z units; for a triply charged ion, 0.33 m/z units.
This relationship underpins charge-state deconvolution — the algorithm that converts a multi-peak charge envelope into a single neutral mass value. When reviewing deconvoluted data on a COA, two checks are advisable: (1) does the charge-state assignment make chemical sense? A 10-mer with one Arg and one Lys should show prominent z=2 and z=3 states, not z=6. (2) does the deconvoluted mass match the theoretical monoisotopic mass within the instrument's accuracy specification? A mass error of 20 ppm on a Q-TOF measurement warrants re-examination — it may indicate a sequence error, an unaccounted modification, or poor calibration.
MS/MS for Primary Sequence Verification
Intact mass confirmation tells you the peptide has the right atoms. It does not tell you those atoms are in the right order. For that, you need tandem mass spectrometry: selecting a precursor ion, fragmenting it, and reading the sequence from the fragment pattern.
CID/HCD Fragmentation Chemistry
In collision-induced dissociation (CID), the selected precursor ion is accelerated into a collision cell filled with inert gas (nitrogen or argon). The collisions deposit internal energy that redistributes along the peptide backbone. When enough energy accumulates at a peptide bond, it cleaves, producing b-ions (carrying the N-terminus) and y-ions (carrying the C-terminus). In CID spectra, y-ions are generally more abundant because basic residues (Arg, Lys, His) that retain protons are typically near the C-terminus.
Higher-energy collisional dissociation (HCD), used in Orbitrap instruments, achieves similar backbone fragmentation but with better recovery of low-mass ions — important because b1 and y1 ions, which anchor the N- and C-terminal assignments, often fall into the low-mass region that CID misses.
b/y Ion Series and Sequence Readout — A Step-by-Step Walkthrough
Suppose you have a synthetic peptide with the expected sequence H-Ala-Gly-Val-Phe-Leu-Arg-OH (theoretical monoisotopic mass: 671.42 Da) and you acquire an MS/MS spectrum. Here is how to manually verify the sequence:
Step 1 — Check the precursor mass. The isolated precursor should match the expected m/z for the charge state. If the peptide is doubly charged, expect m/z ~336.7.
Step 2 — Inspect the low-mass region for immonium ions. Before assigning b/y ions, scan the region below m/z 200 for immonium ions — single-amino-acid fragments that confirm which residues are present. For this peptide, you should see immonium ions for Ala (m/z 44), Val (m/z 72), Phe (m/z 120), Leu (m/z 86), and Arg (m/z 129). The presence of a Trp immonium ion (m/z 159) when your sequence has no Trp would be an immediate red flag.
Step 3 — Start from the high-mass end. The largest fragment peak near, but not at, the precursor m/z is usually the yₙ₋₁ ion (loss of the N-terminal residue) or bₙ₋₁ ion (loss of the C-terminal residue). For our peptide, y₅ (loss of N-terminal Ala) should appear at m/z 600.4 — the mass of Gly-Val-Phe-Leu-Arg + H⁺. If instead you see a large fragment at m/z 515.4 — corresponding to the loss of Arg — you have verified that Arg is at the C-terminus.
Step 4 — Walk inward from both ends. Calculate mass differences between consecutive y-ions. If y₄ (m/z 487.3) − y₃ (m/z 374.2) = 113.1 Da, that difference corresponds to Leu (residue mass 113.08 Da). Work through the entire series: y₅ → y₄ → y₃ → y₂ → y₁, verifying each mass difference against an amino acid residue mass table. The y₁ ion should be Arg (175.12 Da).
Step 5 — Cross-validate with b-ions. For each assigned b-ion, the complementary y-ion must satisfy: m/z(bᵢ) + m/z(yₙ₋ᵢ) ≈ precursor m/z × z − z × 1.0078 + 2. If b₂ (Ala-Gly) appears at m/z 144.1, the complementary y₄ should be near m/z 530.3. Finding both the b- and y-partner for at least three fragmentation sites provides strong confidence in the assignment.
Step 6 — Note what you cannot distinguish. Leu and Ile have identical residue masses (113.08 Da). Standard CID cannot tell them apart. If the sequence contains both Leu and Ile at specific positions, the MS/MS alone cannot confirm which is which — this requires electron-based fragmentation (ETD or EAD) that generates diagnostic side-chain fragments: Leu loses 43 Da (isopropyl radical), Ile loses 29 Da (ethyl radical).
A sequence is considered verified when ≥70% of inter-residue bonds are covered by assigned b- and y-ions, the complementary ion pairs check out, and no dominant unassigned peaks remain in the spectrum.
Database Searching vs. De Novo Sequencing
For synthetic peptides with a known expected sequence, database searching is the standard approach: the experimental MS/MS spectrum is matched against a theoretical spectrum generated from the expected sequence. If the peptide is what you ordered, the match should be unambiguous — high coverage, low mass error, all major ions explained.
De novo sequencing — reading the sequence directly from the spectrum without a reference database — is needed when the peptide is unknown or the spectrum does not match the expected sequence. De novo algorithms (PEAKS, Novor, pNovo) use graph-based approaches but correctly assign only 70-85% of residues. For synthetic peptide QC, de novo is a troubleshooting tool, not a primary identity method.
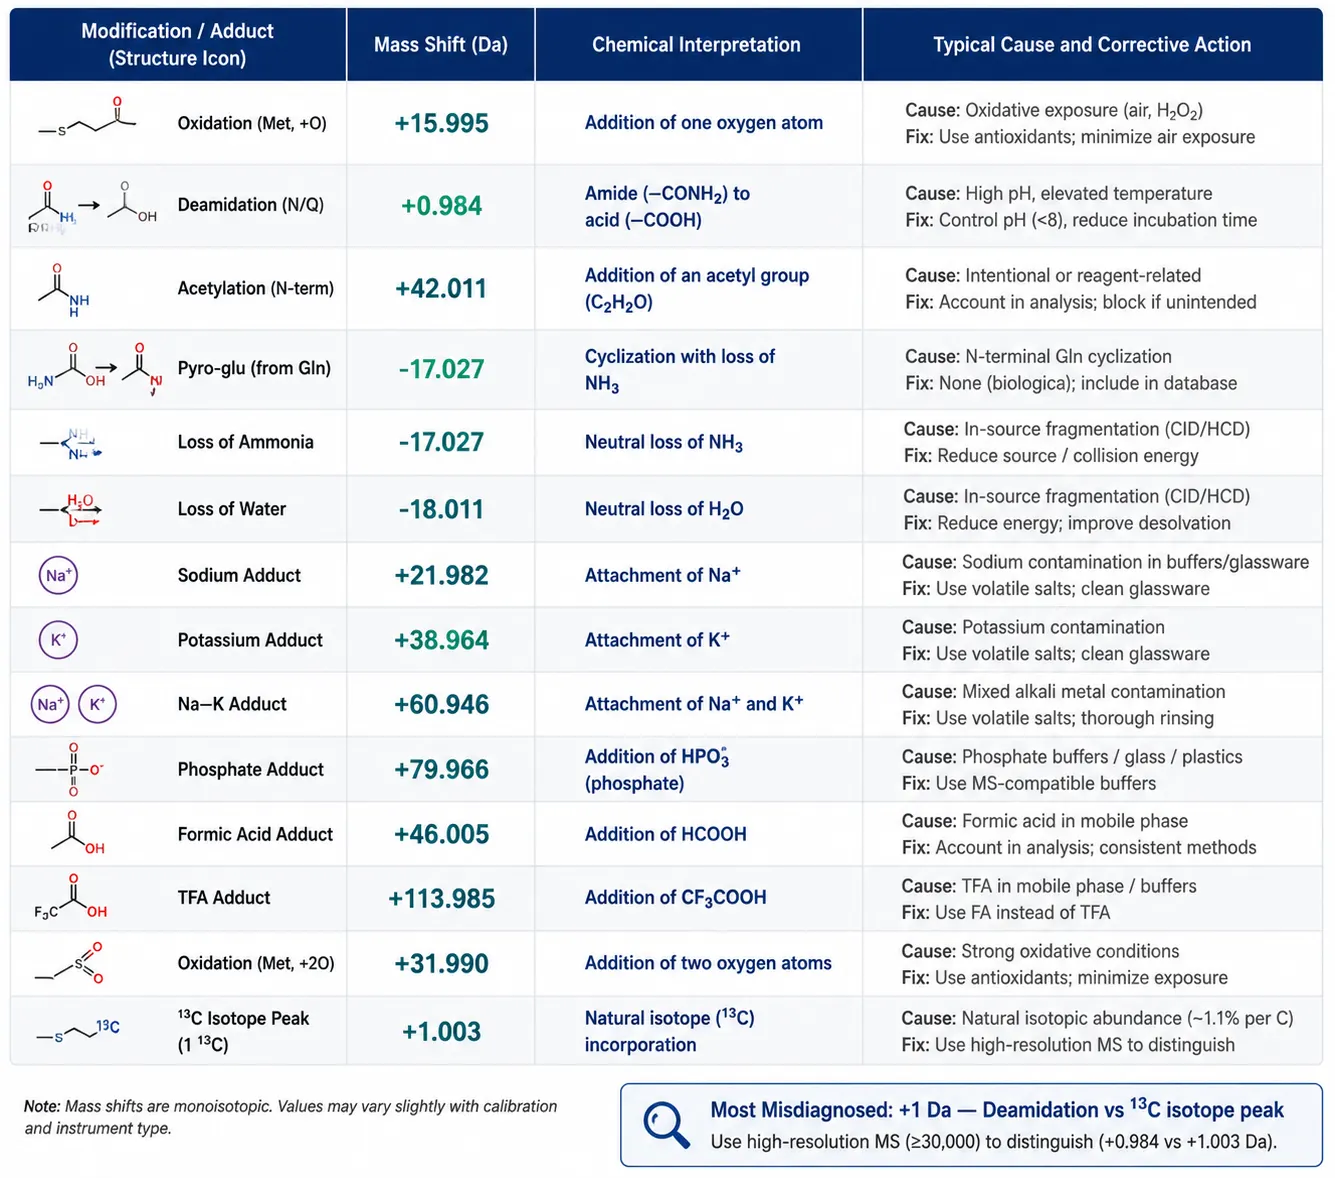
Figure 4: Common Mass Shift Diagnostic Table — Visual Reference of Peptide Modifications and Their Mass Differences
Common Mass Shifts — A Diagnostic Table
When the observed mass does not match the theoretical mass, the mass difference itself is the first diagnostic clue. The table below summarizes common mass shifts in synthetic peptide analysis, their chemical interpretation, and corrective action.
| Mass Shift (Da) | Interpretation | Typical Cause | What to Check |
|---|---|---|---|
| +0.984 | Deamidation | Asn/Gln conversion to Asp/Glu; spontaneous or during synthesis | Check for Asn-Gly or Gln-Gly motifs (most prone); may be synthesis artifact or storage degradation |
| +15.995 | Oxidation | Methionine sulfoxide formation | Check for Met residues; evaluate sample handling (air exposure, freeze-thaw cycles) |
| +31.990 | Dioxidation | Methionine sulfone | Severe oxidative conditions; usually a storage/handling issue, not synthesis |
| +42.011 | Acetylation | N-terminal acetylation; possible protecting group carryover | Check whether N-acetylation was intended; if not, review synthesis cleavage conditions |
| +56.026 | t-Butylation | Incomplete deprotection of tBu groups (Cys, Asp, Glu, Ser, Thr, Tyr) | Common in crude peptides; re-purify or extend deprotection time |
| +57.021 | Carbamidomethyl | Iodoacetamide alkylation of Cys | Confirm whether cysteine alkylation was intended in the synthesis specification |
| +71.037 | Acrylamide adduct | Acrylamide adduct on Cys from gel-based purification | Switch to gel-free purification if adduct is problematic |
| −18.011 | Dehydration / Pyro-Glu | N-terminal Gln cyclization to pyroglutamate; Asp/Glu dehydration | Check N-terminal residue; pyro-Glu formation is common and often irreversible |
| −17.027 | Ammonia loss | N-terminal cyclization of Gln, or Asn deamidation intermediate | Similar to dehydration — check N-terminal residue identity |
| +21.982 | Sodium adduct | Na⁺ from glassware, buffers, or solvents | Use ammonium-containing mobile phases; desalt sample; check lab water source |
| +37.956 | Potassium adduct | K⁺ contamination | Similar to sodium — trace K⁺ in buffers |
| +44.985 | Nitration | Tyr nitration | Rare in synthetic peptides; may indicate reagent contamination |
| +79.966 | Phosphorylation | Ser/Thr/Tyr phosphorylation | Confirm whether phosphorylation is intended; if not, rule out contamination |
| +114.043 | Ubiquitin remnant (Gly-Gly) | Ubiquitination tag left after cleavage | Check whether ubiquitination was part of the experimental design |
| −2.016 | Disulfide bond formation | Cys-Cys oxidation to cystine | Confirm whether disulfide bond formation is expected; if unintended, add reducing agent |
A mass shift of roughly +1 Da is the most frequently misdiagnosed observation in peptide MS. At unit-mass resolution, deamidation (+0.984) is indistinguishable from the ¹³C isotope peak (+1.003). High-resolution MS (Q-TOF or Orbitrap) resolves this ambiguity: at m/z 1500, the mass difference is approximately 13 ppm, well within the discriminating power of either platform. For low-resolution instruments, acquiring MS/MS on the shifted peak resolves the issue — deamidation produces fragment ions shifted by +1 Da relative to the unmodified sequence, while the ¹³C isotope peak does not.
MS in the QC Workflow
Mass spectrometry does not operate in isolation. In a well-designed QC workflow, MS evidence sits alongside HPLC, amino acid analysis (AAA), and — for advanced characterization — orthogonal methods such as capillary electrophoresis. Each technique answers a question the others cannot.
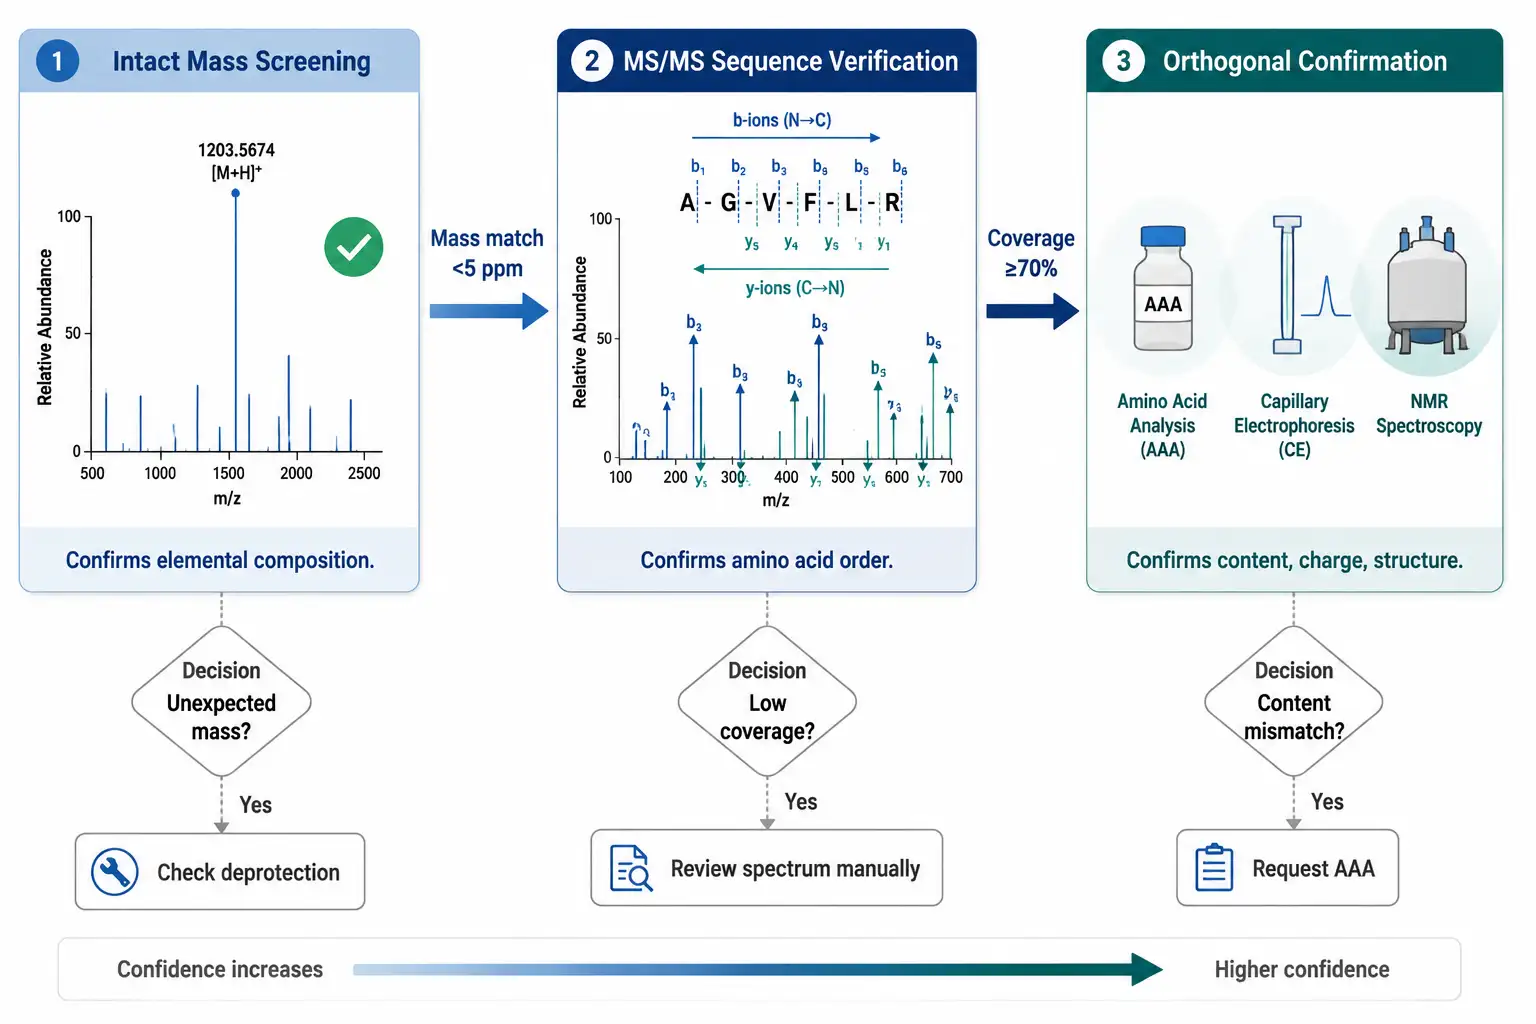
The typical QC workflow proceeds in three stages:
Stage 1 — Purity (RP-HPLC). The peptide is separated on a C18 column with UV detection at 214 nm. Purity is reported as the percentage of total integrated peak area of the main peak. This answers: how much UV-absorbing material is the target peptide? It does not confirm that the peak is the right peptide.
Stage 2 — Identity (LC-MS intact mass). The main HPLC peak is directed to the mass spectrometer. The deconvoluted mass is compared to the theoretical monoisotopic mass. A match within<5 ppm for HRMS confirms the elemental composition. This answers: does the molecule have the right formula? It does not confirm sequence order. For peptides that require formal molecular weight documentation, molecular mass determination provides validated mass values suitable for regulatory submissions.
Stage 3 — Sequence (MS/MS). The peptide is fragmented and the b/y ion series is matched against the expected sequence. Greater than or equal to 70% coverage with complementary ion pairs confirms the sequence. This answers: are the amino acids in the right order?
The peptide mapping service integrates Stages 2 and 3 — coupling LC separation with MS/MS data acquisition to simultaneously confirm identity and sequence. For peptides intended for publication or in vivo studies, MS/MS based sequencing should be requested explicitly as part of the characterization package, not assumed to be included in a standard "mass check." For additional insights into peptide characterization, explore our in-depth resource.
Figure 5: MS Verification Workflow Flowchart — Three-Stage QC Process from Intact Mass to Sequence Confirmation
What MS Cannot Tell You
Mass spectrometry is the most powerful single tool for peptide identity confirmation, but it has structural blind spots. Recognizing them prevents over-reliance on MS data and guides the selection of orthogonal methods.
1. Leu vs. Ile. These isomers share identical elemental composition (C6H13NO2, 113.084 Da) and standard CID cannot distinguish them. Electron-activated dissociation (EAD) or ETD is required — Leu loses 43 Da (isopropyl), Ile loses 29 Da (ethyl). Without this, AGLVFLR is indistinguishable from AGIVFLR by MS/MS alone.
2. Isobaric dipeptides. Thirteen dipeptide pairs share identical elemental compositions (e.g., Ser-Ala = Gly-Thr). Peptide mapping software can misassign these regions; manual review of MS/MS data in ambiguous regions is the only safeguard.
3. Stereochemistry. MS cannot distinguish L- from D-amino acids. If a D-amino acid was inadvertently incorporated during synthesis, the mass spectrum and MS/MS fragmentation look identical to the correct all-L peptide. Chiral amino acid analysis (GC-MS with chiral derivatization or LC with chiral columns) is required to detect stereochemical errors.
4. Peptide content. MS reports identity and purity, not how much peptide is in the vial. A 98%-pure peptide may contain only 72% peptide by weight — the rest being water, residual TFA, and counterions. Amino acid analysis after acid hydrolysis determines net peptide content, essential for correct dosing in biological assays.
5. Solution-phase conformation. MS operates in the gas phase. It reveals nothing about whether a peptide is folded, aggregated, or disordered in solution — SEC or dynamic light scattering (DLS) is needed for that assessment.
6. Novel or unexpected impurities. Database-dependent MS/MS strategies fail on peptides not in the reference database. If a synthetic byproduct with a novel sequence co-elutes with the main peak, it goes undetected. De novo sequencing with expert manual review addresses this for high-stakes characterization.
7. Bioactivity. A peptide with correct mass, confirmed sequence, and 99% purity may still be biologically inactive due to aggregation or a stereochemical error at the active site. MS confirms identity, not function.
FAQ
What mass accuracy should I expect for a routine intact mass check?
A: For high-resolution instruments (Q-TOF, Orbitrap), sub-5-ppm mass accuracy is standard. For unit-mass instruments (single quadrupole), ±1 Da is acceptable for peptides below ~2 kDa.
Can MS distinguish deamidation from a ¹³C isotope peak?
A: Yes, but only with high-resolution MS. The mass difference is roughly 0.019 Da. At m/z 1500, that corresponds to approximately 13 ppm — resolvable by Q-TOF or Orbitrap, but invisible to unit-mass instruments. If only low-resolution data is available, MS/MS resolves the ambiguity.
How many peptide bonds need to be confirmed for a sequence to be considered verified?
A: ≥70% coverage by combined b- and y-ions is the widely accepted minimum. For publication-quality data, aim for ≥85% with at least three complementary b/y ion pairs.
Should I request MS/MS sequencing even if the intact mass matches?
A: If the peptide is for publication, in vivo studies, or any experiment where a sequence error would waste significant resources — yes. Intact mass alone cannot detect sequence isomers. A deletion sequence (missing one amino acid) with a compensatory insertion of a residue with identical mass elsewhere in the sequence can produce a perfect mass match to the target sequence.
Does MALDI or ESI give better results for peptide QC?
A: ESI coupled to LC is the standard for integrated purity-and-identity workflows. MALDI is better for rapid screening of many samples and for samples with high salt content. The techniques are complementary — using both provides the most comprehensive impurity coverage.
What is the most common cause of an unexpected mass shift in a new synthetic peptide?
A: Incomplete side-chain deprotection, particularly residual tBu groups (+56 Da) on Cys, Asp, Glu, Ser, Thr, or Tyr. If your observed mass is approximately 56 Da higher than expected, and the peptide contains any of these residues, check the deprotection step first.
Can MS identify all impurities in my peptide sample?
A: No. Non-ionizable impurities, volatile organic contaminants that evaporate before detection, and impurities that co-ionize with preferential charge competition may be invisible. MS is orthogonal to HPLC — impurities visible by one method may be missed by the other, which is why multi-method characterization matters.
References:
- Purohit K, Reddy N, Sunna A. Exploring the potential of bioactive peptides: from natural sources to therapeutics. International Journal of Molecular Sciences. 2024;25(3):1391. doi:10.3390/ijms25031391.
- Klein K, Heisterberg J, Stolk P. Synthetic polypeptides using a biologic as a reference medicinal product — the European landscape of regulatory approvals. Frontiers in Medicine. 2024;11:1335928. doi:10.3389/fmed.2024.1335928.
- Fröhlich K, Fahrner M, Brombacher E, et al. Data-independent acquisition: a milestone and prospect in clinical mass spectrometry-based proteomics. Molecular & Cellular Proteomics. 2024;23(8):100800. doi:10.1016/j.mcpro.2024.100800.
- Kilpatrick LE, et al. Characterisation of synthetic peptide therapeutics using liquid chromatography-mass spectrometry: challenges and recent advances. Analytical and Bioanalytical Chemistry. 2023;415:4593-4606.. https://doi.org/10.3390/molecules30010097
- Neagu AN, et al. Applications of Tandem Mass Spectrometry (MS/MS) in Protein Analysis for Biomedical Research. Molecules. 2022;27(8):2411. CC BY 4.0. https://doi.org/10.3390/molecules27082411
- Yang F, Zhang J, Buettner A, et al. Mass spectrometry-based multi-attribute method in protein therapeutics product quality monitoring and quality control. mAbs. 2023;15(1):2197668. doi:10.1080/19420862.2023.2197668.














