

Why Purity Matters — The Stakes of Peptide Characterization
You ordered a synthetic peptide for your next functional assay. The supplier's data sheet says "Purity: 98.2% (HPLC)." Should you trust that number and proceed?
Not necessarily — and here is why.
HPLC purity tells you what percentage of the UV-absorbing material under a single chromatographic peak corresponds to your target peptide. It does not tell you whether that peak actually contains your peptide, whether co-eluting impurities are hiding underneath it, or how much of the lyophilized powder in the vial is actually peptide versus residual water, counterions, or salts. A peptide reported at 98% chromatographic purity may contain only 80% peptide by mass once you subtract trifluoroacetate counterions, adsorbed water, and residual synthesis solvents.
The consequence of getting this wrong cascades through every downstream experiment. In enzymatic assays, a 5% impurity with inhibitory activity can shift an IC50 value by an order of magnitude. In cell-based studies, trace levels of truncated peptide variants can activate off-target receptors — a problem compounded when the input material for downstream enrichment workflows, such as cell surface proteomics, has not been independently verified for purity. In biophysical experiments, even minor deamidation products can alter binding thermodynamics enough to send a lead optimization program down the wrong path.
This article walks through the two core technologies — RP-HPLC and LC-MS — that together form the minimum viable characterization package for research-grade synthetic peptides. We cover what each method actually measures, how to interpret the data, when to bring in orthogonal techniques, and how to spot the common pitfalls that lead researchers to overestimate peptide purity.
The guidance in this article reflects characterization workflows applied across a diverse range of synthetic peptides — from short linear sequences (<10 AA) to disulfide-rich cyclic peptides — and draws on both published consensus methods and the 2025 EMA regulatory framework for synthetic peptide characterization.
RP-HPLC — The Workhorse of Purity Assessment
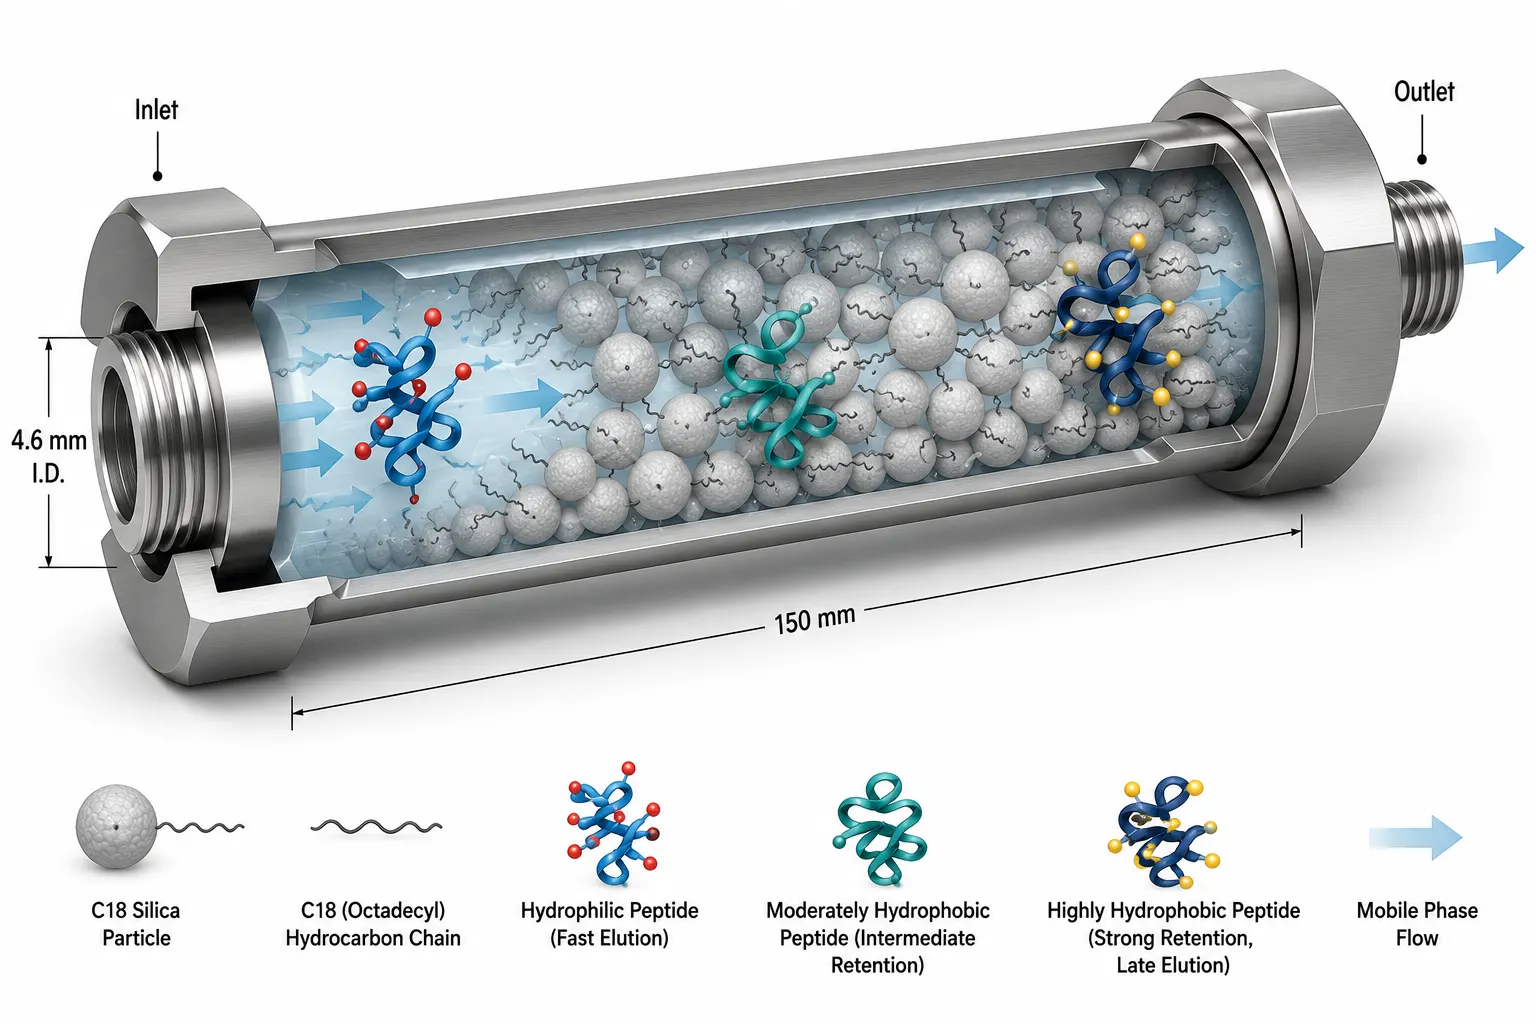
Reversed-phase high-performance liquid chromatography (RP-HPLC) with UV detection remains the most widely used method for peptide purity determination. Its ubiquity stems from simplicity: inject the dissolved peptide, run a water-acetonitrile gradient across a C18 column, and integrate the peaks at 214 nm where the peptide bond absorbs. The main peak area divided by total peak area gives you the chromatographic purity.
What the Chromatogram Actually Tells You
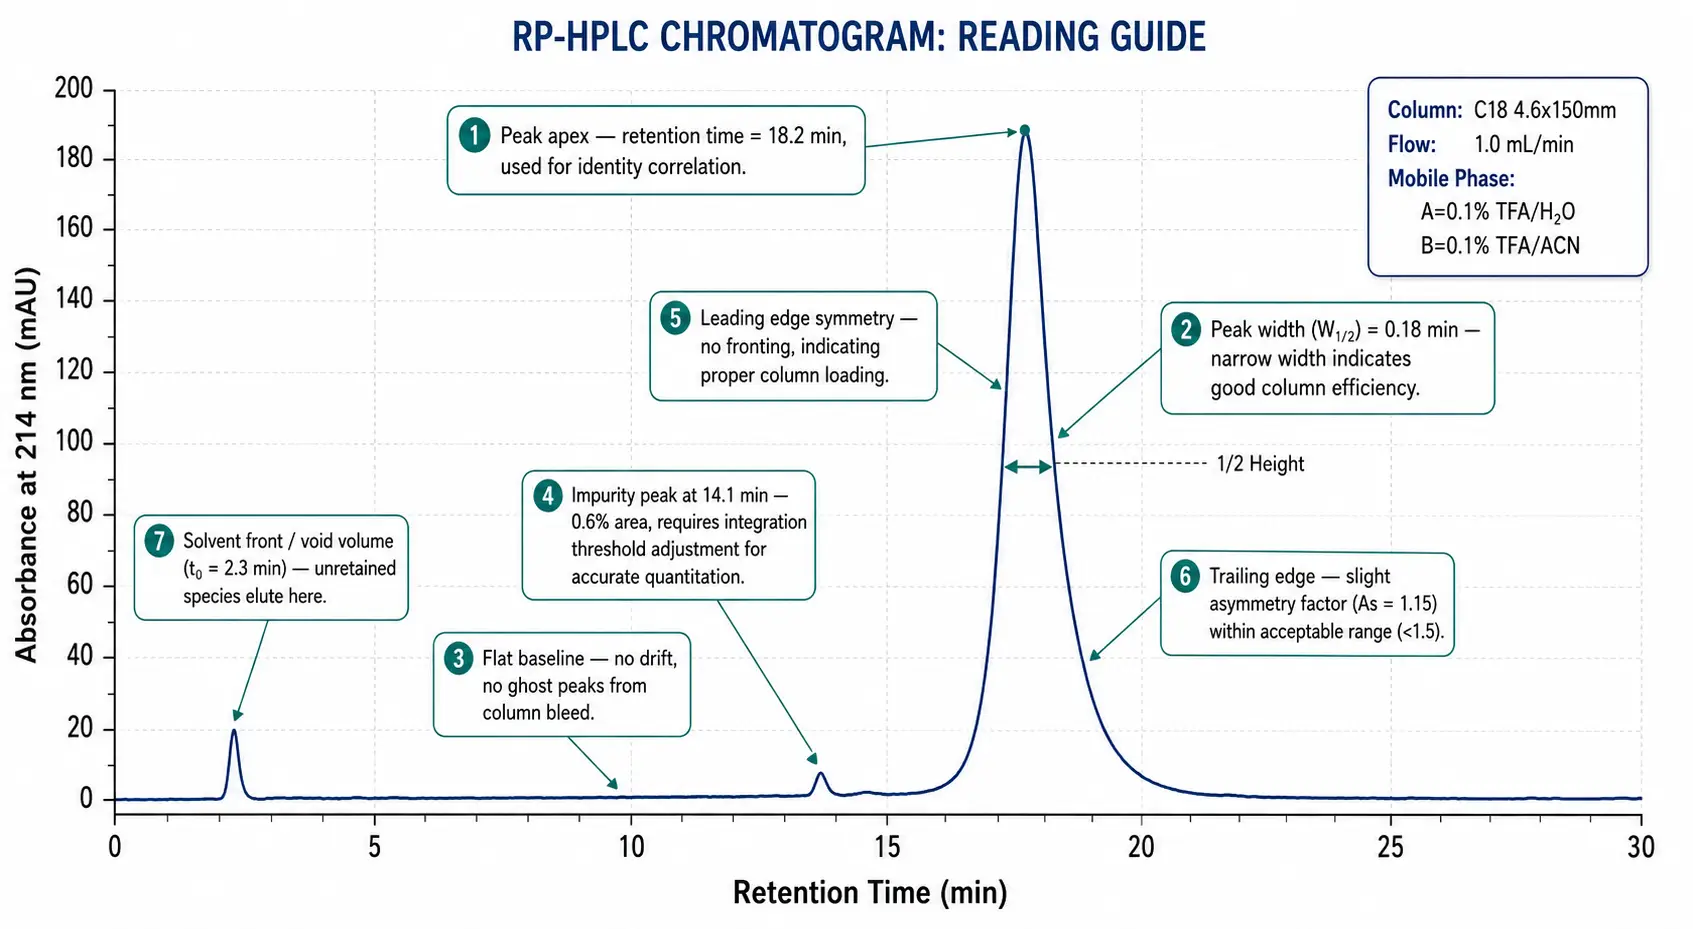
A well-behaved peptide produces a single, symmetrical peak with a Gaussian shape and a width at half-height of 0.1-0.3 minutes on a standard 4.6 x 150 mm column. Shoulders on the leading or trailing edge suggest co-eluting species — often deletion peptides (missing one or more residues) that are slightly more or less hydrophobic than the target sequence. Fronting peaks can indicate column overload; tailing peaks often point to silanol interactions with basic residues (Arg, Lys, His) that can be mitigated by including 0.1% TFA as an ion-pairing agent.
Figure 1: RP-HPLC Chromatogram Comparison — Pure vs. Impure Synthetic Peptide

The integration itself deserves attention. Most CDS (chromatography data system) software auto-integrates, but default parameters can miss small peaks or split a shoulder into an artifact. A manual inspection of the baseline and integration thresholds should be part of every purity assessment.
The TFA Trade-Off — Resolution vs. MS Compatibility
Trifluoroacetic acid (TFA) at 0.1% (v/v) is the standard mobile phase modifier for peptide RP-HPLC because it protonates residual silanols on the stationary phase and forms ion pairs with basic side chains, dramatically improving peak shape for lysine- and arginine-rich peptides. However, TFA suppresses electrospray ionization (ESI) signal in LC-MS by forming strong gas-phase ion pairs with peptide cations — a problem when you want to couple your HPLC to a mass spectrometer.
The practical compromise: for UV-only HPLC purity analysis, use 0.1% TFA. For LC-MS, switch to 0.1% formic acid (FA), which is volatile and MS-friendly. If you need both high resolution and MS compatibility, difluoroacetic acid (DFA) at 0.05-0.1% is emerging as a middle ground — it provides better peak shape than formic acid while causing less ion suppression than TFA.
Figure 2: 3D Cutaway Cross-Section of an HPLC Column — Reversed-Phase Separation Mechanism
Purity Is Not Content
This is the single most misunderstood concept in peptide characterization, and it deserves its own heading.
Chromatographic purity (area %) answers: "Of the UV-absorbing material that eluted from this column, what fraction belongs to the main peak?" It does not answer: "How much actual peptide is in this vial?"
Net peptide content is determined by amino acid analysis (AAA) or elemental nitrogen analysis and accounts for everything the HPLC does not see: water (typically 5-15% by weight in lyophilized peptides), residual TFA or acetate counterions (10-25%), and non-UV-absorbing contaminants. The actual usable peptide mass in a vial is:
Actual peptide = Gross weight x HPLC purity (%) x Net peptide content (%)
A 10 mg vial of peptide with 98% HPLC purity and 80% net peptide content contains only 7.84 mg of usable peptide. The remaining 2.16 mg is water, salts, and counterions. For cell-based assays where precise dosing matters, ignoring this distinction can introduce a 20% error in effective concentration.
LC-MS — Identity Confirmation and Beyond
If RP-HPLC answers "how pure," LC-MS answers "what is it — and what else is in there."
Intact Mass Confirmation — Your Peptide's Fingerprint
The first and most essential LC-MS experiment for any synthetic peptide is intact mass measurement. The peptide is infused or injected onto a short C18 column, ionized by electrospray (ESI), and analyzed by high-resolution mass spectrometry (HRMS). Because peptides carry multiple charge states in ESI — typically [M+2H]2+, [M+3H]3+, and [M+4H]4+ for peptides of 1-4 kDa — the raw spectrum shows a charge state envelope. Deconvolution software collapses this envelope to the zero-charge molecular weight (the monoisotopic mass).
For a peptide of ~2,000 Da analyzed on a Q-TOF or Orbitrap instrument capable of<5 ppm mass accuracy, the measured monoisotopic mass should match the theoretical mass within 10 ppm (0.02 Da at 2,000 Da). A deviation greater than 20 ppm warrants investigation — common causes include missed deamidation (+1 Da), oxidation (+16 Da), or an unexpected salt adduct. A deviation of a whole amino acid residue mass (~57-186 Da) suggests a synthesis error.
Impurity Identification by LC-MS — Naming What HPLC Cannot
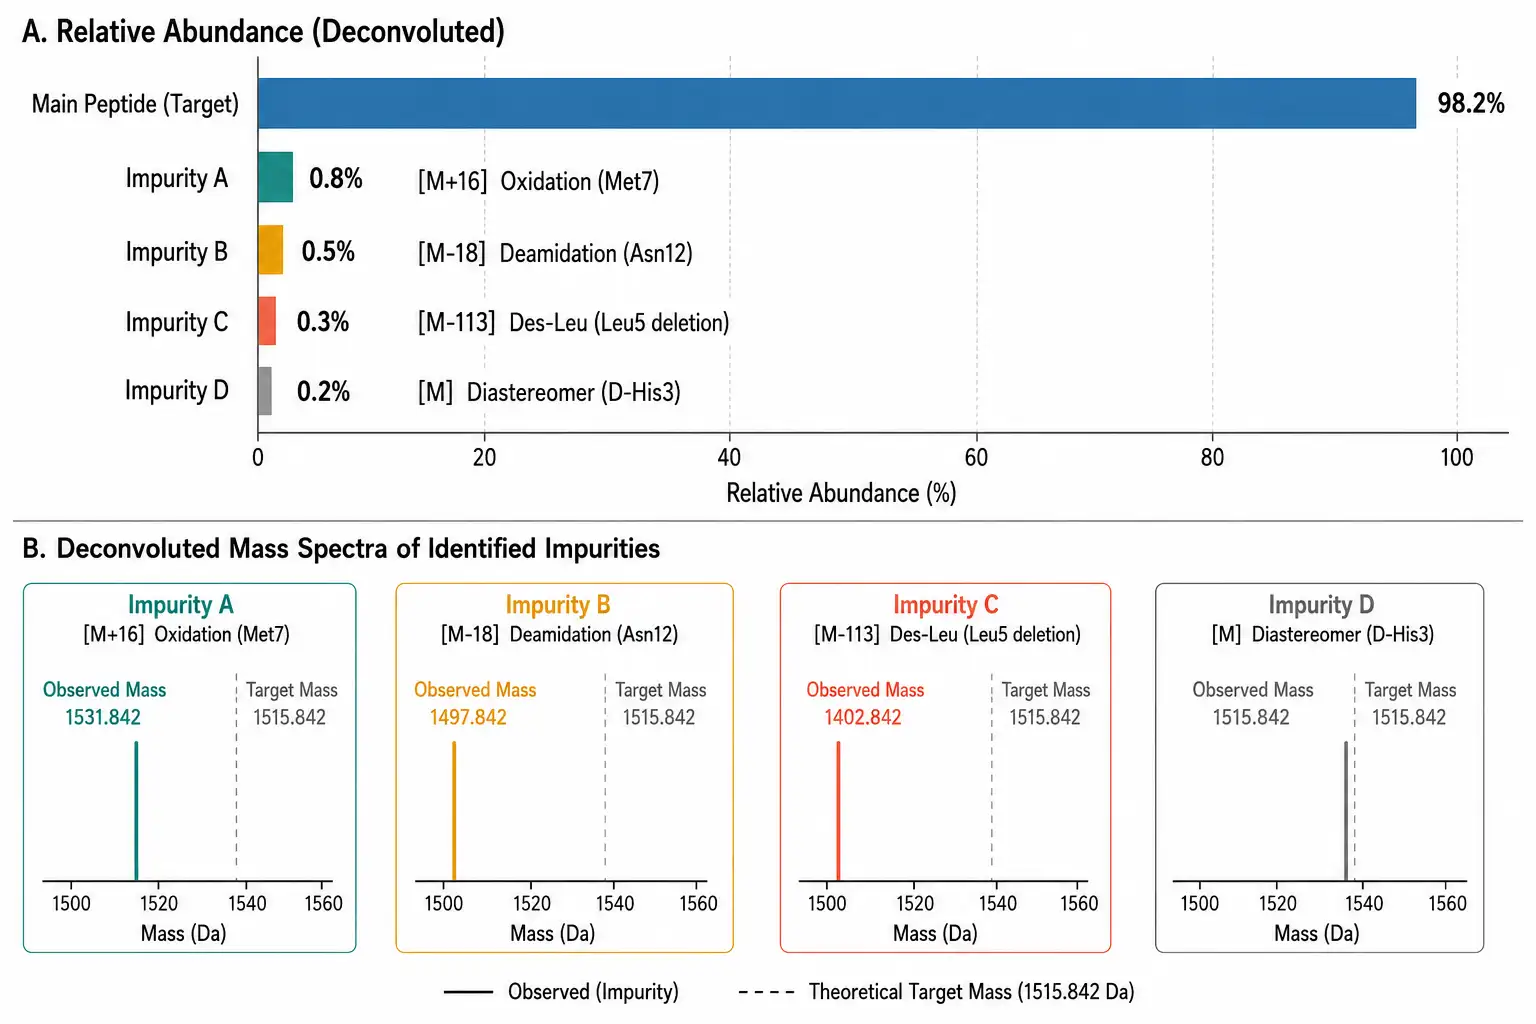
The real power of LC-MS emerges when you look beyond the main peak. In a typical synthetic peptide, RP-HPLC might show the main peak at 98% area with 2-3 small impurity peaks. LC-MS can identify each one:
- The +16 Da impurity is likely an oxidized methionine or tryptophan. If the peptide contains multiple Met residues, MS/MS fragmentation can pinpoint which one. - The -18 Da impurity (relative to the main peak) typically indicates deamidation of asparagine to aspartic acid (via cyclic imide intermediate) or aspartimide formation — especially common in sequences containing Asp-Gly, Asn-Gly, or Asp-Ser motifs. - Impurities with mass shifts corresponding to single amino acid deletions (e.g., -113 Da for Ile/Leu, -57 Da for Gly) indicate incomplete coupling during solid-phase synthesis — particularly likely at sterically hindered positions or after hydrophobic stretches. - Diastereomers (epimers) have identical mass to the target peptide and cannot be distinguished by MS alone. These require chiral chromatography or ion mobility spectrometry (IMS) for separation.
Figure 3: Impurity Profile Bar Chart with Mass Spectrometry Identification
MS/MS Peptide Mapping — Proving the Sequence
For peptides longer than ~15 amino acids or those destined for publication-quality structural biology, intact mass alone is insufficient. MS/MS (tandem mass spectrometry) fragments the peptide along the backbone — typically by collision-induced dissociation (CID), which preferentially cleaves amide bonds to generate b-ions (N-terminal fragments) and y-ions (C-terminal fragments). For labs without in-house high-resolution MS/MS capability, peptide mapping services and MS/MS-based sequencing provide complete sequence coverage analysis with b- and y-ion assignment.
A complete MS/MS spectrum covering >90% of the expected b- and y-ion series provides sequence-level confirmation that every amino acid is in the right position. A gap in the ion series at a particular residue flags a possible substitution. For disulfide-containing peptides, comparing MS/MS spectra before and after reduction with DTT or TCEP confirms the disulfide connectivity pattern — a critical quality attribute for bioactive peptides where mispairing destroys activity.
For unusually long (>5 kDa) or heavily modified peptides, electron-transfer dissociation (ETD) is preferred over CID because it preserves labile post-translational modifications during fragmentation and provides more uniform sequence coverage.
Orthogonal Methods — When One Technique Is Not Enough
Figure 4: Orthogonal Multi-Method Peptide Characterization Workflow
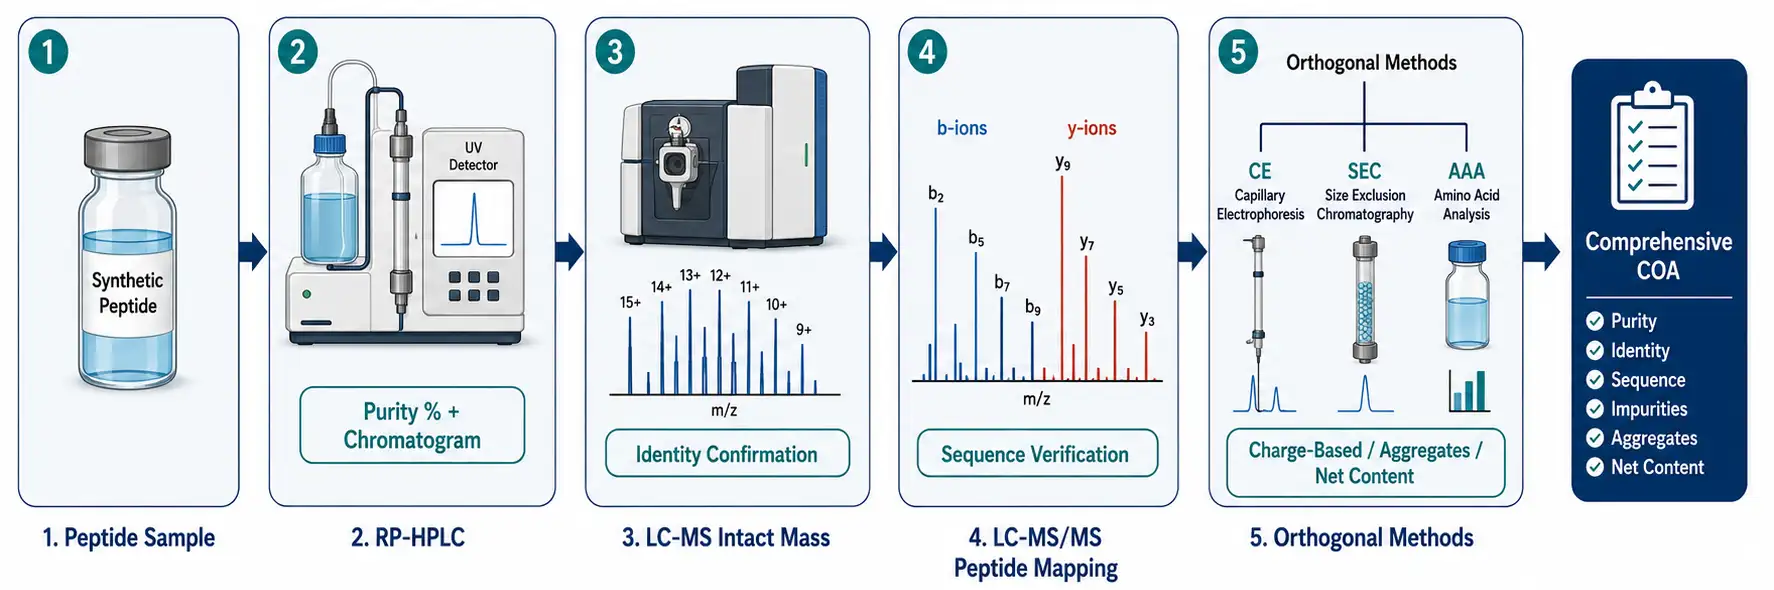
ICH Q6B and the 2025 EMA guideline on synthetic peptides both mandate at least two orthogonal analytical techniques for identity confirmation. Orthogonal means they separate or detect based on different physicochemical properties — so what one method misses, the other catches.
Capillary Electrophoresis (CE) — Charge-Based Separation
CE separates peptides based on their charge-to-mass ratio rather than hydrophobicity, making it genuinely orthogonal to RP-HPLC. A peptide that co-elutes with its deamidation product on C18 (both are similarly hydrophobic) will often separate cleanly by CE because the deamidation converts a neutral amide to a charged carboxylate, shifting the electrophoretic mobility. CE is particularly valuable for peptides rich in acidic (Asp, Glu) or basic (Lys, Arg, His) residues, where charge differences between the target and impurities are pronounced.
Hydrophilic interaction liquid chromatography (HILIC) offers another orthogonal separation dimension that is less widely used but highly complementary to RP-HPLC. Where RP-HPLC separates by hydrophobicity, HILIC separates by hydrophilicity — making it particularly effective at resolving impurities that co-elute on C18. Orthogonality studies have demonstrated that RP-HPLC and HILIC are mutually orthogonal for cyclic peptide impurity profiling, with most impurity classes showing opposite retention behavior on the two columns, and that combining both methods yields the most robust purity assessment.
Size-Exclusion Chromatography (SEC) — Catching the Aggregates
Peptide self-association — dimerization, oligomerization, or aggregation — produces species invisible to both RP-HPLC (the organic mobile phase dissociates non-covalent aggregates) and LC-MS (the ionization process disrupts weak interactions). SEC uses an aqueous mobile phase and separates by hydrodynamic radius, directly detecting dimers and higher-order aggregates that would otherwise go unnoticed. For peptides intended for in vivo studies, aggregate content matters because aggregates can trigger immunogenicity even when the monomeric peptide is non-immunogenic.
Amino Acid Analysis (AAA) — The Gold Standard for Content
AAA provides the net peptide content independent of chromatographic behavior. The peptide is hydrolyzed to its constituent amino acids (typically 6M HCl, 110 degrees C, 24 hours), which are then derivatized and quantified against amino acid standards. The result tells you exactly how many nanomoles of each amino acid are present — and from that, the absolute peptide concentration. AAA is the referee when HPLC purity and observed bioactivity do not agree.
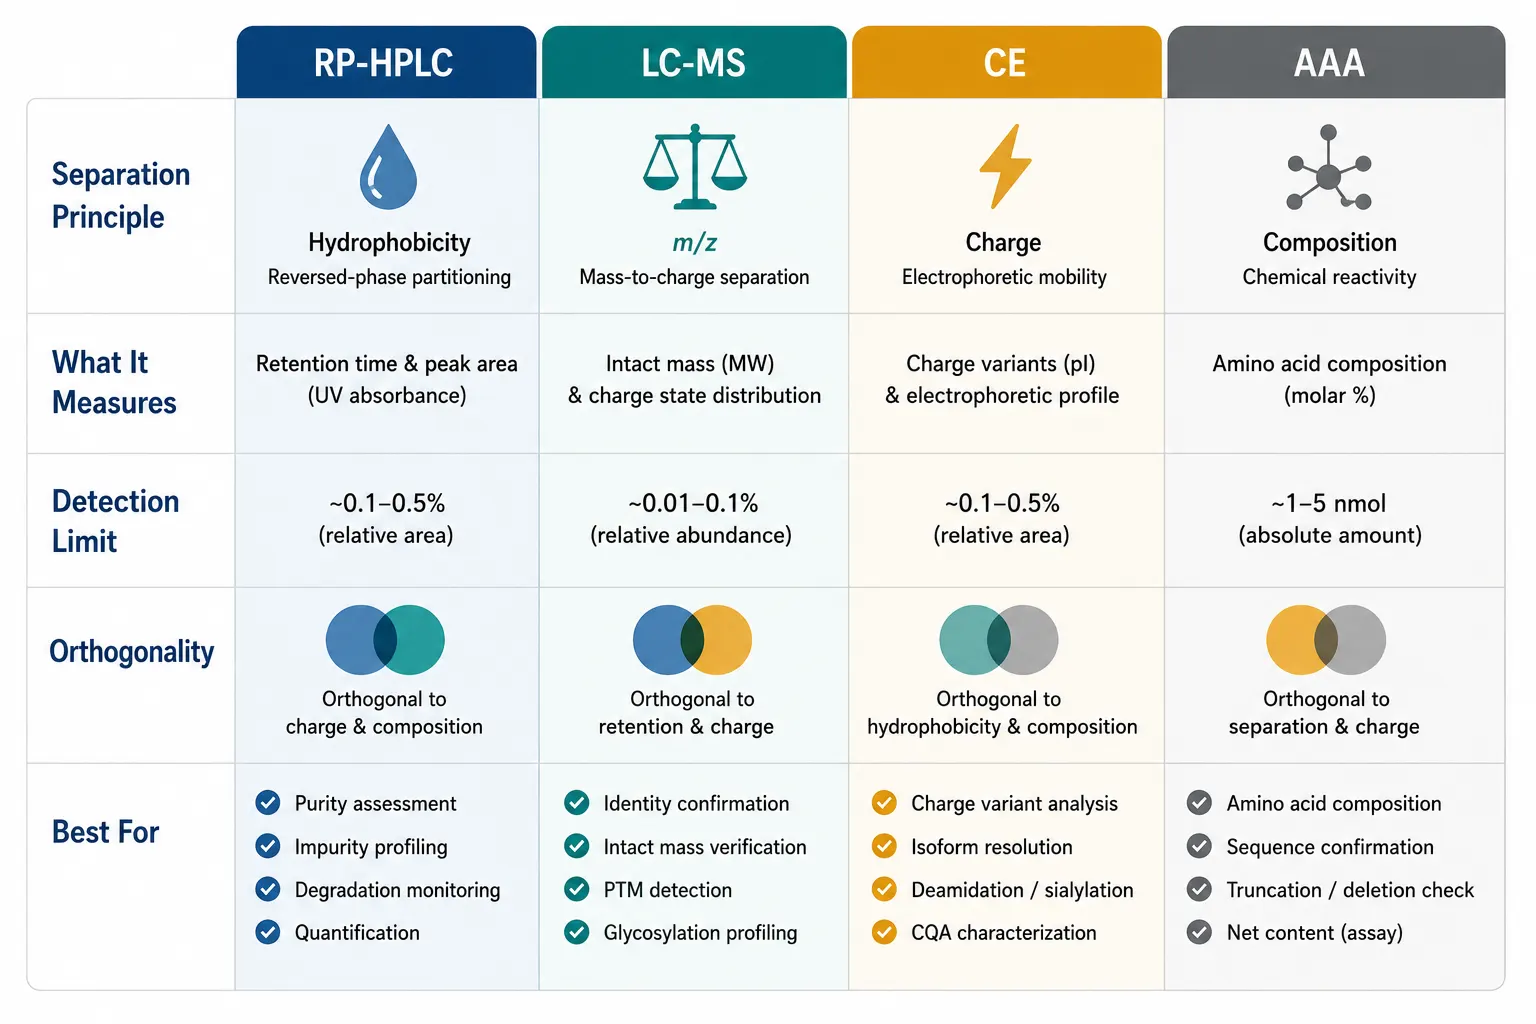
Figure 5: Analytical Method Comparison Table — RP-HPLC vs LC-MS vs CE vs AAA
Reading a Peptide Purity Report — A Practical Guide
Most CROs and peptide suppliers provide a Certificate of Analysis (COA) with each batch. Here is how to read one critically, section by section.
The HPLC Trace
Look for three things beyond the purity number. First, verify the detection wavelength — purity calculated at 214 nm (peptide bond) is standard; purity at 254 nm (aromatic side chains) may differ if impurities lack aromatic residues. Second, check for a blank injection or blank subtraction — residual TFA or solvent peaks that were subtracted should be noted. Third, examine the vertical scale: if the main peak is off-scale (truncated at the top), the integration was performed on a saturated detector signal and the area is unreliable.
The Mass Spectrum
The raw ESI spectrum should show a clean charge-state envelope without unexplained adduct peaks. Sodium adducts (+22 Da per Na+) are common in low-quality spectra and indicate insufficient desalting. Potassium adducts (+39 Da) suggest glassware contamination. If the deconvoluted mass differs from the theoretical mass, the COA should explain why — not just report the number.
The Peptide Content Section
If a COA reports only HPLC purity and omits peptide content, ask why. For lyophilized peptides, a content determination (by AAA, elemental analysis, or UV spectrophotometry) is essential for quantitative work. Without it, any concentration calculation based on gravimetric methods assumes the entire powder mass is peptide — which it never is.
Residual Solvent and Counterion Data
TFA content should be reported for TFA-salt peptides, typically in the range of 10-25% by weight. Acetate salts contain less residual counterion (5-15%). Residual acetonitrile, DMF, or dichloromethane should be below ICH Q3C limits for the intended use. If these data are missing from the COA, the peptide has not been fully characterized.
Putting It All Together — A Mini COA Walkthrough
Consider a typical COA for a 15-amino acid synthetic peptide ordered for a dose-response study:
| Parameter | Reported Value | What It Really Means |
|---|---|---|
| HPLC Purity (214 nm) | 97.8% | Strong. The main peak accounts for nearly all UV-absorbing material. |
| LC-MS Intact Mass | Measured 1789.92 Da / Theoretical 1789.95 Da | Δ = 17 ppm — within the<20 ppm acceptance window. Identity confirmed. |
| MS/MS Sequence Coverage | 94% b/y ions | Publication-grade. Only 1 gap in the ion series; the sequence order is verified. |
| Net Peptide Content (AAA) | 82.3% | This is the critical number. Only 82.3% of the powder mass is peptide. |
| TFA Content | 15.8% | Expected for a TFA-salt peptide. Accounts for most of the non-peptide mass. |
| Water Content (KF) | 4.2% | Residual moisture — typical for lyophilized peptide. |
What this COA is really telling you: the chromatographic purity is strong (97.8%), the mass confirms the correct peptide with high accuracy (<20 and="" the="" ms="" coverage="" is="" publication-grade="">90%). However, the net peptide content of 82.3% means a 10 mg vial contains only ~8.0 mg of actual peptide. If you reconstitute the entire vial in 1 mL of buffer and assume a 10 mg/mL stock, your true concentration is ~8.0 mg/mL — a 20% error that propagates through every downstream dilution. For the dose-response study this peptide was ordered for, that 20% offset could shift every EC50 value on the plate.
Figure 6: Annotated Chromatogram Reading Guide with Diagnostic Callouts
Common Pitfalls and Troubleshooting
Pitfall 1 — Assuming a Single Peak Means a Pure Peptide
Two peptides with identical or near-identical retention times will co-elute as a single chromatographic peak. The classic example is the deamidation of Asn to Asp: the mass changes by +1 Da (easily resolved by HRMS) but the retention time shift on C18 is often negligible. Result: a single, symmetrical HPLC peak that LC-MS reveals to be a mixture of parent and deamidated peptide. Always pair HPLC with MS.
Pitfall 2 — Overlooking Diastereomer Contamination
Epimerization at the alpha-carbon during SPPS coupling generates D-amino acid-containing diastereomers. Because diastereomers have identical mass and often very similar hydrophobicity to the parent peptide, they are invisible to both standard RP-HPLC and MS. Detection requires chiral chromatography, ion mobility spectrometry, or Marfey's analysis (amino acid derivatization with chiral reagent followed by HPLC). For bioactive peptides, even 1-2% D-epimer contamination can confound activity assays, because the D-containing impurity is often a potent antagonist.
Pitfall 3 — Buffer and Solvent Artifacts
Ghost peaks that appear in blank injections point to contaminated mobile phases or leaching from column packing. Peaks that grow with sample aging suggest on-column degradation or oxidation during analysis. If a fresh peptide solution shows impurities absent from a solution prepared hours earlier, re-prepare and re-run — the impurities may be artifacts of sample handling, not synthesis products.
Pitfall 4 — Miscalculating the Actual Peptide Concentration
Researchers routinely reconstitute "10 mg of peptide" in buffer and calculate a concentration assuming all 10 mg is peptide. The real concentration may be 20-30% lower. The correct calculation uses net peptide content: weigh the vial contents, multiply by HPLC purity, multiply by net peptide content, and divide by the reconstitution volume. For critical quantitative work, measure the peptide concentration directly by UV absorbance at 280 nm (if Trp or Tyr is present) or by quantitative amino acid analysis.
Pitfall 5 — Using the Wrong Purity for the Wrong Application
A peptide of 95% HPLC purity is adequate for ELISA and most Western blot applications. For NMR structure determination, 98% or higher is standard — residual impurities produce extraneous peaks that complicate resonance assignment. For crystallography, >99% is ideal because impurities disrupt crystal packing. Match the purity specification to the application, and recognize that higher purity costs more — often exponentially as you approach >99%.
Selecting the Right Analytical Strategy for Your Peptide
There is no one-size-fits-all characterization package. The analytical depth should match the peptide's intended use, length, and sequence complexity.
Minimal Viable Characterization (Routine Research Peptides,<20 AA)
RP-HPLC at 214 nm + ESI-MS intact mass confirmation. This combination confirms that the major chromatographic peak contains the correct-mass peptide and identifies gross impurities. Adequate for peptides used in ELISA, Western blot, or preliminary screening assays. Cost: low. Turnaround: fast.
Standard Characterization (Bioassay Peptides, 15-40 AA)
Add MS/MS peptide mapping (sequence confirmation) and amino acid analysis (net peptide content). MS/MS confirms the amino acid sequence order; AAA provides the concentration correction factor for quantitative bioassays. This package is appropriate for peptides used in dose-response studies, cell-based functional assays, and in vivo pharmacokinetic experiments.
Comprehensive Characterization (Structural Biology / Therapeutic Leads)
Add capillary electrophoresis (orthogonal purity), SEC (aggregate content), and quantitative impurity identification with HRMS. For disulfide-containing peptides, add differential MS/MS (reduced vs. non-reduced) to verify disulfide pairing. For peptides destined for structural studies (NMR, X-ray crystallography) or IND-enabling preclinical work, this level of characterization is the minimum expectation from most reviewers and collaborators.
When to Outsource vs. Characterize In-House
For most academic labs, the standard characterization package — RP-HPLC plus intact mass confirmation — is accessible with shared core facility instrumentation. MS/MS peptide mapping and amino acid analysis typically require specialized expertise and are commonly outsourced to a dedicated CRO. We provide integrated peptide characterization services covering the full analytical pipeline — from intact mass determination and sequence verification through to comprehensive COA documentation — with each batch delivered with both chromatographic purity data and net peptide content determination so you know exactly how much usable peptide is in the vial.
FAQ
What purity level do I actually need for my experiment?
For ELISA and Western blot: >= 95%. For cell-based assays and dose-response studies: >= 98%. For NMR or crystallography: >= 99%. These are guidelines, not absolutes — the functional impact of impurities depends on their identity, not just their quantity.
My peptide shows 98% purity by HPLC but the mass spectrum shows multiple species. Which do I trust?
Trust the mass spectrum. HPLC purity refers to one peak that may contain multiple co-eluting species. LC-MS can reveal that a seemingly pure HPLC peak is actually a mixture. The mass spectrum is the more information-rich measurement.
Why does my peptide's measured mass differ from the theoretical mass by 1 Da?
A +1 Da mass shift is most commonly deamidation (Asn to Asp, or Gln to Glu). Both are spontaneous non-enzymatic processes accelerated at elevated pH and temperature. If the +1 Da species grows over time in solution, deamidation during handling is confirmed. Check your storage buffer pH — acidic conditions (pH 3-5) slow deamidation.
Can I use the same HPLC method for all my peptides?
Not without adjustment. Peptides with high hydrophobic content (>50% Leu, Ile, Val, Phe, Trp) may require a higher organic solvent endpoint or a shallower gradient. Highly hydrophilic peptides (<25% hydrophobic residues) may elute in the void volume on a standard C18 gradient and benefit from a C8 or polar-embedded column. Each peptide deserves method optimization — or at minimum, a scouting gradient.
What is the difference between TFA salt and acetate salt forms?
Peptides cleaved from the resin with TFA-containing cocktails are isolated as TFA salts, with TFA acting as the counterion for basic residues. Acetate salts are prepared by salt exchange (ion-exchange chromatography or repeated lyophilization from acetic acid). Acetate salts are preferred for cell-based assays because TFA can be cytotoxic at concentrations above 0.1%. The salt form does not affect chromatographic purity but does affect peptide content and bioactivity.
Why do some impurity peaks only appear after I store the peptide in solution for a few days?
These are degradation products, not synthesis impurities. Oxidation of methionine to methionine sulfoxide, deamidation of asparagine, and diketopiperazine formation at N-terminal dipeptide sequences are common storage-related degradation pathways. For peptides prone to degradation, aliquot and store lyophilized at -20°C or -80°C, and prepare fresh solutions immediately before use.
Is LC-MS/MS necessary for short peptides (<10 amino acids)?
Not always. For very short peptides, the intact mass measurement alone is often sufficiently diagnostic — there are fewer possible sequence permutations at short lengths. However, if the peptide contains isobaric residues (Leu/Ile, Lys/Gln at low resolution), or if you need to confirm the position of a modification within the sequence, MS/MS is still warranted regardless of length.
How do I verify the disulfide bond pattern in my cyclic peptide?
Compare reduced vs. non-reduced MS/MS spectra. Under non-reducing conditions, disulfide-linked fragments remain connected and produce unique fragment masses that reveal the pairing topology. Alternatively, perform partial reduction with TCEP at low pH followed by alkylation with N-ethylmaleimide — the sequential alkylation pattern maps the disulfide connectivity.
References:
- Al Musaimi O, Jaradat DMM. Advances in therapeutic peptides separation and purification. Separations. 2024;11(8):233. (CC BY 4.0)
- Goyon A, Wang S, Hofmann K, Nguyen DN, Yehl P, Zhang K. Unified and versatile multiplex platform for expedited method development and comprehensive characterization of therapeutic peptides. Analytical Chemistry. 2024;96:14011-14019. (CC BY 4.0)
- Millán-Martín S, Jakes C, Carillo S, Gallagher L, Scheffler K, Broster K, Bones J. Multi-attribute method (MAM): an emerging analytical workflow for biopharmaceutical characterization, batch release and cGMP purity testing at the peptide and intact protein level. Critical Reviews in Analytical Chemistry. 2024;54(8):3234-3251. (CC BY 4.0)
- Cheng Y, Zhang Y, Wang S, et al. Determination of related substances in disulfide-rich peptide ziconotide by establishing tandem mass spectrometry methods. Journal of Pharmaceutical Analysis. 2024;14(10):101037. (CC BY 4.0)
- Purohit K, Reddy N, Sunna A. Exploring the potential of bioactive peptides: from natural sources to therapeutics. International Journal of Molecular Sciences. 2024;25(3):1391. (CC BY 4.0)













