

Introduction: The Rare-Cell Challenge in Spatial Biology
The Heterogeneity Bottleneck: Resolving Micro-Niches Within Complex Tissues
Tissues are highly organized, multi-cellular architectural networks where rare, functionally distinct cell subpopulations dictate overall disease pathology, therapeutic resistance, and microenvironmental homeostasis. In clinical oncology, critical biological drivers—such as invasive tumor fronts, tumor-infiltrating lymphocyte (TIL) subpopulations, tertiary lymphoid structures, and therapy-resistant stem-like niches—often represent less than 1% to 5% of the total tissue volume. Similarly, in neurodegenerative, cardiovascular, and nephrological disorders, key disease drivers are confined to localized micro-anatomical structures, such as single renal glomeruli, neurofibrillary tangles, arterial microvascular endothelial units, or localized immune cell clusters. Traditional bulk tissue homogenization averages molecular signals across millions of heterogeneous cells, completely obscuring these critical rare-cell phenotypes under the overwhelming background noise of surrounding healthy stroma or necrotic debris.
For example, in glioblastoma and triple-negative breast cancer (TNBC) microenvironment studies, bulk transcriptomics and proteomics routinely fail to capture localized signaling cascades occurring at the invasive tumor-stroma interface. Single-cell RNA sequencing (scRNA-seq) offers single-cell resolution but requires tissue dissociation into single-cell suspensions, which destroys spatial architecture and induces cell-stress gene expression artifacts. Laser Capture Microdissection (LCM) bridges this gap by isolating intact rare cells directly from frozen or formalin-fixed paraffin-embedded (FFPE) tissue sections while retaining complete micro-anatomical context.
The Sensitivity vs. Spatial Depth Trade-off
While whole-section spatial technologies—such as Matrix-Assisted Laser Desorption/Ionization Mass Spectrometry Imaging (MALDI-MSI), spatial transcriptomics, or multiplexed immunofluorescence (mIF)—provide broad spatial architecture, they are inherently constrained by measurement sensitivity or target multiplexing limits:
- Surface Sensitivity Limitations: Direct mass spectrometry imaging desorbs molecules from thin surface layers (100–300 nm), typically detecting 100 to 500 high-abundance peptides or lipids per voxel due to ion suppression, ionization competition, and limited desorption sample volume per laser shot.
- Antibody Multiplexing Limits: Fluorescence-based spatial proteomics and transcriptomics require pre-selected antibody/probe panels, preventing unbiased, hypothesis-free discovery and missing unexpected protein isoforms, post-translational modifications, or truncated proteoforms.
Laser Capture Microdissection (LCM) coupled with ultrasensitive mass spectrometry resolves this fundamental trade-off. By physically isolating defined regions of interest (ROIs)—ranging from 100 to 1,000 targeted cells—LCM isolates pure, homogeneous cellular subpopulations, enabling deep, unbiased proteomic coverage of over 3,000 to 4,000 quantified proteins without bulk tissue dilution or stromal noise.
High-Throughput Spatial Profiling vs. Targeted Cell Dissection
Designing a successful, decision-ready spatial biology experiment requires aligning technical strengths across complementary analytical platforms:
- Whole-Section Spatial Screening: Utilizing MALDI-MSI or digital histology imaging across entire tissue sections to identify phenotypic heterogeneity, map spatial domain clusters, and define candidate micro-niches across entire patient tissue blocks.
- Targeted Microdissection & Low-Input MS: Using LCM to physically harvest specific cell populations identified during initial screening, followed by ultrasensitive nanoLC-MS/MS for deep pathway interrogation and biomarker discovery.
Leveraging specialized LCM-Guided Spatial Proteomics Service and MS-based Spatial Proteomics Service workflows ensures seamless integration between histological selection and low-input mass spectrometry.
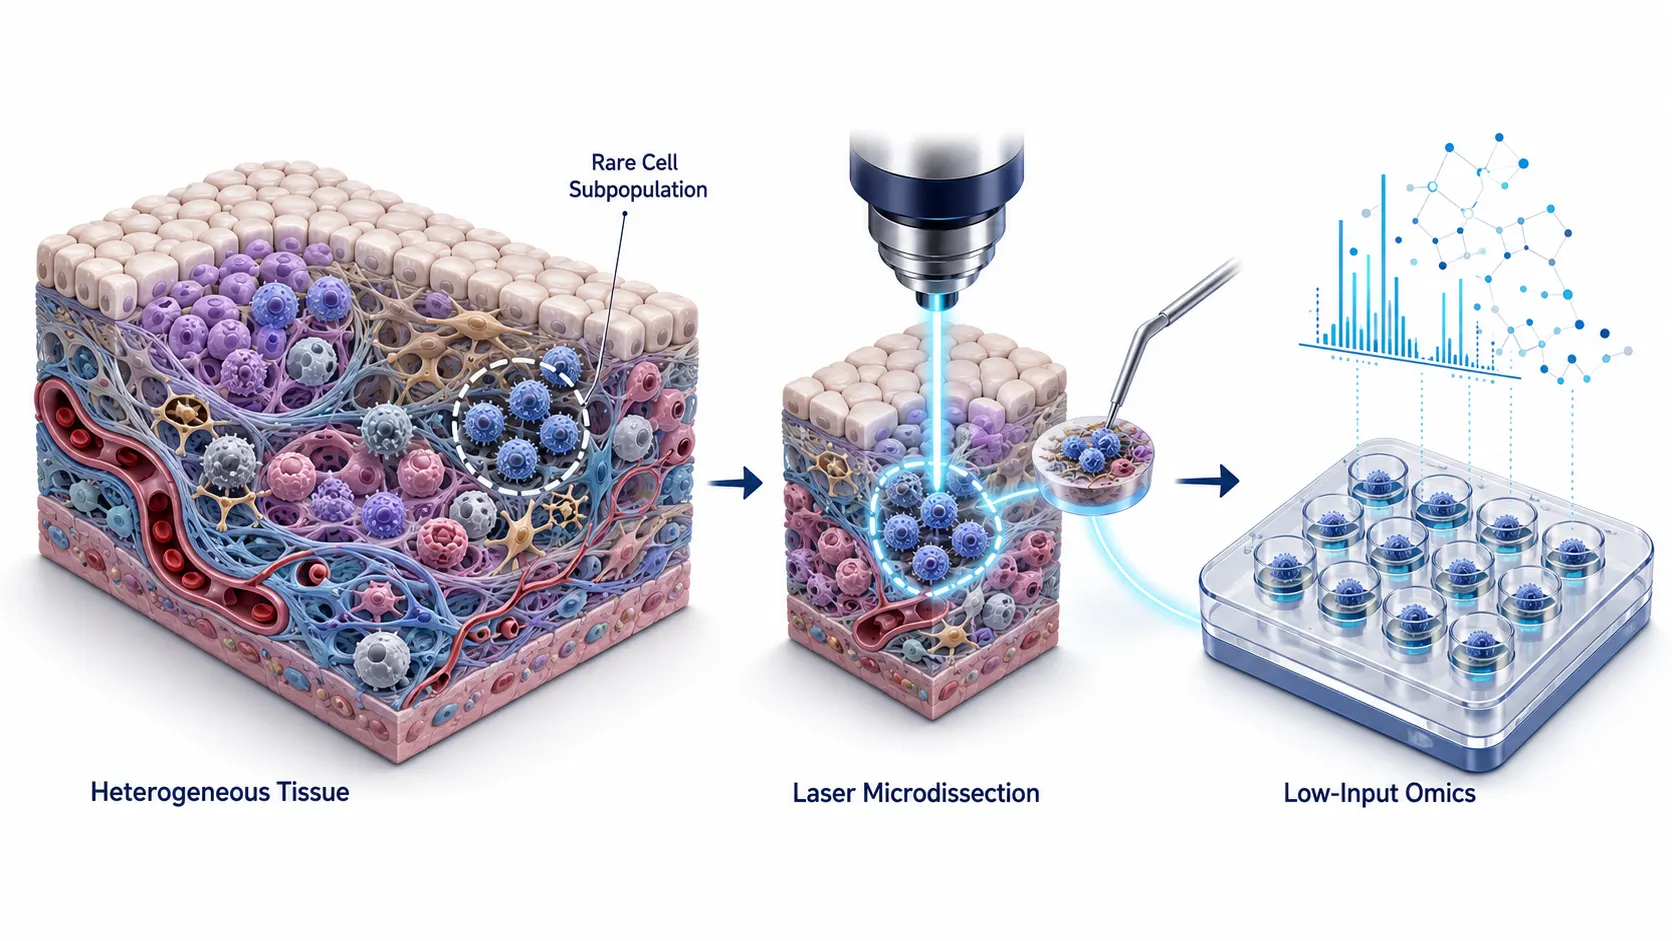 Figure 1: Rare-Cell Heterogeneity and Spatial Isolation Landscape
ROI Selection & Multimodal Guidance Modalities
Histological & Immunofluorescent Guidance: H&E, PAS, Toluidine Blue, and mIF
Defining exact cellular boundaries for microdissection requires high-contrast visual or molecular guidance under optical microscopy:
- Rapid Histological Staining SOPs: Standard Hematoxylin and Eosin (H&E), Periodic Acid-Schiff (PAS), Toluidine Blue, Methyl Green, or Cresyl Violet staining provides fine structural visualization (e.g., distinguishing glomeruli, fibrotic tracts, or necrotic zones). Staining protocols must be strictly adapted for low-input proteomics by using ice-cold, short-duration aqueous dye steps (<10–15 s) followed by rapid dehydration in 70%, 95%, and 100% ethanol baths. Minimizing aqueous exposure prevents the leaching of soluble cytosolic enzymes (such as GAPDH, lactate dehydrogenase, and metabolic kinases) and halts post-mortem autolysis.
- Multiplexed Immunofluorescence (mIF) / Fluorescent LCM: Fluorescently labeled antibodies guide high-precision laser dissection of specific immune or cell-surface phenotypes directly under a fluorescent microdissection microscope, enabling targeted single-cell subpopulation harvest without non-target background contamination.
Mass Spectrometry Imaging-Guided Dissection (MSI-LCM)
An advanced multimodal approach utilizes prior MALDI-MSI intensity heatmaps to define microdissection boundaries on the same physical section:
- Spatial Matrix Overlay: Following whole-section spatial metabolomics or lipidomics imaging, the mass spectrometry intensity maps are digitally overlaid onto the optical microscope stage using high-precision spatial co-registration matrices.
- Phenotype-Guided Dissection: The LCM laser micro-cuts specific metabolic clusters—such as lactate-high hypoxic cores, ATP-rich proliferating tumor rims, or lipid-rich invasive margins—enabling direct correlation between spatial metabolomics and downstream LC-MS/MS deep proteomics on the exact same tissue section.
AI-Assisted Automated ROI Pattern Recognition
Modern LCM platforms integrate deep learning image segmentation algorithms (e.g., S2-omics, Deep Visual Proteomics, or Cellpose segmentation) to automatically identify, outline, and calculate total surface area for thousands of rare cells across large tissue sections:
- High-Throughput Segmentation: Neural networks extract morphological features from high-resolution digital slide scans, segmenting single cell nuclei and cell membranes in real time.
- Automated Dissection Robotics: Motorized microscope stages automatically position the UV laser along segmented cell boundaries, cutting thousands of isolated cells per hour with zero operator fatigue and zero subjective bias.
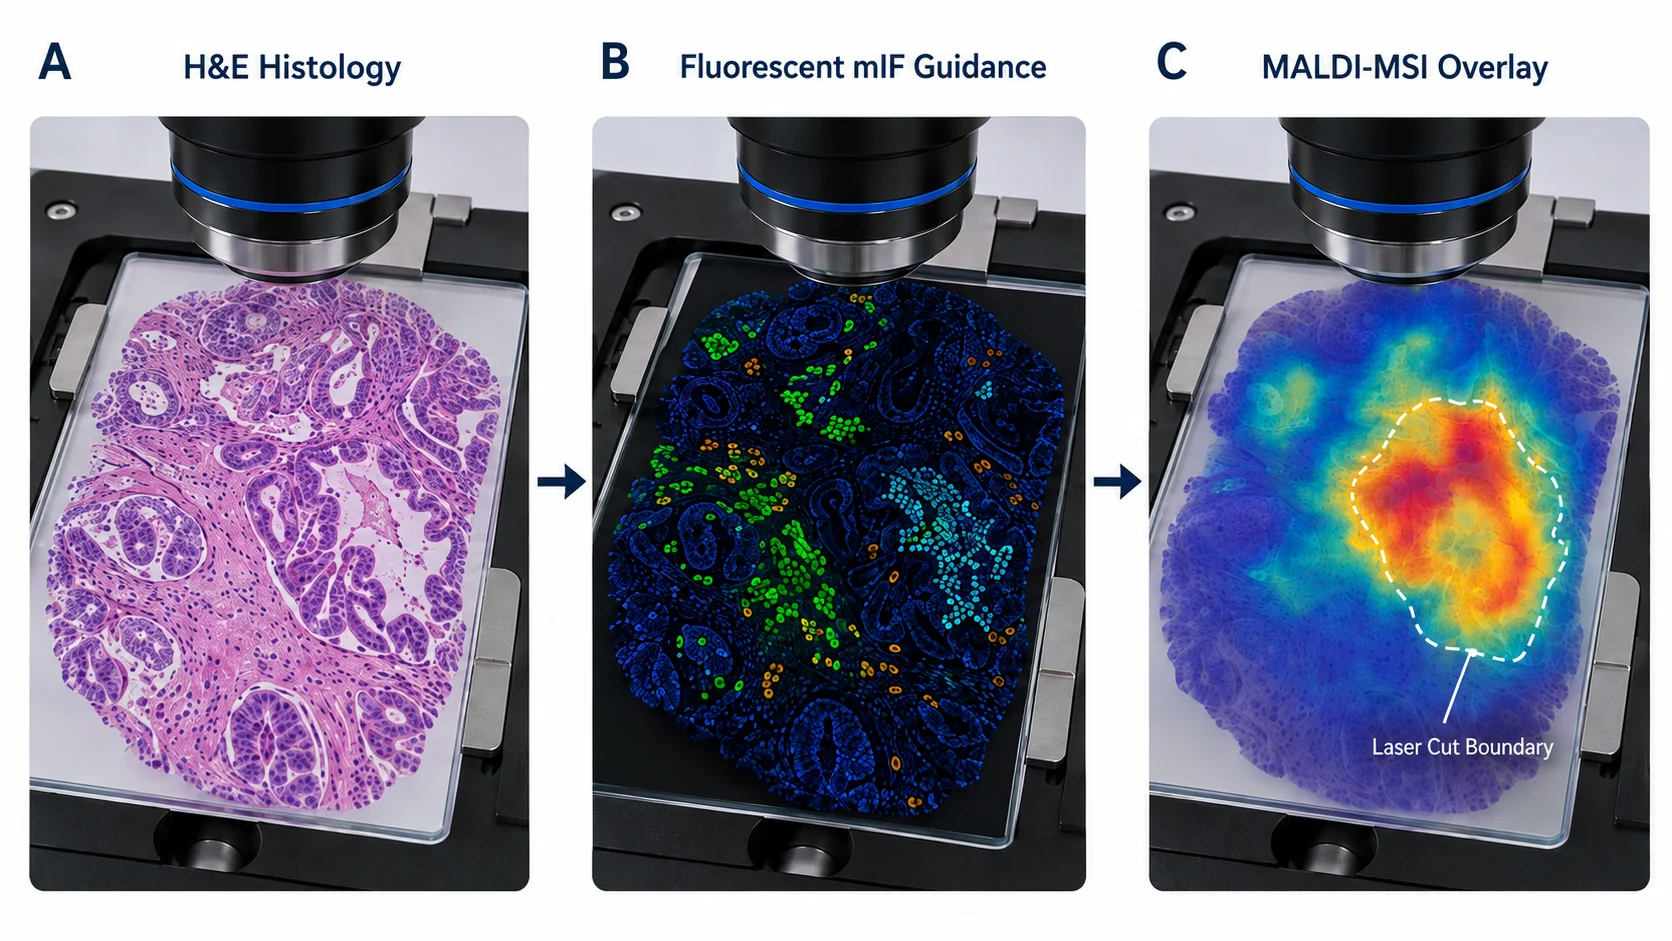 Figure 2: Multimodal ROI Selection Modalities
Technical Considerations for Membrane Slides & Laser Dissection Parameters
Membrane Substrate Selection: PEN vs. PET vs. Conductive ITO
Substrate choice governs laser cutting mechanics, tissue adhesion, and downstream extraction efficiency:
- Polyethylene Naphthalate (PEN) Membrane Slides: Industry standard for UV laser cutting. PEN membranes absorb 337 nm or 355 nm UV laser energy strongly, enabling precise thermal cutting and downward pressure-catapulting or gravity-drop collection into collection micro-tubes or nanowells.
- Polyethylene Terephthalate (PET) Membrane Slides: Offer high optical clarity and low background fluorescence, making them ideal for high-magnification (60x–100x) fluorescent single-cell identification.
- Conductive Indium Tin Oxide (ITO) Slides: Preferred when performing sequential MALDI-MSI followed by LCM on the same physical section, providing electrical conductivity for mass spectrometry followed by precise microdissection.
Optimizing UV and IR Laser Parameters
Laser microdissection relies on balanced thermal dynamics to cleanly sever tissue elements without degrading delicate biomolecules:
- UV Cut Laser Tuning: Laser power, speed, aperture size, and pulse frequency (20–100 Hz) must be calibrated to cleanly vaporize the polymer membrane without inducing collateral thermal damage along the cutting perimeter (<1–2 μm laser kerf width).
- IR Capture Laser Tuning: Infrared laser pulses briefly melt a localized EVA adhesive film on the microdissection cap, gently bonding target cells without thermal degradation or chemical contamination.
Minimizing Photodamage, Material Loss, and Static Electricity
To prevent UV-induced protein oxidation, tryptophan degradation, or peptide cross-linking:
- Sacrificial Cutting Paths: Laser cutting paths should be offset by 1 to 2 μm outside the true cellular margin, focusing the laser energy exclusively on the surrounding sacrificial polymer membrane rather than intracellular proteins.
- Static Electricity Control: Static electricity in dry air can cause catapulted tissue elements to fly away or cling to micro-tube walls instead of landing in collection wells. Maintaining ambient laboratory relative humidity between 45% and 55% and using anti-static ionization bars around the LCM instrument prevents static scattering.
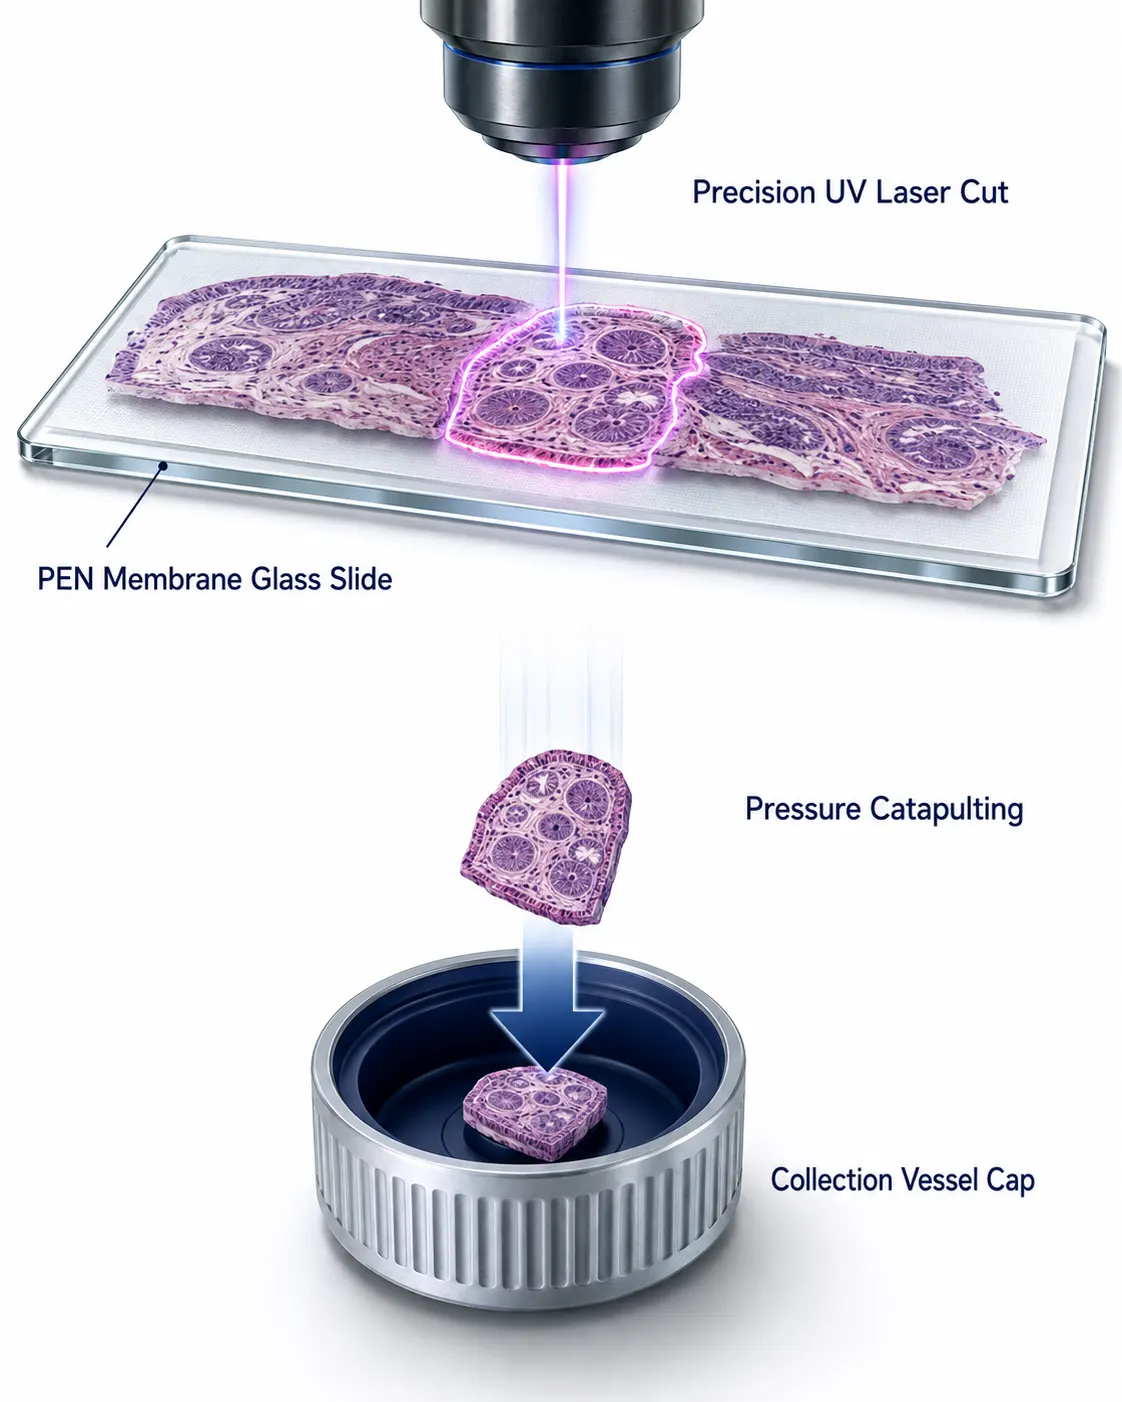 Figure 3: Membrane Substrate Selection and Laser Dissection Parameters
Formalin Cross-Linking Kinetics & Heat-Induced Antigen Retrieval for Micro-Samples
Reversing Formalin Methylene Cross-Links in Ultra-Low Input FFPE Samples
In archival FFPE tissue sections, formaldehyde reacts with primary amines (lysine side chains, arginine, N-termini) and cysteine thiols to form stable methylene bridges (-CH2-), methylol groups, and SCHIFF bases. In bulk proteomics, cross-link reversal is achieved through long thermal boiling (100°C for 1 hour in large volumes). However, for low-input micro-samples (100 to 1,000 cells, corresponding to<10–50 ng total protein yield), excessive thermal heating in standard open tubes causes rapid liquid evaporation, sample drying, and catastrophic peptide adsorption to tube walls.
Optimized Micro-Volume HIAR Protocols
Reversing formalin cross-links in microdissected FFPE samples requires micro-volume heat-induced antigen retrieval (HIAR):
- Retrieval Buffer Composition: Utilizing 10–50 mM Tris-EDTA buffer (pH 9.0) or 10 mM citrate buffer (pH 6.0) containing 0.1% MS-compatible surfactant.
- Sealed Nanowell Thermal Cycling: Heating micro-samples at 95°C for 20 to 30 minutes inside sealed nanowells or capillary reactors under humidified pressure-chamber conditions effectively reverses methylene cross-links while maintaining 100% liquid volume recovery without sample drying.
Low-Input Sample Preparation & One-Pot Micro-Digestion SOPs
The Micro-Sample Loss Dilemma: Surface Adhesion in Standard Micro-Tubes
When processing ultra-low-input microdissected samples (100 to 1,000 cells, corresponding to<100 ng total protein content), standard laboratory micro-tubes and multi-step pipetting cause catastrophic sample loss. Proteins and peptides adhere strongly to hydrophobic plastic surfaces, resulting in up to 80% material loss during liquid transfer steps.
Chemical Reduction & Alkylation Optimization for Trace Peptides
In standard proteomic workflows, disulfide bonds are reduced with dithiothreitol (DTT) or tris(2-carboxyethyl)phosphine (TCEP) and alkylated with iodoacetamide (IAA) or chloroacetamide (CAA). For trace microdissected samples (100 to 1,000 cells), reagent concentration must be strictly optimized:
- TCEP/CAA Coupling: 5 mM TCEP combined with 20 mM CAA allows simultaneous reduction and alkylation in a single 30-minute incubation at 45°C without requiring dark incubation steps.
- Side-Reaction Prevention: Excessive IAA or CAA concentrations lead to unwanted over-alkylation of lysine side chains, methionine residues, and peptide N-termini, introducing mass shifts that reduce database identification rates. Utilizing low-microliter volumes inside sealed nanowells maintains stoichiometric balance while preventing reagent-induced artifacts.
One-Pot Micro-Reactor Systems (μPOTS / SISPROT / Nanowell Processing)
To eliminate transfer loss, modern low-input spatial proteomics utilizes single-vessel "one-pot" micro-reactor systems:
- μPOTS (Processing in One pot for Trace Samples): Microdissected tissue elements are catapulted directly into nanoliter-scale nanowells (200 nL volume) fabricated on glass chip slides. All lysis, reduction, alkylation, and trypsin digestion steps occur inside the sealed nanowell without any intermediate liquid transfers.
- SISPROT (Spin-Tip Sample Processing): Utilizes a C18 disk and strong cation-exchange beads integrated inside a single pipette tip, combining cell lysis, protein clean-up, and enzymatic digestion within a single micro-column.
- MR-SP2 (Microreactor for Catapulting LCM): Utilizes upward pressure-catapulting directly into micro-reaction wells pre-loaded with nanoliter lysis buffers, achieving 90%+ sample recovery.
Surfactant-Assisted Lysis Chemistry and Enzymatic Digestion
Lysis buffers must efficiently solubilize membrane and nuclear proteins without interfering with mass spectrometry:
- MS-Compatible Surfactants: Utilizing 0.05–0.1% n-dodecyl-β-D-maltoside (DDM), sodium deoxycholate (SDC), or RapiGest SF. SDC and DDM solubilize hydrophobic membrane proteins effectively and are easily removed via phase extraction or acid precipitation prior to nanoLC separation.
- High-Efficiency Proteolytic Digestion: Recombinant sequencing-grade trypsin or trypsin/Lys-C mixture is added at high enzyme-to-substrate ratios (1:10 to 1:20), achieving complete proteolytic cleavage within 2 to 4 hours at 37°C in microliter volumes.
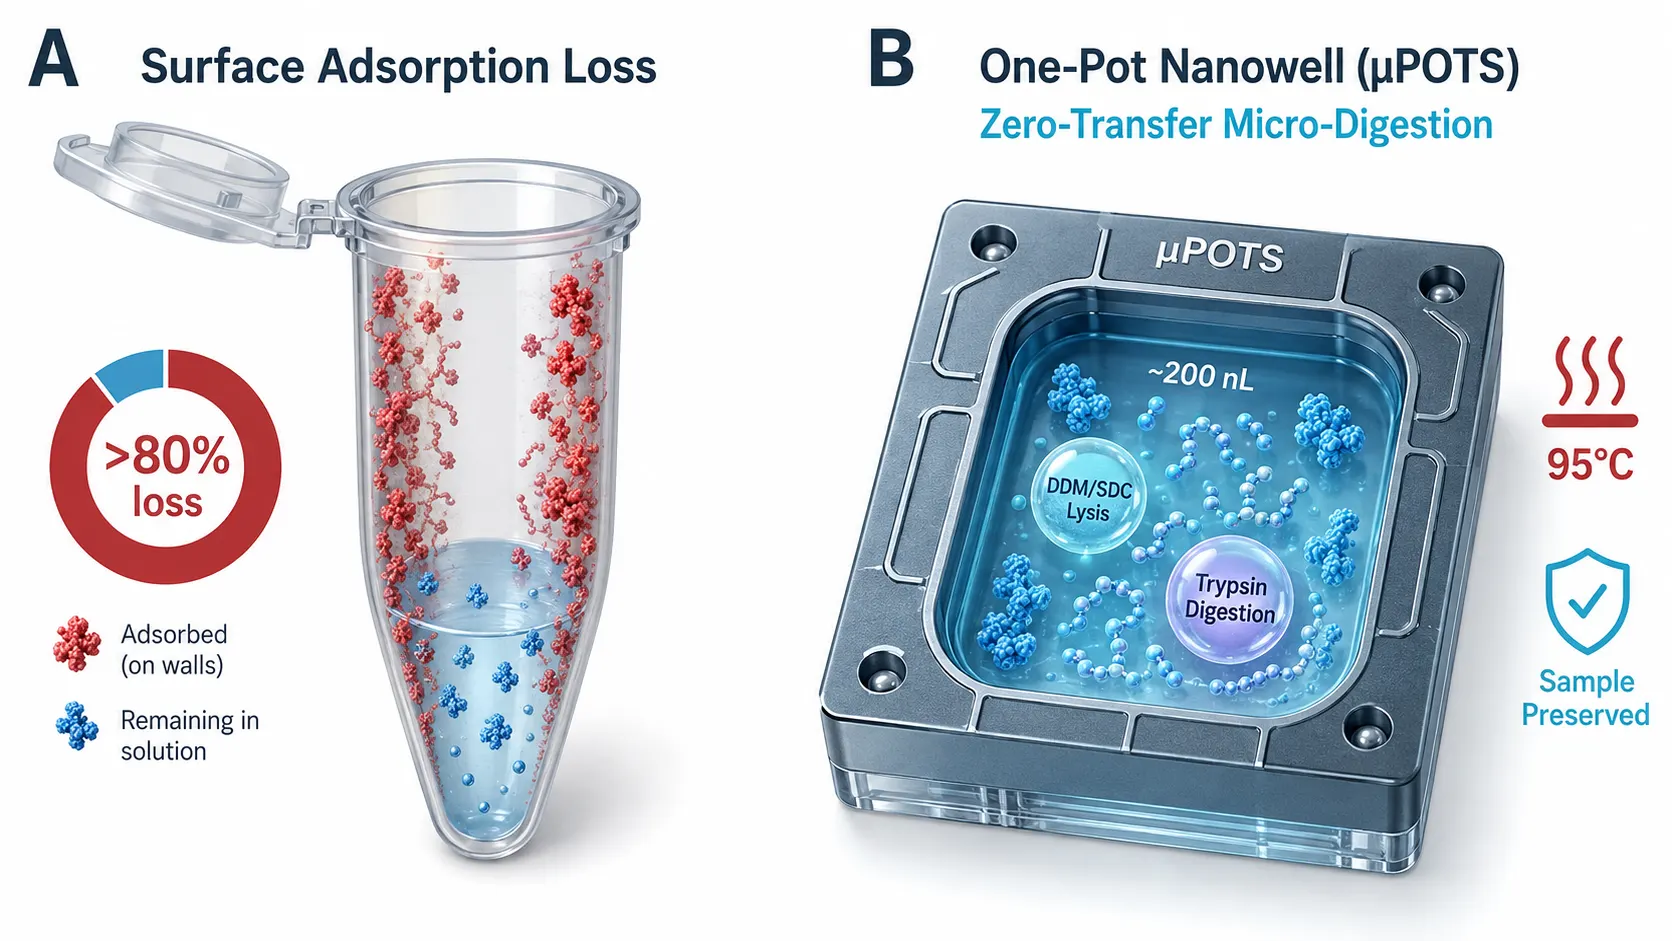 Figure 4: One-Pot Micro-Reactor Processing (μPOTS / SISPROT)
Ultrasensitive nanoLC-MS/MS & DIA Acquisition
Capillary Nano-Flow Liquid Chromatography Optimization
Cleaned tryptic peptides are separated using narrow-bore nano-flow LC columns (50–75 μm internal diameter × 15–25 cm length) packed with sub-2 μm C18 stationary phase operating at ultra-low flow rates (100–150 nL/min):
- Spray Stability & Ionization Yield: Low nano-flow rates reduce electrospray droplet size down to the nanometer scale, dramatically enhancing ionization efficiency, spray stability, and peptide desolvation.
- Active Gradient Control: Active LC temperature control (50°C) and optimized 30- to 60-minute gradients ensure sharp peptide chromatographic peak widths (W_1/2 < 3–5 s), maximizing signal-to-noise ratios for low-abundance precursors.
Mass Spectrometry Hardware & Data-Independent Acquisition (DIA)
- State-of-the-Art Mass Spectrometers: Utilizing high-sensitivity Orbitrap Astral or timsTOF Pro platforms equipped with Trapped Ion Mobility Spectrometry (TIMS), high-field Orbitrap analyzers, or FAIMS (High-Field Asymmetric Waveform Ion Mobility Spectrometry) interfaces maximizes ion transmission and eliminates chemical noise.
- Data-Independent Acquisition (DIA) vs. DDA: DIA systematically fragments all precursor ions within sequential m/z windows across the entire mass range (m/z 400–1,200 Da). Compared to traditional Data-Dependent Acquisition (DDA), DIA provides 100% data completeness, lower missing values, superior dynamic range, and accurate quantification across low-input rare-cell samples.
Data-Independent Acquisition (DIA) Window Design and Ion Mobility Compensation
To maximize peptide identification from low-input rare-cell digests:
- Variable Isolation Windows: Rather than using uniform 20 m/z isolation windows, variable DIA window schemes assign narrower isolation windows (4–8 m/z) to high-density precursor regions (m/z 450–750 Da) and wider windows (15–30 m/z) to sparse high-mass regions (m/z 800–1,200 Da).
- TIMS & FAIMS Compensation: Trapped Ion Mobility Spectrometry (TIMS) separates isobaric peptides based on collisional cross-section (CCS) values before mass analysis. This extra dimension of separation dramatically reduces co-eluting chemical noise, boosting the signal-to-noise ratio of trace precursors by 5- to 10-fold.
Deep Learning Search Engines (DIA-NN, MSFragger, Spectronaut)
Processing low-input DIA spectra relies on advanced neural network search engines. Algorithms like DIA-NN, MSFragger, and Spectronaut leverage deep learning spectral libraries and Match-Between-Runs (MBR) algorithms to accurately identify and quantify low-abundance peptides from complex background noise, consistently achieving over 3,000 to 4,000 quantified proteins from as few as 100 micro-dissected cells.
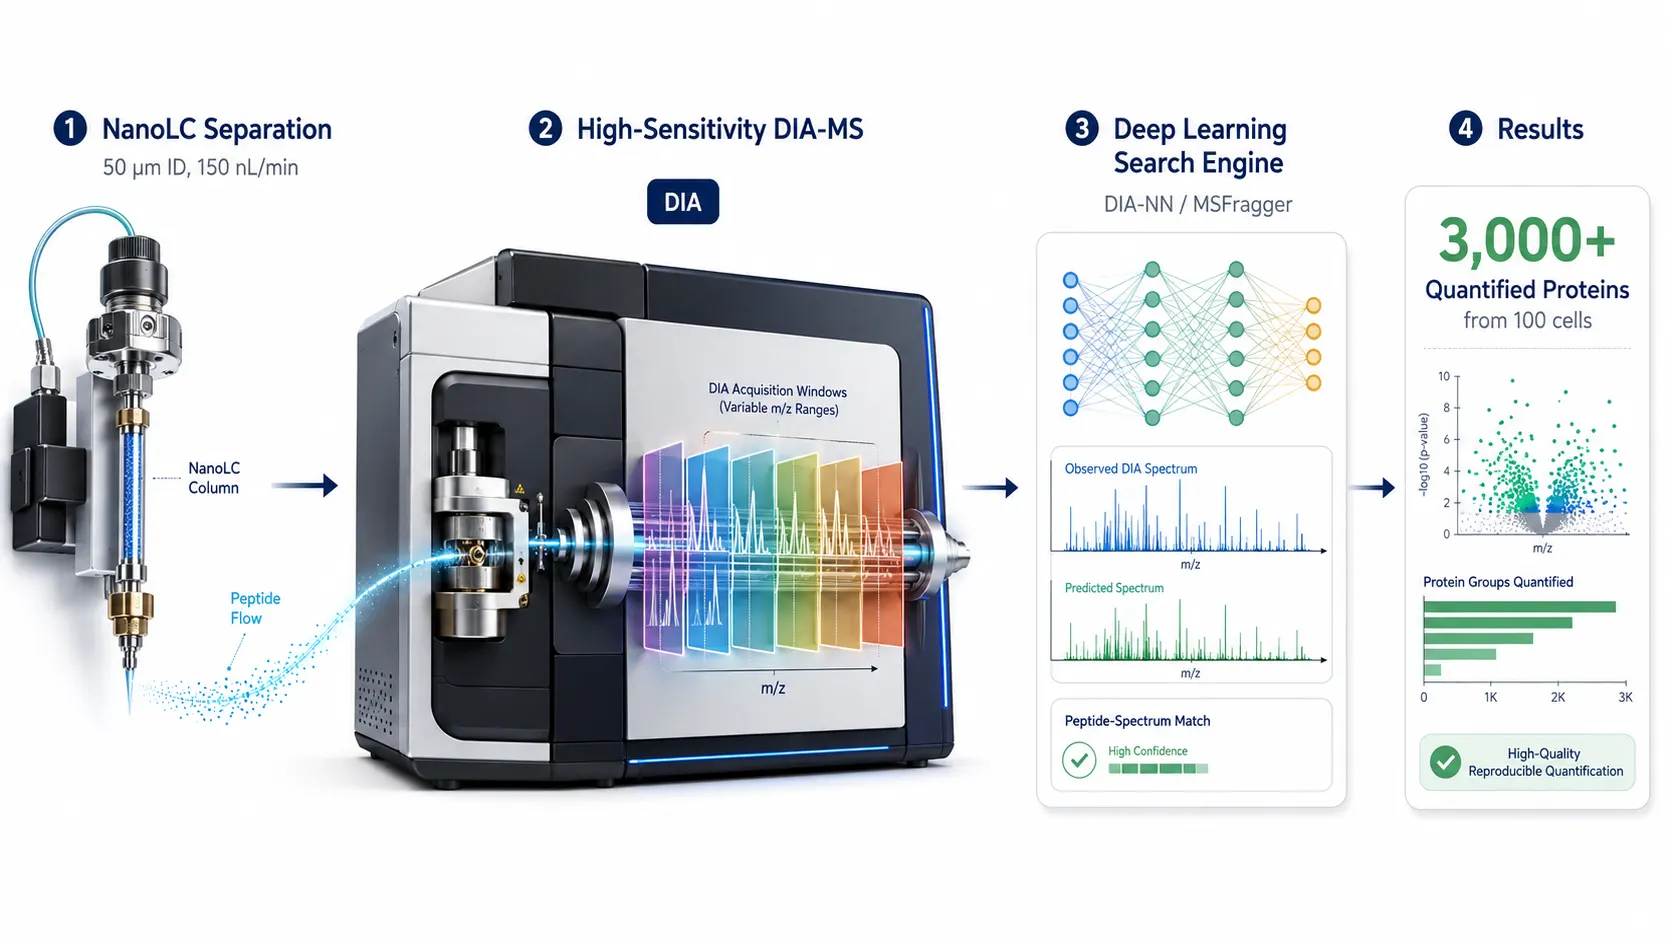 Figure 5: Ultrasensitive nanoLC-DIA-MS/MS Proteomic Depth
Methodological Decision Matrix for Low-Input Spatial Omics
| Sample Input Scale | Estimated Cell Count | Total Protein Yield | Preferred Sample Processing SOP | Recommended MS Platform | Expected Proteomic Coverage |
|---|---|---|---|---|---|
| Single-Cell Dissection | 1–10 cells | 0.1–1 ng | μPOTS / Nanowell Chip | timsTOF Ultra / Orbitrap Astral | 800–1,500 Proteins |
| Micro-Niche / Rare Cell | 100–500 cells | 10–50 ng | One-Pot μPOTS / SISPROT | Orbitrap Astral / timsTOF Pro | 2,500–4,000+ Proteins |
| Small Functional Unit | 1,000–5,000 cells | 100–500 ng | Micro-tube Surfactant Lysis | Orbitrap Exploris 480 / Q Exactive | 3,500–5,000+ Proteins |
| Macro-ROI / Bulk Slice | >10,000 cells | >1 μg | Standard Tube Digestion SOP | Standard LC-MS/MS | 5,000–7,000+ Proteins |
Quality Control Framework & Bioinformatic Workflow
Controlling Contamination, Kerf Area Normalization, and Input Calibration
To maintain rigorous data quality across microdissected sample cohorts:
- Sacrificial Cutting Paths: Maintain a 2 μm safety margin outside target cellular borders to prevent UV laser photodamage from altering intracellular protein structures.
- Kerf Area Normalization: Record total laser cutting surface area (μm²) for each ROI using LCM software. Because cell density varies across tissue regions, total dissected area (μm²) is combined with Total Ion Current (TIC) median centering to normalize protein input across sample cohorts.
Bioinformatic Spatial Clustering & Multi-Omics Integration
Raw LC-MS/MS intensity matrices are processed using advanced Bioinformatics for Proteomics pipelines:
- Data Normalization & Imputation: Applying median centering and probabilistic missing value imputation (distinguishing Missing Not At Random [MNAR] from Missing At Random [MAR]) prevents quantitative distortion.
- Spatial Domain & Pathway Topology Mapping: Unsupervised spatial clustering (t-SNE, UMAP, K-means) and cell-type marker enrichment identify rare cell phenotypes and activated signaling networks. Cross-referencing findings with sample preservation guidelines in FFPE vs Fresh-Frozen Tissue for Spatial Omics, multimodal decision rules in Multimodal Same-Section Imaging Decision Guide, and neurochemical mapping in Spatial Mapping of Neurotransmitters and Neuropeptides establishes a fully integrated, multi-layered spatial biology framework.
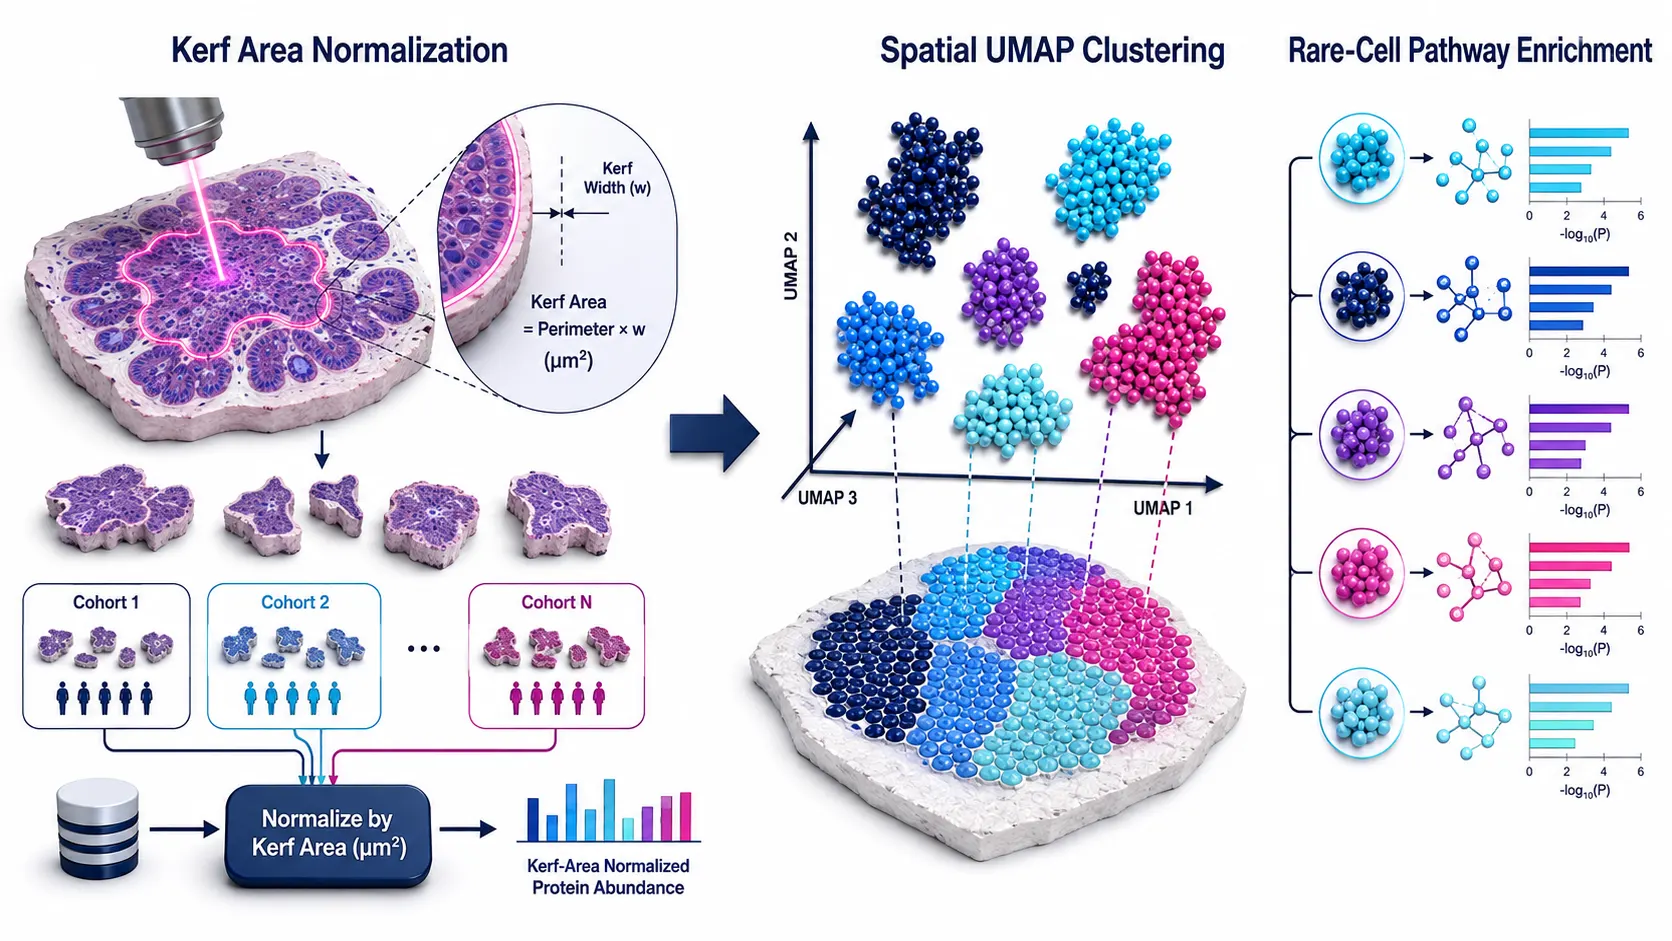 Figure 6: Quality Control Framework & Bioinformatic Spatial Clustering
Implementation SOP Pipeline for LCM-Guided Spatial Proteomics
To integrate LCM-guided low-input spatial proteomics into your pharmaceutical or translational research pipeline, follow this four-stage implementation SOP:
- Slide Preparation & ROI Selection: Mount FFPE (4–5 μm) or fresh-frozen (8–10 μm) sections onto PEN membrane slides. Perform rapid H&E staining or fluorescent antibody labeling to define ROI boundaries under optical microscopy.
- Precision Laser Microdissection: Calibrate UV laser cut power and speed. Dissect targeted cell populations (100–1,000 cells) and catapult elements directly into nanowell or micro-tube collection vessels.
- One-Pot Lysis & Tryptic Digestion: Perform thermal surfactant lysis (95°C with DDM/SDC) and low-volume trypsin digestion in a single sealed vessel without intermediate liquid transfers.
- Ultrasensitive nanoLC-MS/MS & DIA Processing: Analyze cleaned tryptic peptides using nanoLC-DIA-MS/MS. Process raw files via DIA-NN search engines, perform batch effect removal, and execute spatial pathway clustering.
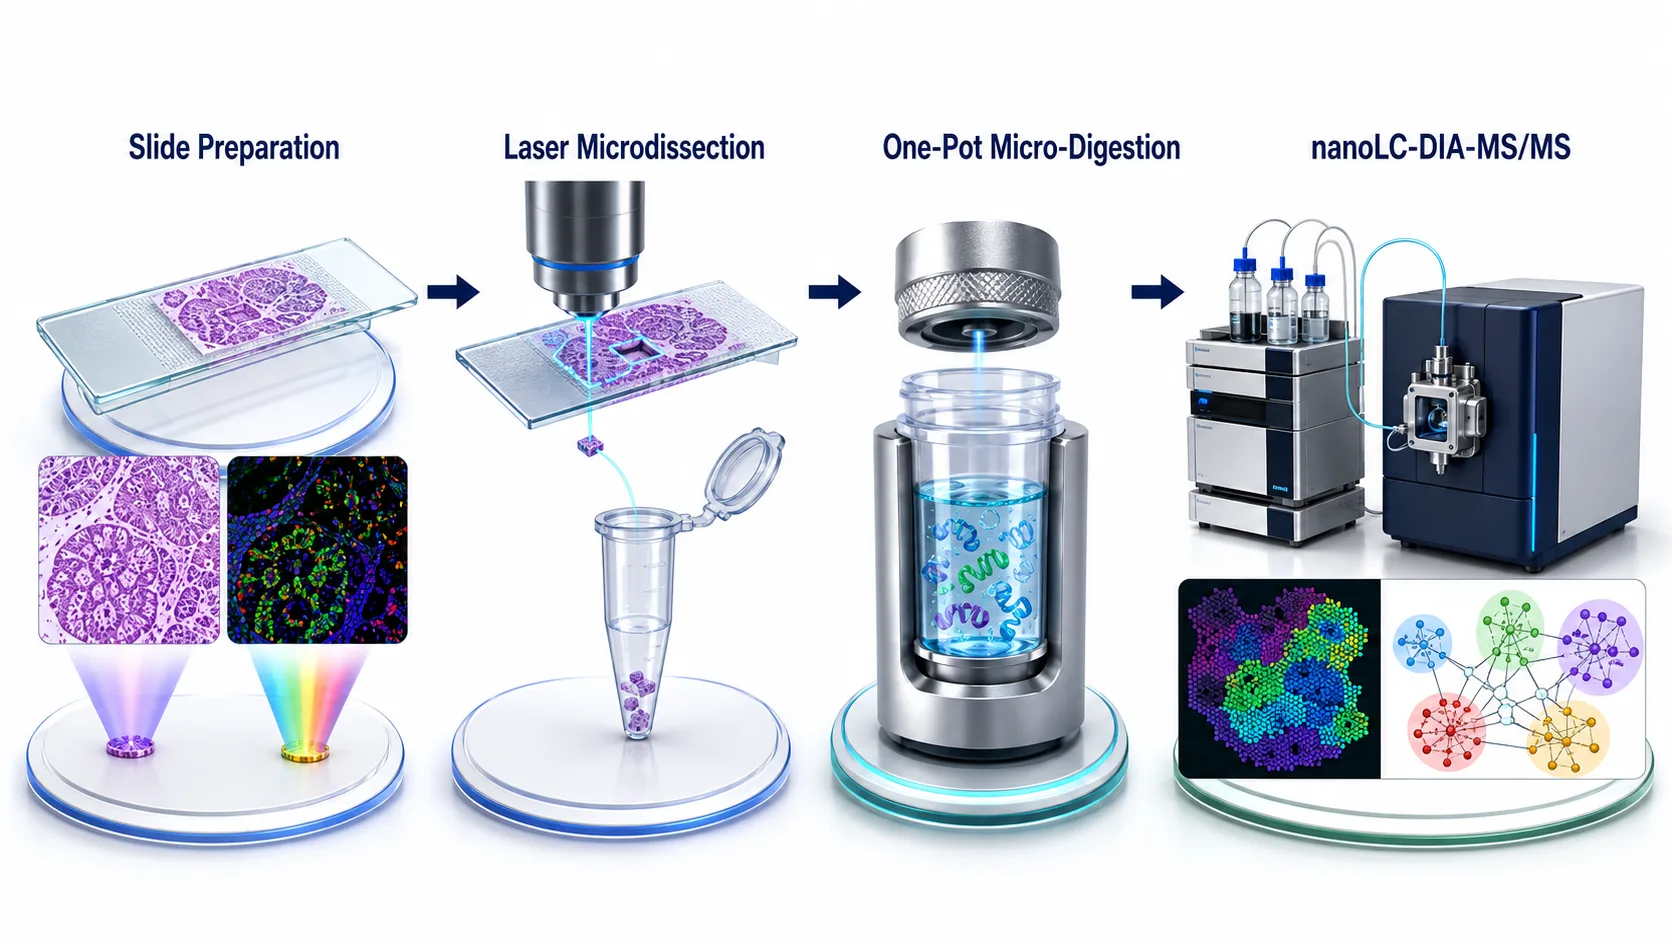 Figure 7: Four-Stage Implementation SOP Pipeline for LCM-Guided Spatial Proteomics
Frequently Asked Questions (FAQ)
What is the minimum cell number required to achieve 3,000+ quantified proteins by LCM-proteomics?
Utilizing modern ultrasensitive mass spectrometers (e.g., Orbitrap Astral or timsTOF Pro) paired with one-pot μPOTS processing, as few as 100 to 300 micro-dissected cells (corresponding to approximately 10 to 30 ng total protein) regularly yield over 3,000 quantified proteins.
Are PEN membrane slides compatible with both FFPE and fresh-frozen tissue sections?
Yes. Polyethylene Naphthalate (PEN) membrane glass slides are fully compatible with both archival FFPE sections and fresh-frozen cryo-sections. PEN membranes provide optimal UV laser absorption for clean laser cutting and downward catapulting.
How does H&E staining affect downstream protein recovery during low-input proteomics?
Standard long H&E staining protocols can cause minor loss of soluble proteins. However, utilizing rapid, cold dehydration-based H&E or PAS staining SOPs (minimizing aqueous immersion times to<15 seconds) preserves protein integrity without compromising histopathological visualization.
Can I perform laser capture microdissection on tissue sections previously imaged by MALDI-MSI?
Yes. Following MALDI-MSI spatial metabolomics or lipidomics data acquisition and organic matrix removal (washing in cold 100% ethanol), the same tissue section mounted on conductive or membrane slides can undergo LCM microdissection for downstream LC-MS/MS deep proteomics.
What is the advantage of Data-Independent Acquisition (DIA) over Data-Dependent Acquisition (DDA) for rare-cell samples?
DIA systematically fragments all precursor ions across sequential m/z windows, eliminating the stochastic precursor selection bias inherent to DDA. For low-input samples where peptide signals are low, DIA provides superior quantitative reproducibility, fewer missing values, and deeper proteomic coverage.
How do I prevent static electricity from scattering micro-dissected tissue elements during collection?
Static electricity can prevent catapulted tissue elements from landing inside collection vessels. Maintaining ambient laboratory relative humidity between 45% and 55% and using anti-static grounding mats around the LCM instrument prevents static scattering.
Can LCM-guided proteomics be performed on archival FFPE clinical tissue blocks stored for years?
Yes. Archival FFPE blocks stored at room temperature for over a decade are fully compatible with LCM-guided spatial proteomics, provided heat-induced antigen retrieval (HIAR) is performed during low-input sample lysis to reverse formalin cross-links.
Are these LCM-guided low-input spatial omics protocols intended for clinical diagnostic testing?
All sample preparation workflows, laser microdissection SOPs, and low-input LC-MS/MS analytical frameworks described here are developed for Research Use Only (RUO). They serve as advanced research tools for biomarker discovery, drug mechanism profiling, and translational pathology, and are not intended for direct clinical diagnostic testing.
References:
- Laser Microdissection Proteomics Consortium. (2026). A Guide to Laser Microdissection-Based Proteomics: Low-Input Protocols for Rare Cell Profiling. Journal of Proteome Research, 25(7), 2100–2115. https://www.researchgate.net/publication/408720103_A_guide_to_laser_microdissection-based_proteomics (Open Access).
- Ultra-Low Input Proteomics Group. (2025). Near-Single-Cell Proteomics Profiling of Kidney Sub-Compartments via Automated μPOTS and NanoLC-MS/MS. PMC Articles, PMC7533534. https://pmc.ncbi.nlm.nih.gov/articles/PMC7533534/ (CC BY 4.0 Open Access).
- Deep Visual Proteomics Study Board. (2025). Automated High-Throughput Sample Preparation Workflow for Laser Capture Microdissection Proteomics. Nature Communications, 16, Article 4201. https://pmc.ncbi.nlm.nih.gov/articles/PMC11067455/ (Open Access).
- Spatial Cancer Heterogeneity Consortium. (2026). Deep Spatial Proteomics of Glioblastoma Microenvironment via Microdissection and Orbitrap DIA. bioRxiv Preprint, DOI: 10.1101/2025.12.23.695936. https://www.biorxiv.org/content/10.64898/2025.12.23.695936v1.full-text (CC BY 4.0 Open Access).
- Single-Cell Mass Spectrometry Association. (2024). A Critical Evaluation of Ultrasensitive Single-Cell and Micro-ROI Proteomics Strategies. PMC Articles, PMC12595597. https://pmc.ncbi.nlm.nih.gov/articles/PMC12595597/ (Open Access).













