

Introduction: The Dilemma of Multimodal Spatial Co-Localization
The Multimodal Imperative: Why Co-Mapping Metabolites and Proteins Defines Functional Biology
In modern biomedical research, clinical pathology, and systems biology, understanding complex tissue microenvironments requires capturing multiple layers of molecular information simultaneously. Proteins dictate cellular machinery, enzymatic activity, structural scaffolding, and signaling cascades. Conversely, small molecule primary metabolites (e.g., ATP, lactate, amino acids, TCA cycle intermediates) and lipids represent the immediate downstream functional readouts of cellular physiology, nutrient availability, and metabolic flux. Mapping spatial protein abundances alongside localized metabolite alterations within identical cellular niches provides unprecedented insights into tumor heterogeneity, ischemic tissue injury, neurodegenerative degeneration, and therapeutic drug distribution.
The Fundamental Conflict: Chemical Incompatibilities in Sample Extraction & Fixation
Achieving true spatial multi-omics is technically challenging due to fundamental chemical incompatibilities between analyte preservation strategies:
- Metabolite & Lipid Requirements: Unfixed, fresh-frozen tissue sections are mandatory. Small polar metabolites are highly soluble and metabolically volatile; any exposure to aqueous fixatives, formalin, or organic solvent washes (such as xylene or ethanol) leads to instantaneous leaching, analyte extraction, or enzymatic autolysis.
- Proteomic & Peptide Requirements: Spatial proteomics relies on heat-induced antigen retrieval (HIAR) and on-tissue tryptic digestion. Formalin-fixed paraffin-embedded (FFPE) tissue or organic solvent-washed fresh-frozen tissue (Carnoy's wash) is necessary to remove interfering endogenous lipids and salts, enabling trypsin to access target proteins and yield detectable tryptic peptides (m/z 700–3,000 Da).
Same-Section vs. Serial-Section vs. LCM-Guided: The Three Core Technical Routes
When designing a spatial multi-omics study, researchers face a critical strategic decision regarding tissue sectioning and analytical workflow:
- Same-Section Sequential MSI: Acquiring spatial metabolomics/lipidomics first, followed by matrix washing, on-tissue antigen retrieval, trypsin digestion, and spatial proteomics second on the exact same physical section.
- Serial-Section Parallel Strategy: Cutting adjacent consecutive tissue sections (4–10 μm apart), optimizing separate dedicated protocols for each molecular class, and computationally co-registering the resulting spatial ion maps.
- ROI-Guided Laser Capture Microdissection (LCM) Hybrid Route: Performing spatial metabolomics/lipidomics imaging first to map phenotypic regions of interest (ROIs), followed by laser capture microdissection of those exact ROIs for deep, quantitative LC-MS/MS proteomics.
Selecting the optimal route requires evaluating tissue availability, required spatial resolution, co-localization tolerance, and analytical throughput. Leveraging specialized Mass Spectrometry Imaging Service and MS-based Spatial Proteomics Service workflows ensures seamless experimental execution across all three modalities.
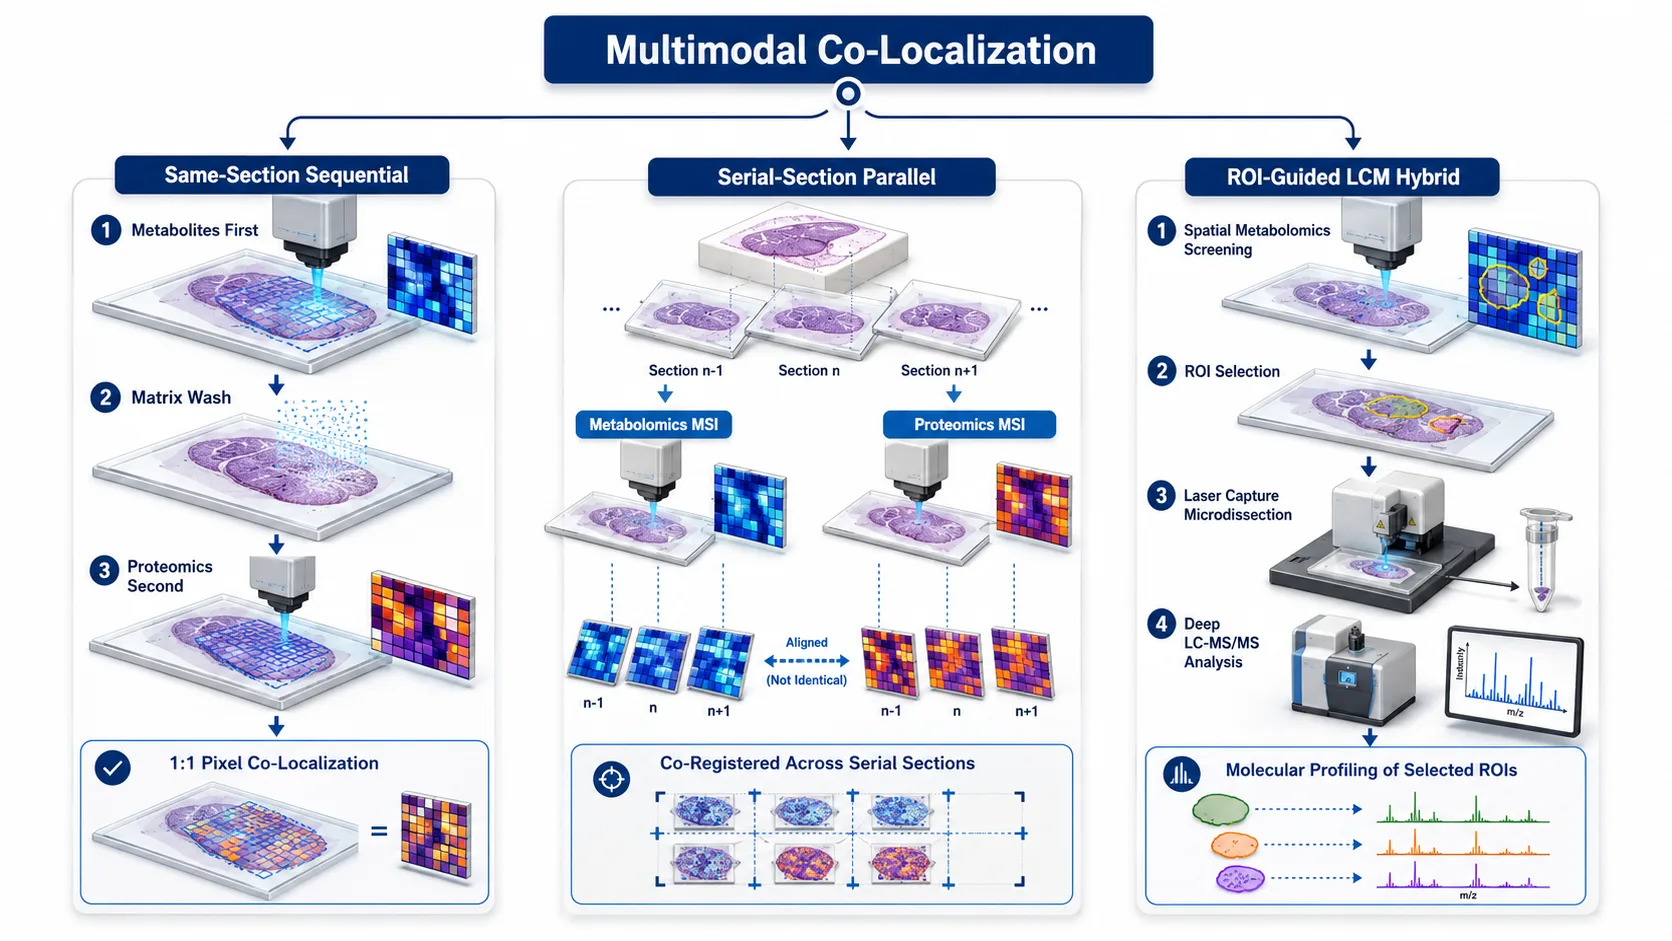 Figure 1: Multimodal Spatial Imaging Decision Framework
The Same-Section Sequential MSI Paradigm
The Analytical Order Rule: Why Small Metabolites/Lipids MUST Precede Proteomic Enzymatic Digestion
In same-section sequential MALDI-MSI, the strict chronological sequence of analytical steps is governed by non-negotiable chemical laws:
- First Phase (Non-Destructive / Low-Extraction Imaging): Spatial metabolomics and lipidomics MUST be performed first. Fresh-frozen tissue sections mounted on conductive Indium Tin Oxide (ITO) glass slides are coated with volatile, non-extracting matrices (such as 2,5-DHB, 9-aminoacridine, or DAN) and analyzed under vacuum or ambient conditions.
- Second Phase (Enzymatic Cleavage & Tryptic Peptide Imaging): Once metabolic/lipid spectra are acquired, the initial matrix layer is washed off, and the tissue section undergoes lipid depletion, heat-induced antigen retrieval (HIAR), micro-droplet trypsin spraying, and matrix recrystallization for spatial proteomics.
Reversing this order is impossible: performing aqueous trypsin digestion or antigen retrieval first completely washes away small metabolites and extracts lipids, destroying metabolic information before imaging can occur.
Matrix Removal and Tissue Conditioning: Cleaning Organic Matrices Without Depleting Membrane Antigenicity
Transitioning from small molecule imaging to tryptic peptide imaging requires complete matrix removal without altering underlying tissue architecture or degrading protein antigenicity:
- Solvent Washing SOP: Submerging the imaged ITO slide in cold 70% to 100% ethanol or acetone for 30–60 seconds completely dissolves DHB, CHCA, or 9-AA matrix crystals.
- Lipid & Salt Depletion (Carnoy's Conditioning): Following matrix removal, applying a brief Carnoy's wash (60% ethanol, 30% chloroform, 10% glacial acetic acid) strips remaining endogenous lipids and suppresses alkali adduct formation, significantly improving subsequent tryptic peptide ionization efficiency.
On-Tissue Heat-Induced Antigen Retrieval (HIAR) & Trypsin Spraying on Previously Imaged Tissue
Even in fresh-frozen tissues, prior laser irradiation and lipid depletion can cause subtle protein aggregation. Performing brief heat-induced antigen retrieval (HIAR) at 90°C–95°C in 10 mM Tris-EDTA buffer (pH 9.0) for 10–15 minutes opens protein tertiary structures. Recombinant trypsin is then deposited using an automated pneumatic sprayer in micro-droplet mode (15–20 μm droplet size) under controlled humidity (90% RH at 37°C for 2–4 hours). The generated tryptic peptides are coated with α-cyano-4-hydroxycinnamic acid (CHCA) matrix and re-imaged on the same MALDI mass spectrometer.
Spatial Fidelity & Co-Localization Accuracy: Achieving Absolute 1:1 Pixel Registration
The paramount advantage of same-section sequential MSI is achieving absolute 1:1 pixel co-registration. Because laser rastering occurs on the exact same physical cells, there is zero spatial offset or z-axis deformation error. Metabolite ion signals at pixel (X_i, Y_j) directly correspond to tryptic peptide signals at pixel (X_i, Y_j), enabling true single-cell or fine-subcellular spatial correlation without reliance on deformable digital image warping algorithms.
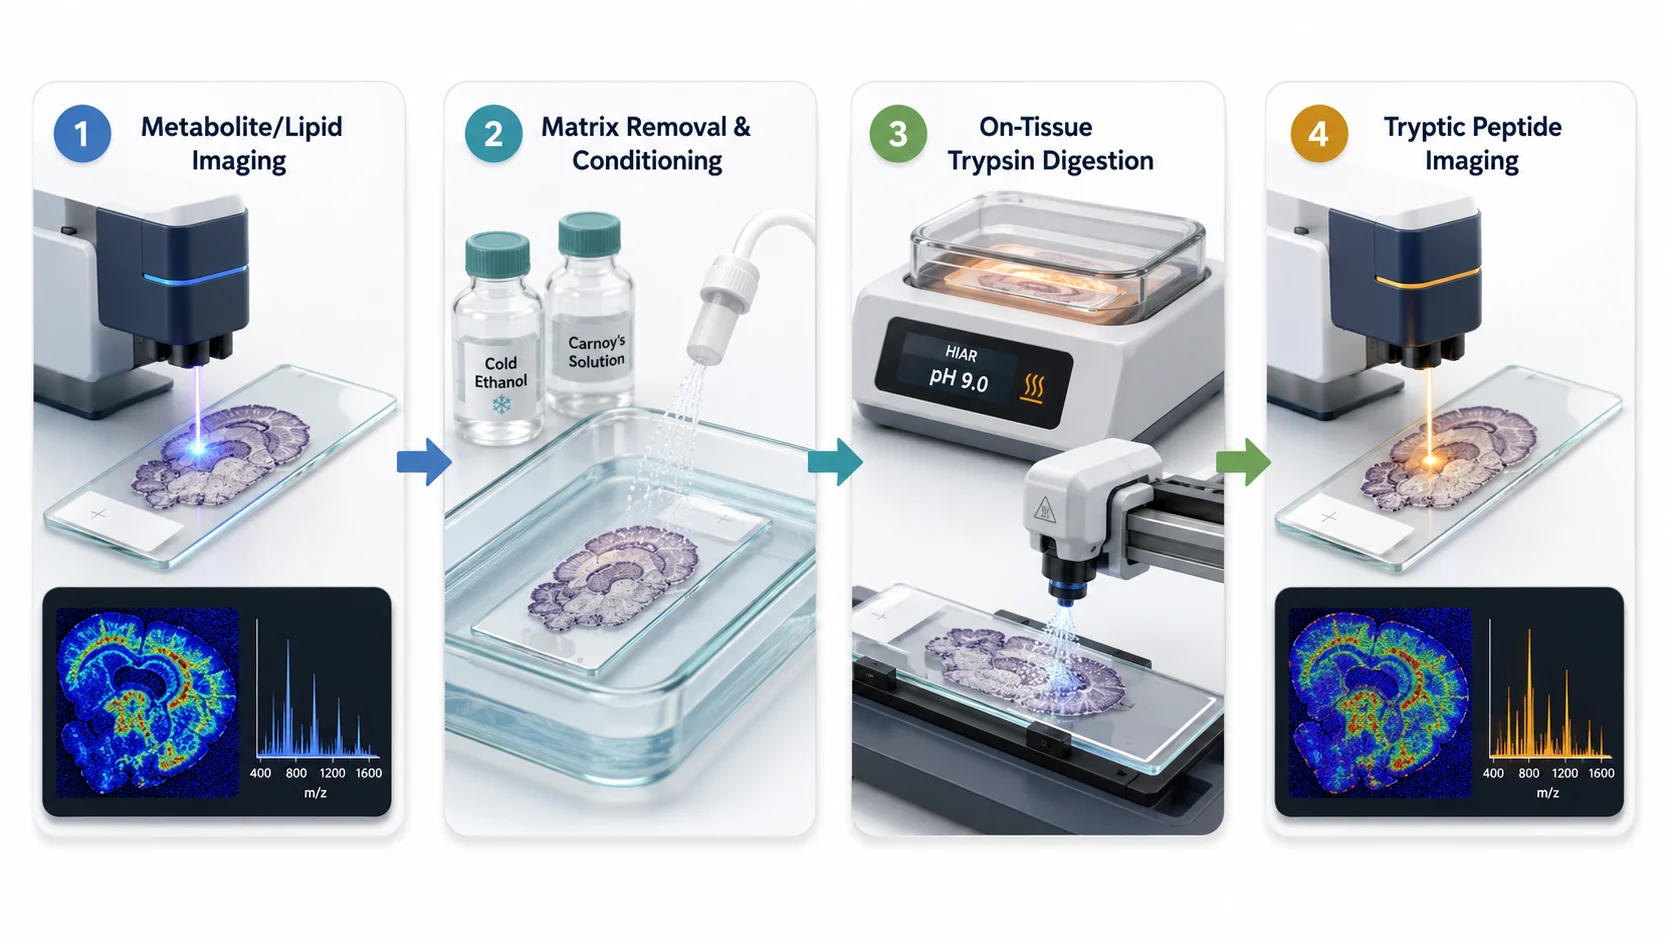 Figure 2: Same-Section Sequential MSI Workflow
The Serial-Section Parallel Strategy
Independent SOP Optimization: Uncompromising Conditions for Fresh-Frozen Metabolomics and FFPE Proteomics
When sufficient tissue volume is available, analyzing consecutive serial sections (4–10 μm thickness apart) represents a highly robust alternative:
- Section A (Fresh-Frozen Spatial Metabolomics / Lipidomics): Cryo-sectioned from a fresh-frozen tissue block directly onto conductive ITO slides without fixatives or aqueous washes.
- Section B (FFPE or Carnoy's-Washed Spatial Proteomics): Cut from an adjacent FFPE block or consecutive cryo-section, subjected to full deparaffinization, aggressive HIAR, and optimized trypsin digestion.
This approach permits completely uncompromised SOP optimization for each molecular class, eliminating matrix cross-contamination risks or signal attenuation caused by prior laser exposure.
Mitigating Micro-Heterogeneity: Cell-State Variations Between Consecutive Cut Slices
Despite its methodological simplicity, serial-section imaging suffers from biological z-axis spatial displacement. Human cells typically range from 10 to 20 μm in diameter. A 5 μm to 10 μm cut separation between Section A and Section B means that Section B contains different individual cells than Section A. In highly heterogeneous tissue structures—such as invasive tumor margins, single-cell capillary loops, or immune cell infiltrates—micro-heterogeneity between consecutive slices can introduce significant co-localization errors (>20–50 μm spatial mismatch).
Digital Image Co-Registration: Affine Transformation and Non-Linear Deformable Alignment Boundaries
To integrate serial-section datasets, researchers employ advanced computational image registration algorithms: rigid and affine transformation corrects for global translation and rotation, while non-linear deformable alignment (B-splines) warps section images to account for tissue stretching or tearing. While computational alignment aligns major tissue structures, it cannot reconstruct lost single-cell information between physical sections.
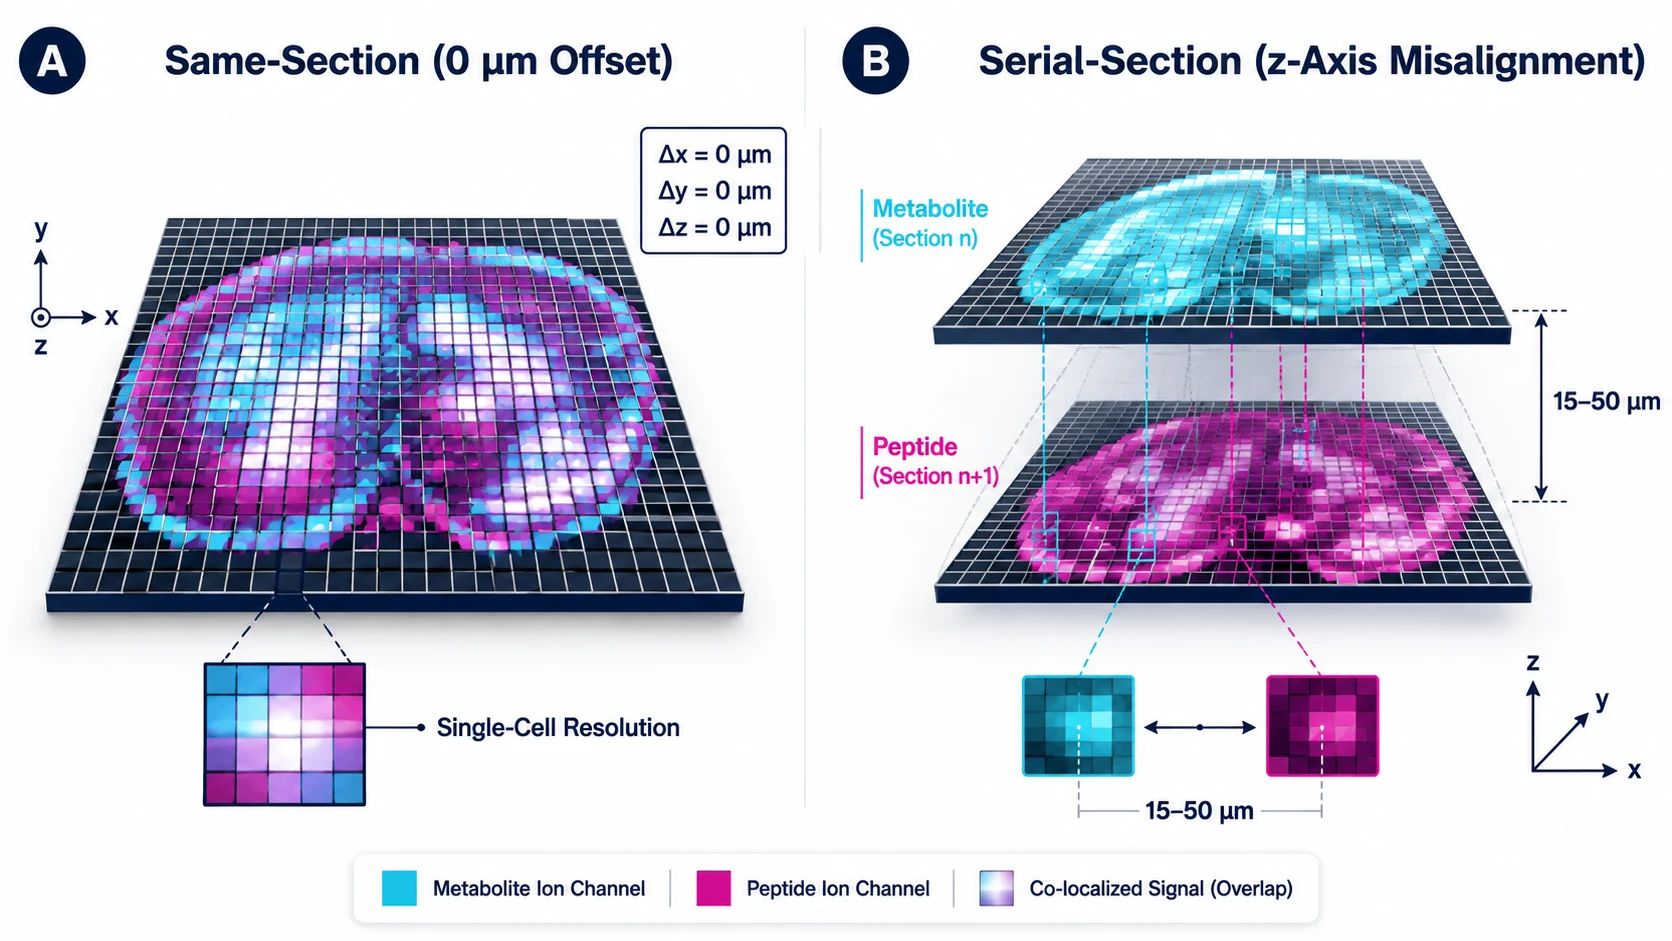 Figure 3: Co-Localization Accuracy Comparison
The ROI-Guided LCM Hybrid Workflow
Spatial Discovery to Targeted Extraction: Using MALDI-MSI Intensity Maps to Define Molecular ROIs
For studies requiring deep proteomic quantification (>1,000 identified proteins) beyond the surface sensitivity of direct MALDI-MSI, the ROI-guided Laser Capture Microdissection (LCM) hybrid workflow offers a powerful solution. First, untargeted MALDI-MSI spatial metabolomics or lipidomics is performed across the whole tissue section to map spatial phenotypic clusters (e.g., hypoxic core vs. proliferating rim vs. healthy stroma).
Laser Capture Microdissection (LCM) from the Same Section After Imaging Acquisition
Guided by the spatial mass spectrometry intensity maps, the imaged slide is washed, stained with rapid histopathological dyes, and transferred to an LCM instrument. Infrared or UV lasers micro-cut specific regions of interest (ROIs) or isolated cell populations directly from the previously imaged tissue section. Integrating LCM-Guided Spatial Proteomics Service workflows ensures precise cellular isolation without thermal damage.
Ultra-Low Input LC-MS/MS Deep Proteomic Profiling
The micro-dissected tissue ROIs (100 to 1,000 cells) are lysed, digested in micro-volumes, and analyzed via high-sensitivity LC-MS/MS. This hybrid workflow bridges untargeted spatial imaging with comprehensive deep proteome quantification, resolving isobaric peptide ambiguities and providing extensive pathway coverage. Pairing this approach with Untargeted Metabolomics and structured Paired-Section Integration Workflow Resource data processing delivers complete spatial multi-omics validation.
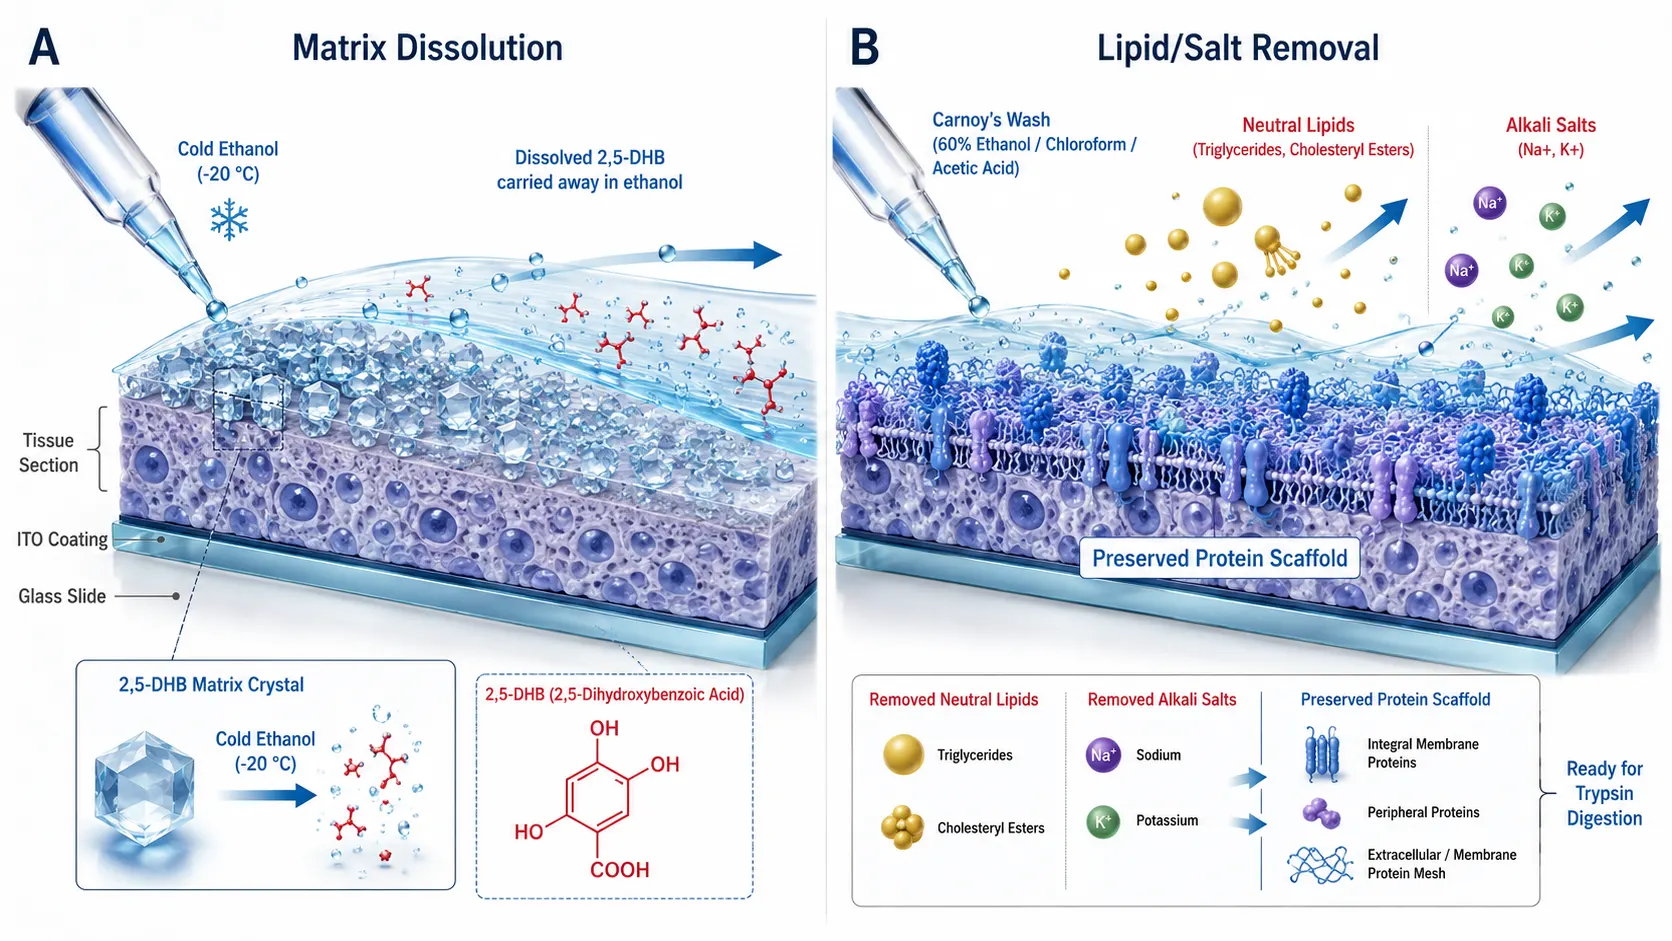 Figure 4: ROI-Guided LCM Hybrid Workflow
Comprehensive Technical Route Decision Matrix
| Evaluation Parameter | Same-Section Sequential MSI | Serial-Section Parallel MSI | ROI-Guided LCM Hybrid Workflow |
|---|---|---|---|
| Tissue Consumption | Minimal (1 single section) | Moderate (2+ consecutive sections) | Minimal (1 single section) |
| Co-Localization Error | Absolute Zero (0 µm, 1:1 pixel) | Moderate (15–50 µm z-axis offset) | Low (<10 µm ROI alignment) |
| Small Metabolite Sensitivity | High (Uncompromised 1st run) | High (Dedicated FF SOP) | High (Uncompromised 1st run) |
| Spatial Proteomics Depth | Moderate (100–300 tryptic peptides) | Good (200–500 tryptic peptides) | Ultra-Deep (1,000–4,000+ proteins) |
| Sample Preparation Complexity | High (Multi-step wash & re-prep) | Low (Standard parallel SOPs) | High (MSI + LCM + Micro-LC-MS) |
| Applicability to Rare Biopsies | Ideal (Core needle biopsies, TMAs) | Poor (Requires abundant tissue) | Ideal (Micro-biopsies & rare ROIs) |
Experimental Bottlenecks, Artefacts, and Mitigation Protocols
Avoiding Solvent-Induced Analyte Delocalization During Sequential Matrix Spraying
A major artifact in same-section sequential MSI is lateral analyte diffusion during matrix re-application or washing steps. If matrix removal solvents (acetone or ethanol) or trypsin spraying buffers are applied with excessive wetness, soluble peptides or lipids migrate across pixel boundaries, blurring spatial resolution. Using automated pneumatic sprayers with tightly controlled nozzle velocity (1,200 mm/min), low liquid flow rates (0.05 mL/min), and optimized drying times (30 s per pass) maintains micro-droplet crystallization (<10 μm crystal size) and prevents wet-film formation.
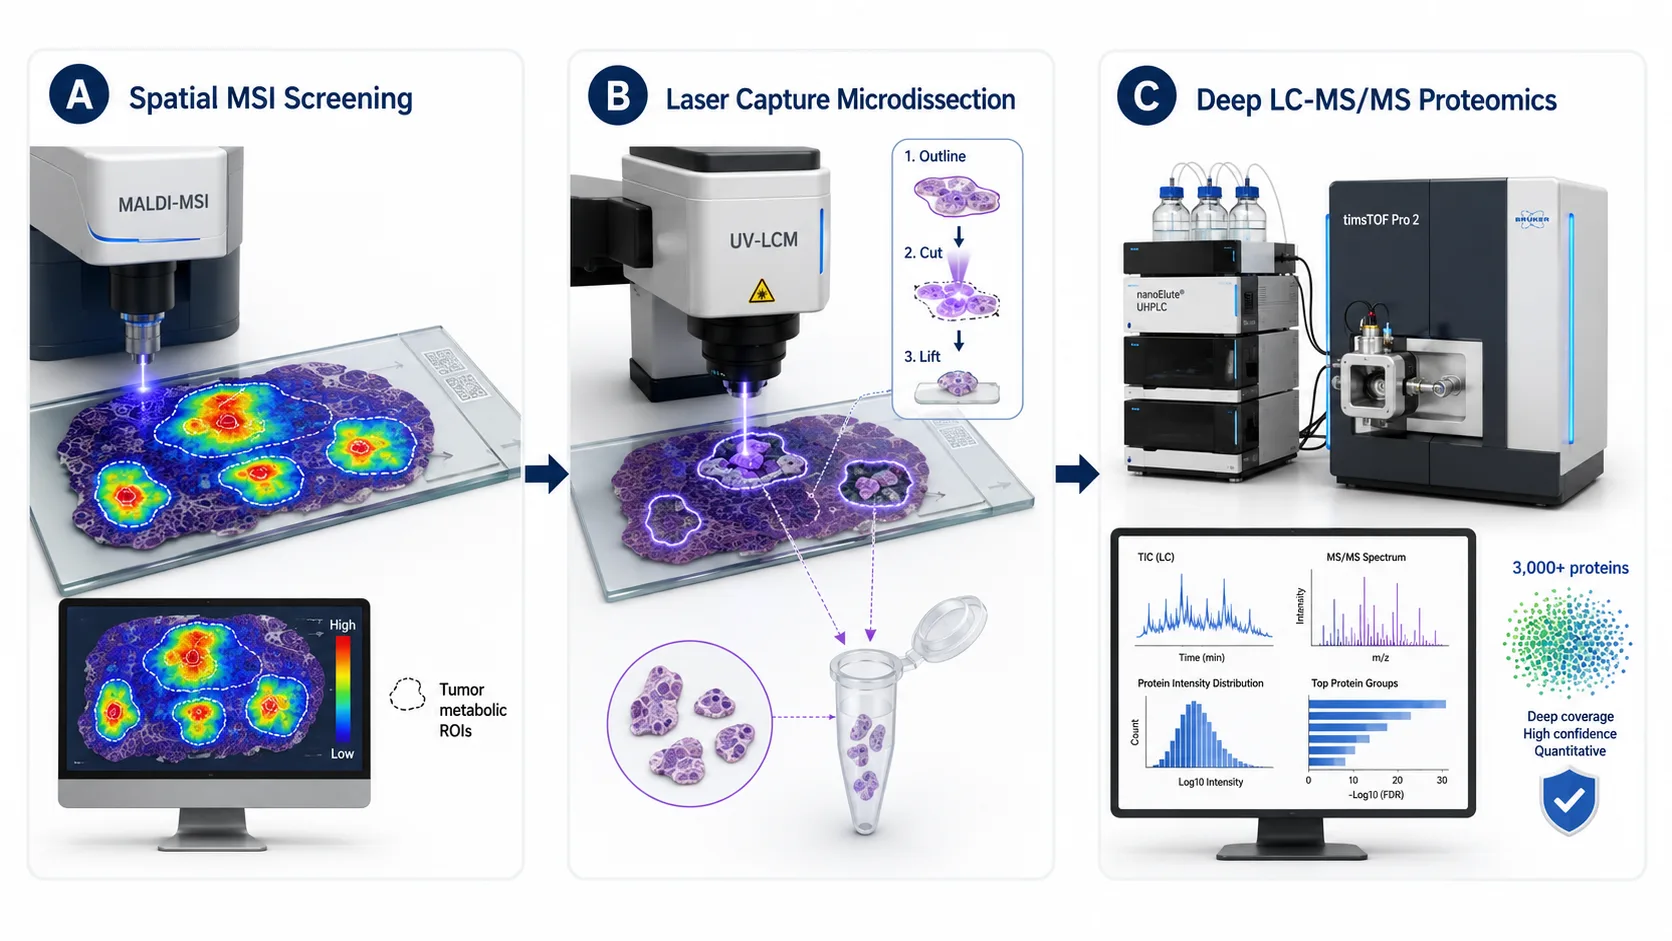 Figure 5: Matrix Washing and Tissue Conditioning Chemistry
Signal Attenuation Assessment: Impact of Prior Laser Desorption Shots
Laser rastering during the first MALDI-MSI pass consumes a thin top layer (100–300 nm) of the tissue surface. For subsequent tryptic peptide imaging, the underlying tissue layer remains intact; keeping laser fluence during the first metabolite pass at the minimum threshold required for ionization ensures the underlying protein matrix remains uncompromised for subsequent HIAR and trypsin digestion.
Quality Control Framework: Batch Effect Removal and Cross-Modality Normalization
Combining spatial metabolite intensity matrices with spatial peptide intensity matrices requires Total Ion Current (TIC) normalization to correct for regional matrix thickness variations and laser energy fluctuations. Applying unsupervised spatial clustering (t-SNE, UMAP, or K-means) in Bioinformatics for Proteomics integrates metabolite and peptide intensity vectors into unified spatial domain maps.
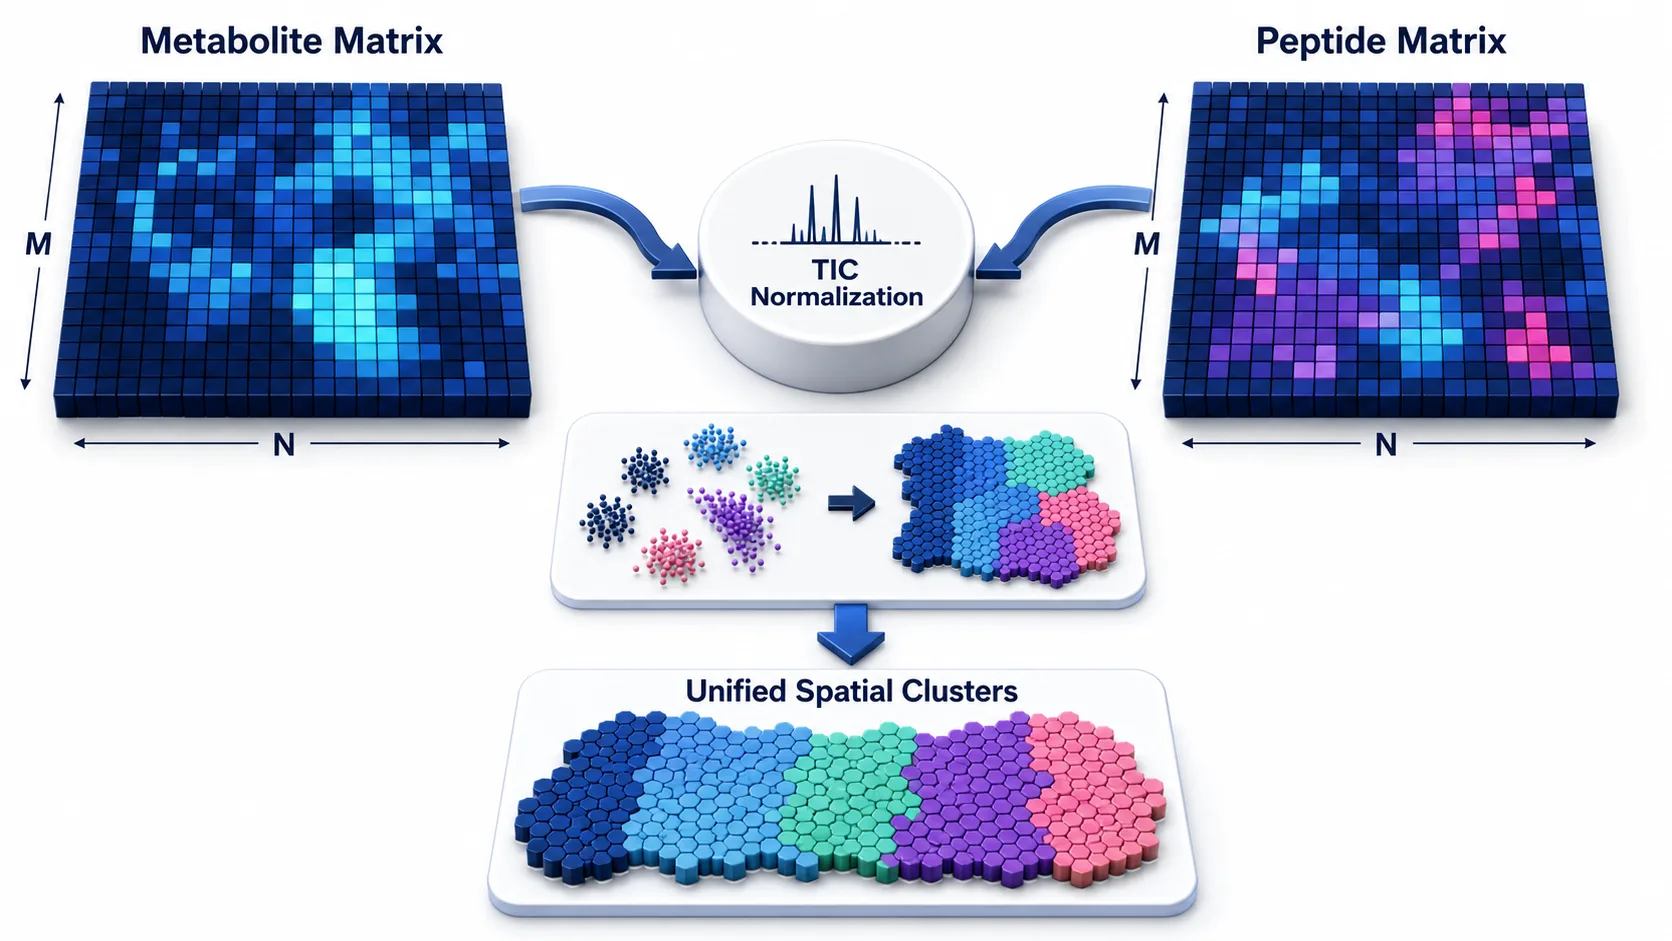 Figure 6: Data Integration & Spatial Normalization Architecture
Implementation SOP Pipeline for Multimodal Spatial Omics
To successfully execute same-section or serial-section spatial multi-omics in your laboratory, follow this four-stage implementation pipeline:
- Tissue Preparation & ITO Slide Sectioning: Mount fresh-frozen cryo-sections (8–10 μm) onto conductive ITO glass slides. Desiccate under vacuum for 30 minutes.
- Phase 1 MALDI-MSI (Metabolomics/Lipidomics): Spray 2,5-DHB or 9-AA matrix. Acquire high-resolution spatial metabolomics/lipidomics spectra.
- Phase 2 Matrix Wash & On-Tissue Proteomic Conditioning: Wash slide in 100% ethanol to remove matrix. Perform Carnoy's wash lipid depletion, HIAR (pH 9.0, 95°C for 15 min), and automated trypsin spraying (37°C for 3 hours). Coat with CHCA matrix.
- Phase 3 Proteomic Acquisition & Histology Co-Registration: Acquire spatial tryptic peptide MALDI-MSI spectra. Wash matrix, perform H&E staining, scan optical image, and execute digital co-registration and multi-omics spatial clustering.
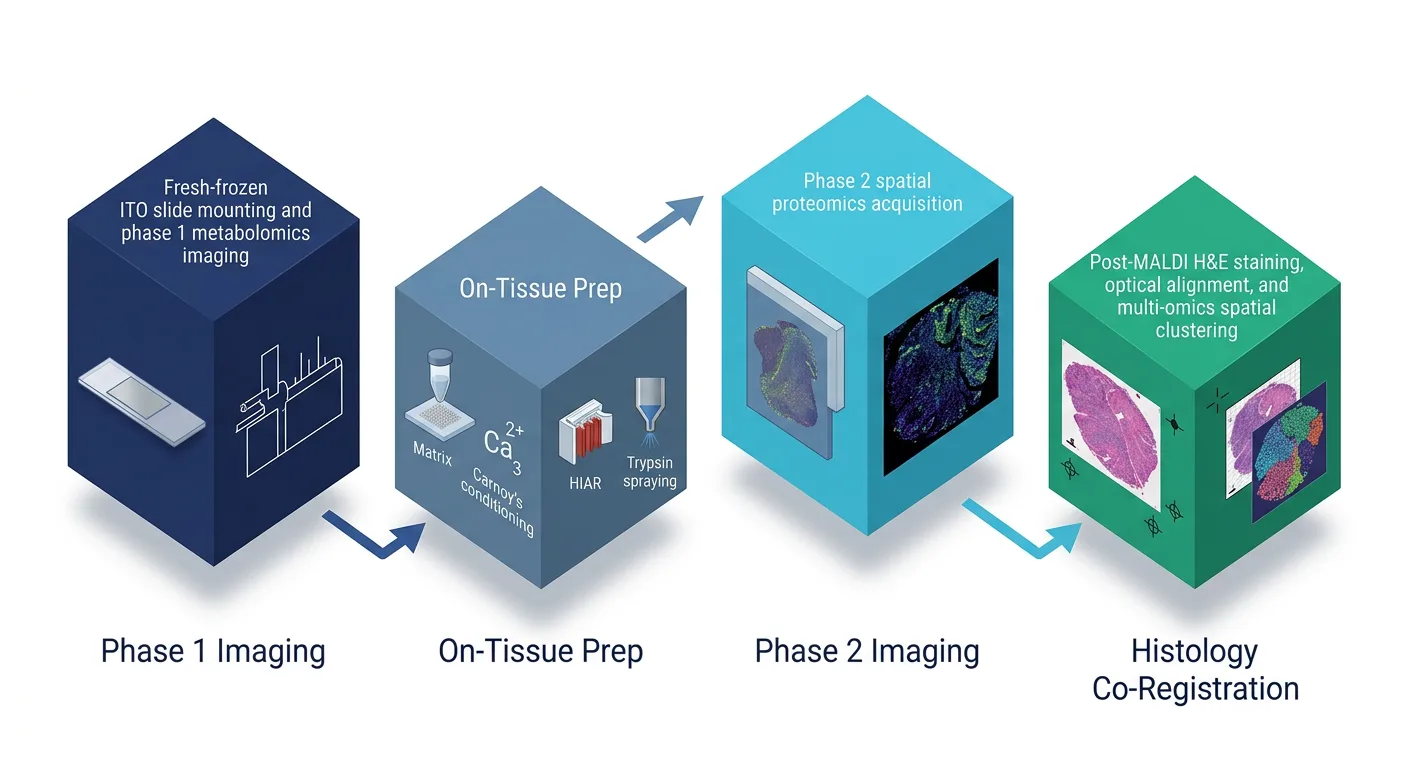 Figure 7: Four-Stage Multimodal Implementation SOP
Frequently Asked Questions (FAQ)
Why can't I image proteins first and then image small metabolites on the same tissue section?
Proteomics requires aqueous antigen retrieval (HIAR at 95°C) and enzymatic trypsin digestion. Performing these aqueous processing steps first completely washes out small polar metabolites and extracts membrane lipids from the tissue, destroying all metabolic information before imaging can occur. Small metabolites and lipids must always be imaged first.
Does the matrix washing solvent (e.g., ethanol/acetone) wash away fixed proteins or tryptic peptides?
No. Brief washes in cold 100% ethanol or acetone dissolve small organic matrix crystals (such as DHB or CHCA) without solubilizing high-molecular-weight proteins. Proteins remain firmly bound to the tissue extracellular matrix scaffold until trypsin enzyme is applied during the second phase.
What is the maximum spatial resolution offset observed between serial sections (5 μm apart)?
While serial sectioning maintains high molecular signal sensitivity, consecutive 5 μm cut slices typically exhibit 15 to 50 μm z-axis cellular displacement. In fine cellular structures (e.g., tumor micro-vessels or single glomeruli), this displacement introduces co-localization errors, making same-section sequential imaging superior for true single-cell multi-omics.
Can I perform both MALDI-MSI spatial metabolomics and IHC/IF staining on the same section?
Yes. Following MALDI-MSI spatial metabolomics or lipidomics data acquisition and matrix removal, the tissue section can be processed for classical immunohistochemistry (IHC) or immunofluorescence (IF) antibody staining, providing optical protein validation on the exact same tissue section.
How many cells or area are required for downstream LCM-LC-MS/MS after MALDI imaging?
Modern high-sensitivity mass spectrometers require approximately 100 to 1,000 micro-dissected cells (or 0.01 to 0.05 mm² tissue area) to yield comprehensive proteomic coverage of 1,000 to 3,000+ quantified proteins per ROI.
Which ionization polarity modes should be used for sequential lipidomics and proteomics?
Spatial lipidomics can be performed in either positive mode (for phosphatidylcholines and sphingomyelins) or negative mode (for phosphatidylethanolamines, phosphatidylinositols, and sulfatides) using 2,5-DHB or 9-AA matrix. Tryptic peptide spatial proteomics is almost universally performed in positive ionization mode using CHCA matrix.
How do I handle mass calibration across sequential MALDI runs on the same ITO slide?
Perform internal mass calibration using known ubiquitous endogenous lipid or matrix cluster signals during Phase 1, and standard tryptic peptide autolysis fragments (e.g., trypsin autolysis peak m/z 842.51 Da and 2,211.10 Da) during Phase 2.
Are these multimodal spatial workflows intended for clinical diagnostic testing?
All sample preparation workflows, sequential MALDI-MSI protocols, and multimodal spatial omics analytical frameworks described here are developed for Research Use Only (RUO). They serve as advanced research tools for biomarker discovery, drug mechanism evaluation, and spatial biology research, and are not intended for direct clinical diagnostic procedures.
References:
- Multimodal Imaging Research Consortium. (2024). Untargeted Spatial Metabolomics and Spatial Proteomics on the Same Tissue Section. ACS Analytical Chemistry, 96(50), 19820–19829. https://pubs.acs.org/doi/10.1021/acs.analchem.4c04462 (Open Access).
- Spatial Multiomics Integration Group. (2025). Comprehensive Approach for Sequential MALDI-MSI Analysis of Lipids, N-Glycans, and Tryptic Peptides. ACS Analytical Chemistry, 97(1), 112–124. https://pubs.acs.org/doi/10.1021/acs.analchem.4c05665 (Open Access).
- Single-Section Sequential MSI Group. (2026). Single-Section Sequential MALDI-MSI Reveals Metabolic and N-Glycan Spatial Alterations. MDPI Metabolites, 16(4), Article 217. https://www.mdpi.com/2218-1989/16/4/217 (CC BY 4.0 Open Access).
- Laser Capture Spatial Multiomics Study. (2025). Enhanced Spatial Proteomics and Metabolomics from a Single Tissue Section via LCM-Guided LC-MS/MS. Journal of Proteome Research, 24(11), 3200–3212. https://pubmed.ncbi.nlm.nih.gov/41170858/ (Open Access).
- Multimodal Molecular Imaging Institute. (2023). Multi-Modal Mass Spectrometry Imaging Reveals Single-Cell Spatial Metabolic Architecture. bioRxiv Preprint, DOI: 10.1101/2022.09.26.508878. https://www.biorxiv.org/content/10.1101/2022.09.26.508878.full (Open Access).












