


Introduction
Polysaccharide structural analysis addresses one of the most demanding challenges in carbohydrate chemistry: resolving the multi-layered architecture of these structurally complex biopolymers. A single chain can incorporate multiple sugar residues—glucose, galactose, mannose, xylose, arabinose, fucose, rhamnose, uronic acids, and amino sugars—connected through 1→2, 1→3, 1→4, or 1→6 linkages in either α- or β-anomeric configuration, with varying degrees of branching. No single analytical technique can fully characterize this multi-layered architecture. Comprehensive structural characterization requires an integrated multi-technique pipeline that sequentially addresses monosaccharide composition, glycosidic linkage positions, anomeric configuration, molecular weight, and higher-order conformation. This article provides a practical framework for navigating the full analytical workflow—from sample preparation through data integration—for researchers working with polysaccharides from plant, microbial, marine, and fungal sources.
The Structural Complexity of Polysaccharides
Unlike proteins and nucleic acids—linear polymers built from limited monomer sets connected by a single bond type—polysaccharides exhibit extraordinary structural heterogeneity at every level. Monosaccharide composition defines which sugar residues are present and in what molar ratios. Glycosidic linkage analysis reveals how these residues are connected: a glucose residue may be 1→4-linked (as in cellulose or starch), 1→3-linked (as in β-glucans), 1→6-linked (as in dextran branches), or participate in multiple linkage types simultaneously. Anomeric configuration (α or β) determines the stereochemistry at each glycosidic bond, with profound consequences for chain conformation and biological recognition. Branching introduces further complexity—arabinogalactans and pectic rhamnogalacturonans possess highly ramified structures with multiple branch points per repeating unit. Molecular weight spans from a few kilodaltons for defined oligosaccharides to several million daltons for high-Mw gums and exopolysaccharides, often with substantial polydispersity.
This multi-layered structural complexity defines biological function—from the immunomodulatory activity of β-glucans to the gelling behavior of carrageenans and alginates—but it also means that structural characterization demands a systematic, multi-technique approach. This is the analytical philosophy underlying modern polysaccharide analysis services: address each level of the structural hierarchy with the most appropriate technique, then integrate the data into a self-consistent model.
Sample Preparation Across Biological Sources
Sample preparation strategy is critically source-dependent and directly determines the quality of downstream structural data.
Plant Polysaccharides
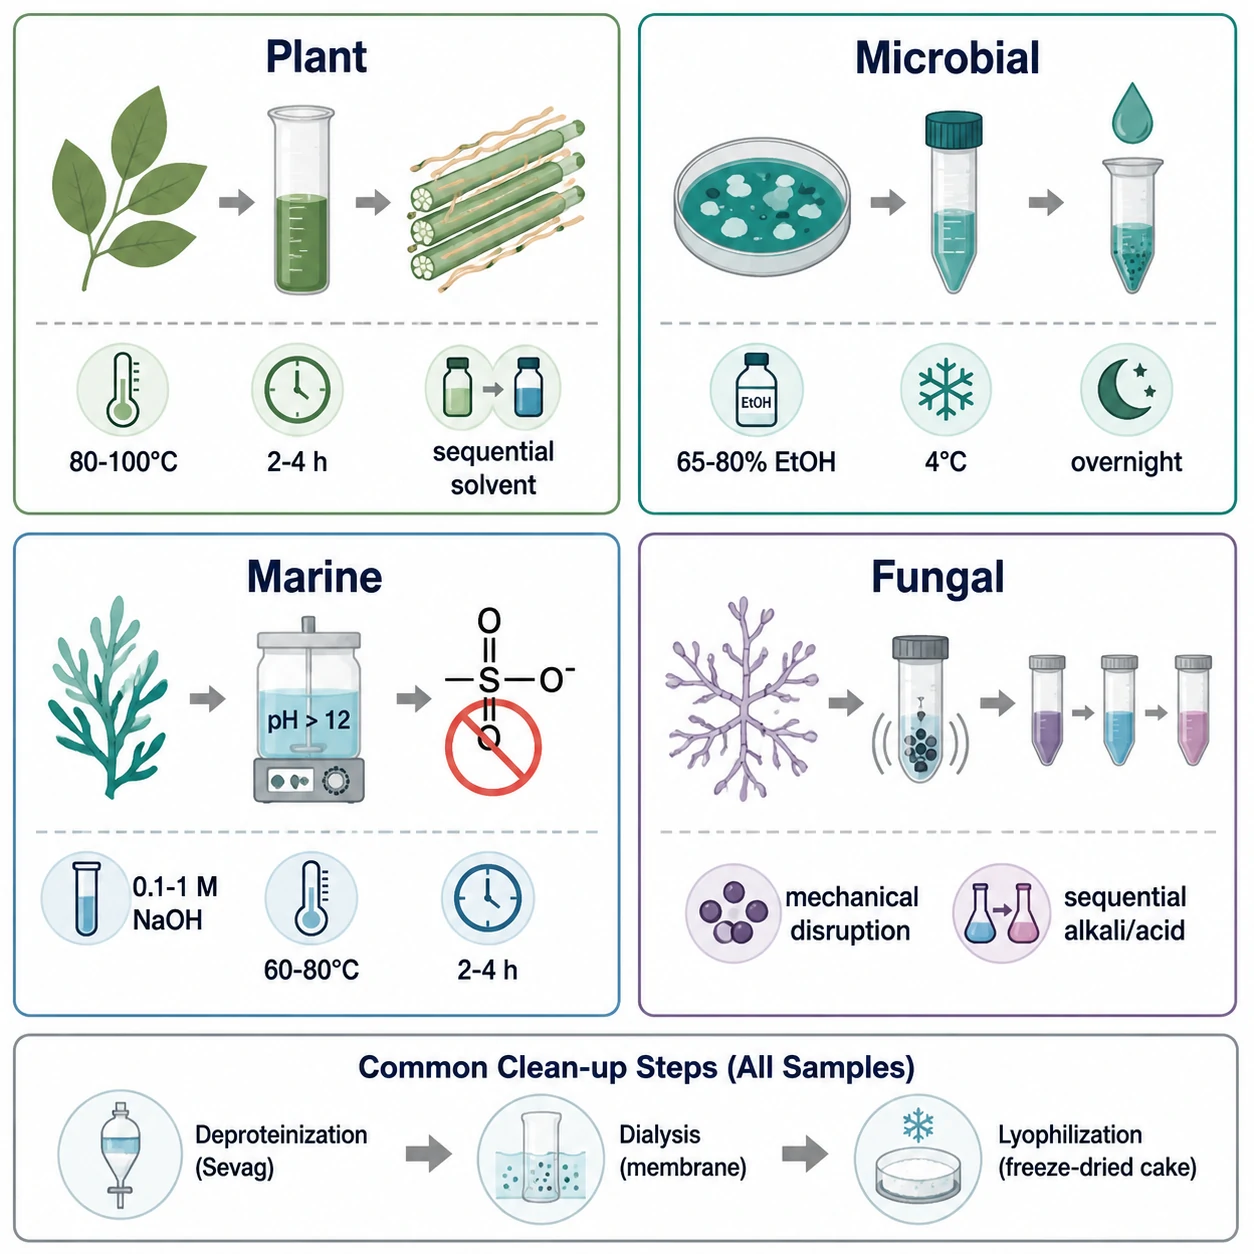
Plant cell wall polysaccharides—cellulose, hemicelluloses (xylans, mannans, xyloglucans), and pectins—require sequential extraction. Water-soluble polysaccharides are extracted first (hot water, 80–100 °C, 2–4 h), followed by chelator-soluble pectins (ammonium oxalate or EDTA, 20–50 mM), dilute alkali-soluble hemicelluloses (0.5–2 M KOH or NaOH with 10–20 mM NaBH₄ to prevent alkaline peeling), and finally strong acid hydrolysis for crystalline cellulose. Starch requires gelatinization (90–100 °C, 30 min) followed by enzymatic debranching with isoamylase or pullulanase.
Microbial and Fungal Polysaccharides
Exopolysaccharides (EPS) are recovered from culture supernatants by ethanol precipitation (65–80% v/v, 4 °C, overnight) after cell removal by centrifugation. Capsular polysaccharides (CPS) require preliminary alkaline (0.1 M NaOH, 60 °C, 1–2 h) or hot-water extraction to detach the capsule. Lipopolysaccharides (LPS) from Gram-negative bacteria are extracted by the hot phenol-water method, partitioning into the aqueous phase.
Marine Polysaccharides
Sulfated seaweed polysaccharides—carrageenans, agarans, fucoidans, ulvans—require extraction under conditions preserving labile sulfate esters: mild alkaline conditions (0.1–1 M NaOH or NaHCO₃, 60–80 °C, 2–4 h). Alginates are extracted with 1% Na₂CO₃ (60 °C, 2 h). For chitin, sequential demineralization (1 M HCl, room temperature) and deproteinization (1 M NaOH, 80 °C) precede structural analysis.
Universal Clean-Up
All crude extracts require deproteinization (Sevag reagent—CHCl₃/n-BuOH 4:1, repeated 3–5×; or 5–10% TCA), dialysis (3.5–14 kDa MWCO, 48–72 h), and lyophilization. Further fractionation by ion-exchange chromatography (DEAE-Sepharose, 0 → 2 M NaCl gradient) and size-exclusion chromatography (Sephadex G-100/G-200 or Sepharose CL-4B/CL-6B) yields homogeneous fractions. Purity is verified by UV scanning (A₂₈₀ for protein, A₂₆₀ for nucleic acids) and a single symmetric HPSEC peak. A dedicated polysaccharide isolation and purification service can provide standardized, quality-controlled starting material when in-house extraction expertise is unavailable.
Monosaccharide Composition Analysis
Monosaccharide composition analysis answers the most fundamental structural question: what sugars are present, and in what molar ratios?
Acid Hydrolysis
Trifluoroacetic acid (TFA, 2 M, 121 °C, 1–2 h) is the most broadly used hydrolysis reagent due to its volatility and ease of removal. Uronic acid-containing polysaccharides require a two-step approach: methanolic HCl (1 M, 80 °C, 16–24 h) for uronic acid release, followed by TFA for neutral sugars—or carboxyl reduction (NaBD₄ after carbodiimide activation) before TFA hydrolysis. Crystalline cellulose requires Saeman hydrolysis (72% H₂SO₄, room temperature, 45 min; dilution to 1 M; 100 °C, 3 h). Sulfated polysaccharides require prior desulfation (0.05 M HCl in dry methanol, room temperature, 4–6 h).
Derivatization and Chromatographic Platforms
Three complementary platforms are available. GC-MS with alditol acetate derivatization (NaBH₄ reduction → acetic anhydride acetylation) provides high-resolution separation and structural information from EI mass spectra, identifying neutral, amino, and (after reduction) acidic sugars against authentic standards. Trimethylsilyl (TMS) derivatization preserves the anomeric center and enables ketose/aldose distinction. HPAEC-PAD eliminates derivatization, achieving picomole sensitivity with CarboPac PA1 or PA20 columns and NaOH/NaOAc gradient elution. HPLC-UV with PMP (1-phenyl-3-methyl-5-pyrazolone) pre-column derivatization provides an accessible alternative on standard C18 reversed-phase columns with UV detection at 245 nm.
For most research applications, GC-MS offers the best balance of chromatographic resolution and structural information from a single analytical run. HPAEC-PAD is the method of choice when derivatization must be avoided—for example, in workflows coupled directly to enzymatic digestion or when quantifying acid-labile monosaccharide residues that may not survive derivatization conditions. HPLC-UV with PMP derivatization serves as a cost-effective alternative for laboratories without dedicated GC-MS or HPAEC-PAD infrastructure, though it provides less structural information than GC-MS and lower sensitivity than HPAEC-PAD. Each platform generates a monosaccharide profile from which molar percentages are calculated after normalizing peak areas to response factors from multi-level standard curves. The resulting sugar inventory forms the foundation against which all subsequent linkage and NMR data are validated—a principle central to every rigorous polysaccharide analysis workflow. When the analyte is a glycoprotein rather than a free polysaccharide, the monosaccharide composition data integrate with O-glycan and N-glycan profiling to provide a complete picture of glycan structures released from the protein backbone.
Glycosidic Linkage Analysis by Methylation-GC-MS
Glycosidic linkage analysis—determining the positions at which each sugar residue connects to its neighbors—is arguably the most structurally informative single experiment in the polysaccharide characterization pipeline. Methylation analysis has been the gold standard for over four decades.
Principle and Workflow
All free hydroxyl groups are converted to methyl ethers. Upon acid hydrolysis, methyl groups mark positions that were originally unsubstituted; positions that were acetylated (following reduction and acetylation) were originally involved in glycosidic linkages or ring closure. The resulting partially methylated alditol acetates (PMAAs) are identified by GC-MS.
The standard Ciucanu and Kerek protocol (1984) uses powdered NaOH in anhydrous DMSO with methyl iodide. A single round typically suffices for neutral polysaccharides; uronic acid-rich or highly hydrogen-bonded polysaccharides may require a second methylation cycle. Methylation completeness must be verified by FT-IR—complete disappearance of the O–H stretching band at ~3400 cm⁻¹ confirms full conversion.
Following methylation, the polymer is hydrolyzed (2 M TFA, 121 °C, 2 h), reduced with NaBD₄ (introducing deuterium at C-1 as an internal marker confirming sugar origin), and acetylated (acetic anhydride with 1-methylimidazole catalyst). PMAAs are extracted into dichloromethane for GC-MS analysis on a medium-polarity column (DB-23, 30 m × 0.25 mm × 0.25 μm; temperature program 80–250 °C).
Data Interpretation
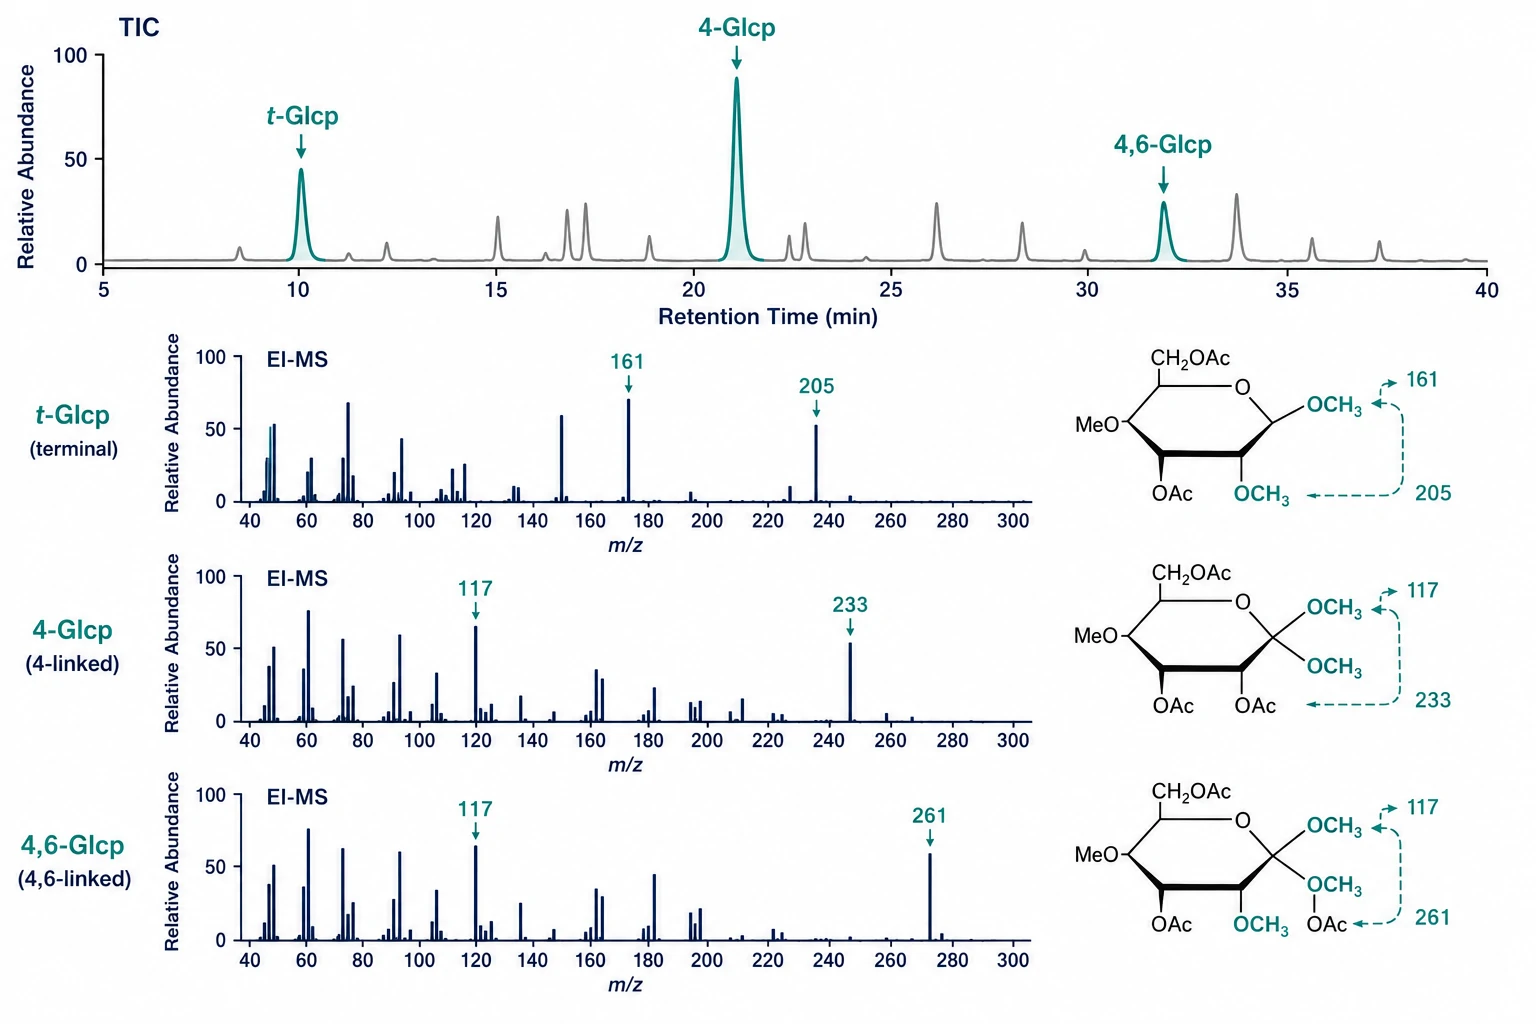
Each PMAA produces a diagnostic EI mass spectrum. Fragmentation between carbon atoms bearing methoxyl (originally free OH) and acetoxyl (originally linked) groups identifies substitution positions:
- Terminal (non-reducing) Glcp → 1,5-di-O-acetyl-2,3,4,6-tetra-O-methyl-glucitol → dominant m/z 161, 162, 205 (all ring positions methylated) - 4-Linked Glcp → 1,4,5-tri-O-acetyl-2,3,6-tri-O-methyl-glucitol → dominant m/z 117, 118, 233, 261 - 4,6-Linked Glcp (branch point) → 1,4,5,6-tetra-O-acetyl-2,3-di-O-methyl-glucitol → m/z 117 confirms both positions linked
A landmark 2026 study in Bioorganic Chemistry established a systematic PMAA database covering 92 glycosidic linkages across three column polarities, with DB-23 mid-polarity columns demonstrating optimal resolution for critical epimeric pairs (4-Glcp/4-Galp/4-Manp). A complementary 2025 Carbohydrate Polymers study introduced a PMAN (partially methylated aldononitrile acetate) library providing structurally distinct fragmentation patterns for resolving ambiguities in branched structures. These standardized reference libraries facilitate the definitive linkage assignments that are the hallmark of a thorough glycan sequencing service.
Quantitative linkage analysis expresses results as molar percentages after correcting for differential FID response. The linkage distribution must be cross-referenced against the independent monosaccharide composition for internal consistency.
Macromolecular Characterization by SEC-MALLS
While composition and linkage analyses define chemical structure at the residue level, macromolecular properties—absolute molecular weight, size, polydispersity, and solution conformation—govern physical behavior and biological function.
Conventional SEC calculates "relative" molecular weight by comparing elution volume to a calibration curve of narrow standards (pullulan or dextran). This approach fails when the analyte and calibrant have different solution conformations—a branched polysaccharide can appear 50–100% smaller by conventional SEC than its true mass. SEC-MALLS eliminates this problem by determining absolute Mw directly from light scattering intensity at each elution slice, independent of elution volume.
A standard SEC-MALLS-RI system couples a multi-angle laser light scattering detector, a differential refractive index (dRI) detector, and optionally a viscometer. The MALLS detector provides weight-average molecular weight (Mw), number-average molecular weight (Mn), polydispersity index (PDI = Mw/Mn), and radius of gyration (Rg) for each chromatographic slice. The dRI signal provides concentration. From plots of log Rg vs. log Mw (the conformation plot), the scaling exponent ν reveals molecular shape: ν ≈ 0.33 for compact spheres, 0.5–0.6 for random coils, and 0.9–1.0 for rigid rods.
Practical considerations include mobile phase selection (0.1 M NaNO₃ for neutral polysaccharides; 0.1–0.2 M NaCl/NaNO₃ for polyelectrolytes to screen charge effects), column pore size appropriate to the expected Mw range (TSKgel G6000PWXL or equivalent for >10⁶ Da), and rigorous filtration (0.1 μm mobile phase, 0.45 μm sample) to eliminate particulate scattering artifacts. For shear-sensitive high-Mw polysaccharides, Asymmetric Flow Field-Flow Fractionation (AF4) with on-line MALLS provides a gentler, column-free alternative. These measurements—particularly absolute Mw and PDI—are critical parameters in any molecular weight determination of polysaccharide workflow and essential for demonstrating batch-to-batch consistency in industrial applications.
NMR and Mass Spectrometry Confirmation
NMR spectroscopy provides the anomeric configuration and sequence information that methylation analysis alone cannot deliver.
One-Dimensional NMR
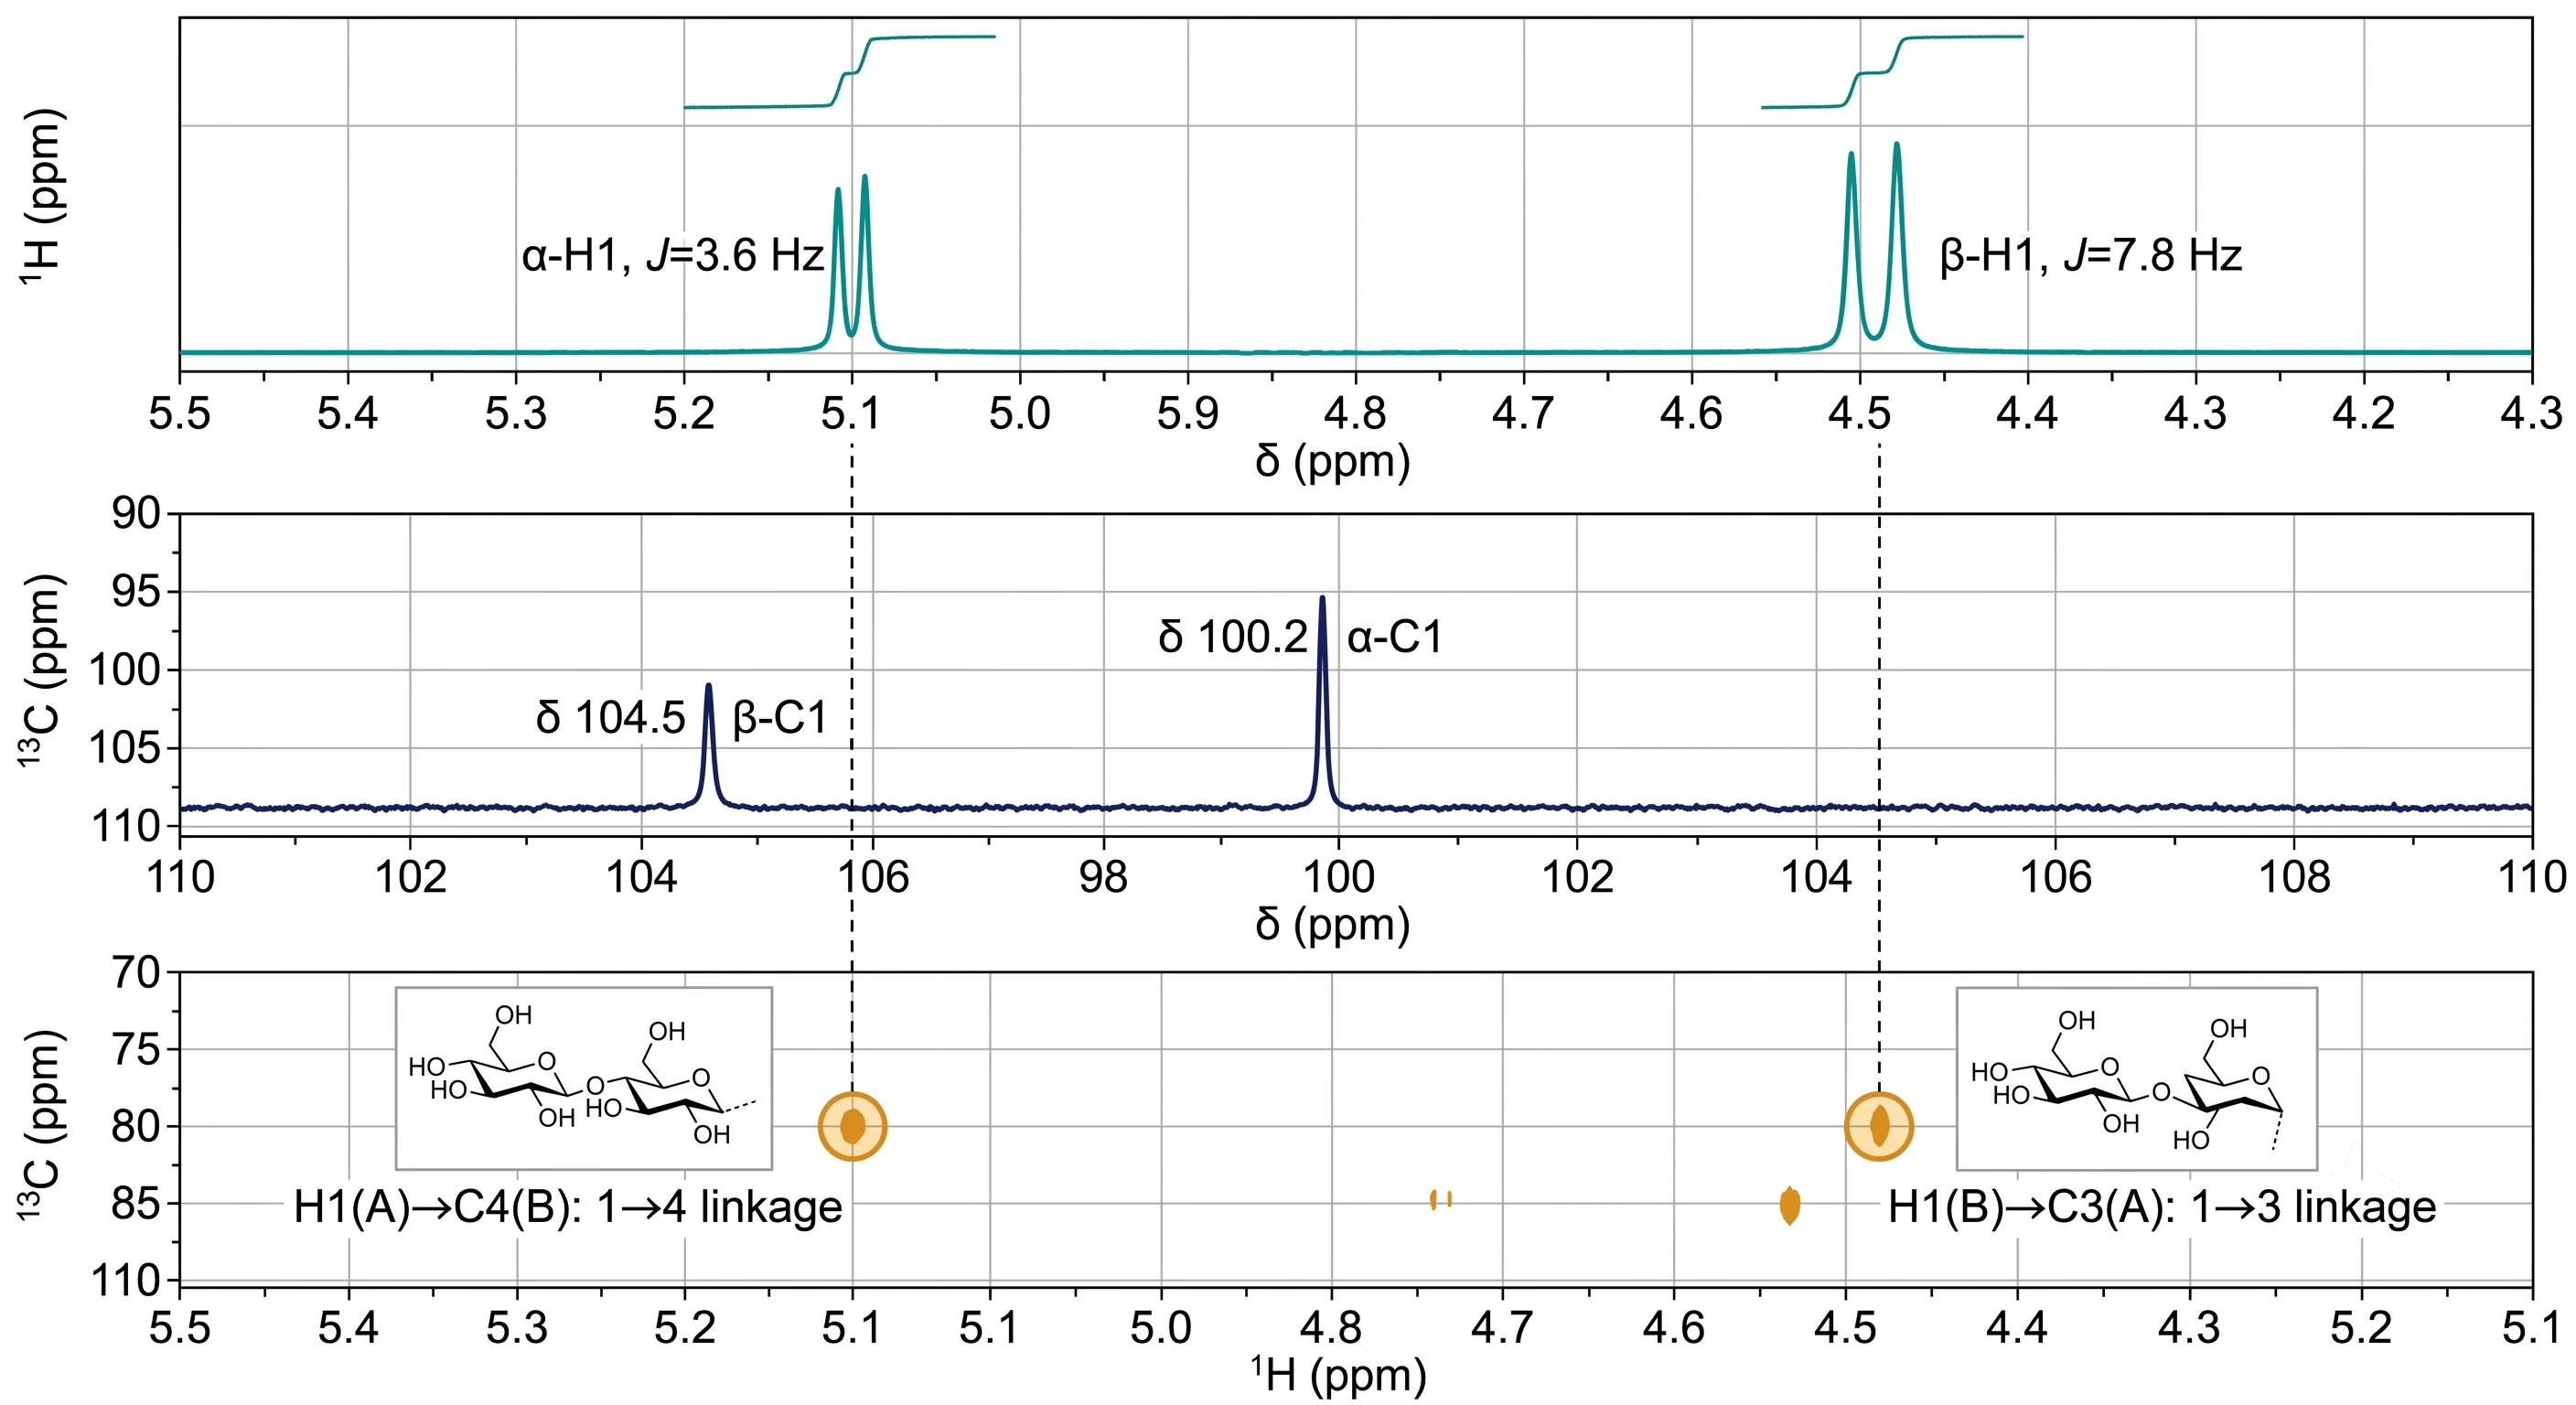
The ¹H NMR anomeric region (δ 4.3–5.5 ppm) is the most diagnostic spectral window. α-Anomeric protons resonate at δ 4.9–5.5 ppm (³J₁,₂ ≈ 3–4 Hz), while β-anomeric protons appear at δ 4.3–4.9 ppm (³J₁,₂ ≈ 7–8 Hz). Integration against an internal standard provides relative residue proportions. For glycoprotein-derived glycans, the anomeric region additionally reports on the N-glycan and O-glycan repertoire, linking monosaccharide composition data to site-specific information obtained from glycoproteomics by LC-MS/MS. The ring proton region (δ 3.2–4.3 ppm) typically shows extensive overlap in polysaccharides, limiting complete assignment.
¹³C NMR provides complementary resolution. Anomeric carbons appear at δ 90–110 ppm (β: δ 103–106 ppm; α: δ 98–103 ppm). Glycosylation at a specific carbon causes a characteristic downfield shift of 6–10 ppm (α-glycosylation effect), while adjacent carbons show smaller upfield shifts. Unsubstituted C-6 resonates at δ 60–62 ppm; C-6 involved in a 1→6 linkage shifts downfield to δ 66–70 ppm.
Two-Dimensional NMR for Assignment
For all but the simplest homopolysaccharides, 2D NMR is essential for unambiguous assignment. COSY traces through the proton spin system via ³JHH coupling (H-1→H-2→H-3→H-4→H-5→H-6). TOCSY extends correlations through the complete spin network. HSQC correlates each proton with its directly attached carbon, forming the foundation of any comprehensive assignment. Most critically, HMBC detects ¹H-¹³C correlations across glycosidic bonds (e.g., H-1 of residue A to C-4 of residue B for a 1→4 linkage), directly establishing sequence. NOESY or ROESY reveals through-space proton-proton proximity across the glycosidic linkage, confirming connectivity and providing conformational information on glycosidic torsion angles.
Mass Spectrometry for Fine Structure
MALDI-TOF MS (with 2,5-dihydroxybenzoic acid matrix) provides molecular weight profiles up to ~30 kDa. ESI-MS/MS of permethylated oligosaccharide fragments, with CID producing predominantly glycosidic bond cleavage (B/Y and C/Z ions) alongside cross-ring fragments (A/X ions at higher collision energies), provides sequence and branching information complementary to NMR. This combination of NMR for anomeric configuration and connectivity with MS for oligosaccharide sequence is the most robust approach for complete structural characterization of glycans.
Data Integration: Building a Structural Model
Each technique in the polysaccharide structural elucidation pipeline generates a piece of the puzzle. The analytical challenge—and where the interpretive expertise of a dedicated glycomics service adds the most value—is integrating these heterogeneous data threads into a self-consistent structural model.
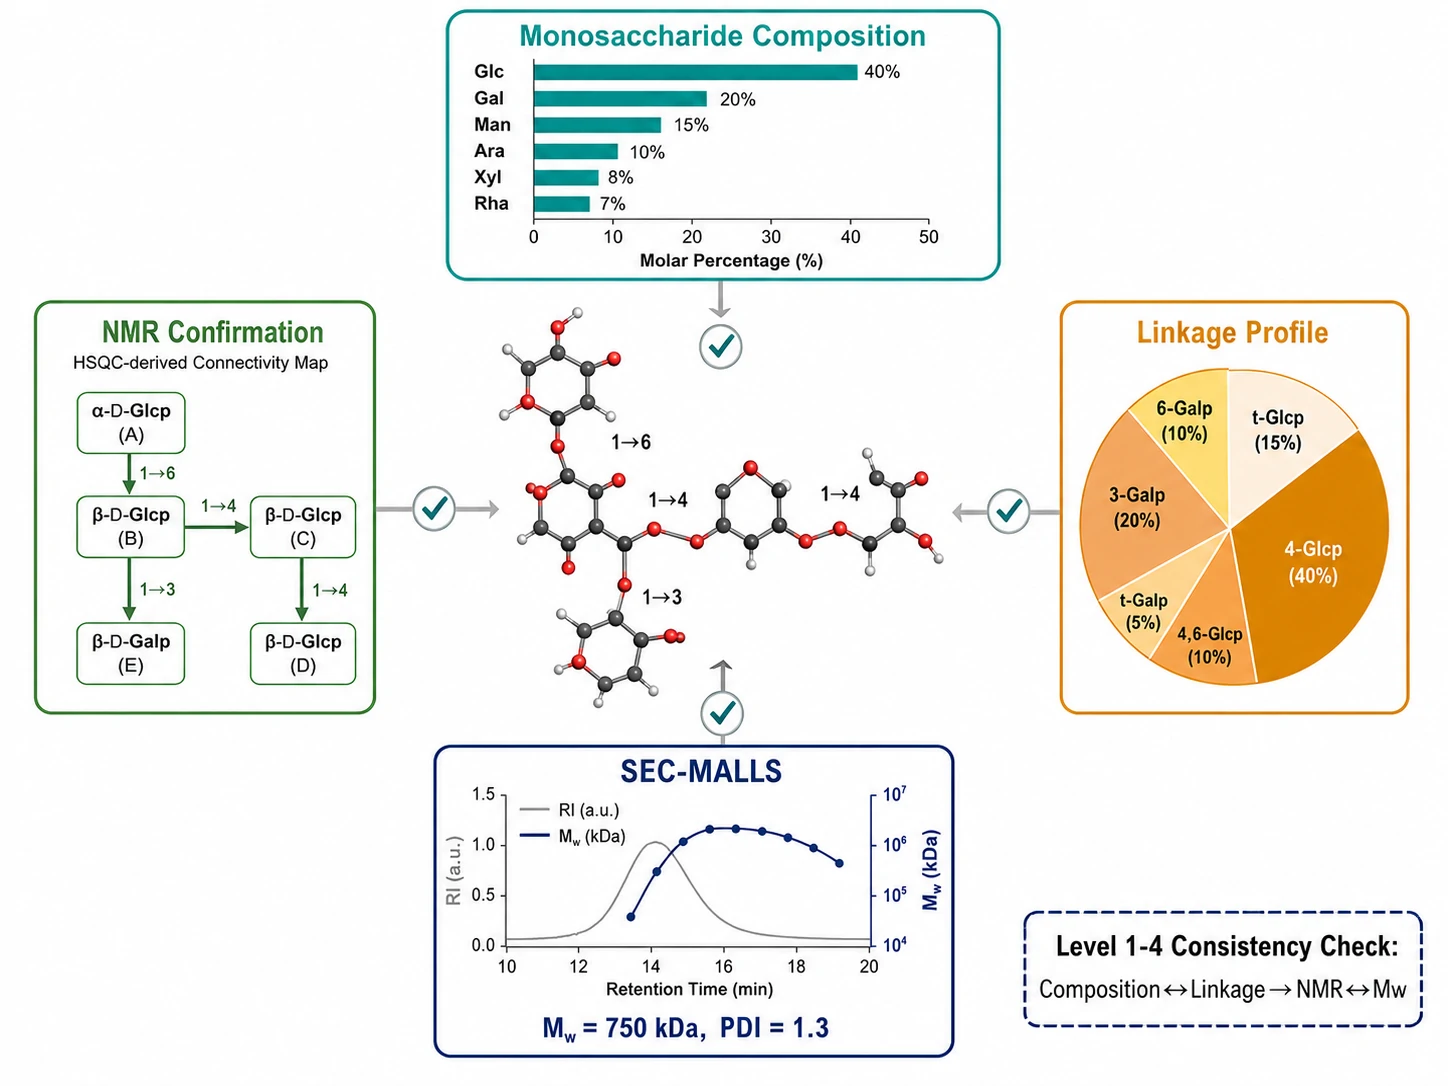
The integration framework operates across four levels:
Composition → Linkage Consistency. Total monosaccharide composition (mol%) must agree with the summed linkage distribution. If methylation analysis shows 35% 4-Glcp and 15% t-Glcp (total 50 mol% glucose-derived residues), the independent monosaccharide composition should report ~50 mol% Glc. Discrepancies >10–15% signal incomplete methylation, selective degradation, or PMAA co-elution—prompting systematic troubleshooting before proceeding.
Linkage → NMR Cross-Validation. Key linkage assignments from GC-MS must be corroborated by independent NMR evidence. A 1→3-Galp linkage must show C-3 of Galp shifted downfield by ~6–10 ppm in ¹³C NMR and an HMBC cross-peak from H-1 of the preceding residue to C-3 of the Galp. The anomeric configuration (α/β) from ³J₁,₂ must be consistent; ambiguous cases are resolved by ¹JCH measurement (≈170 Hz for α, ≈160 Hz for β).
Molecular Weight → Stoichiometry Reconciliation. Dividing absolute Mw (SEC-MALLS) by the repeating unit mass (from composition + linkage data) yields average degree of polymerization (DP). For a repeating unit of 500 Da and Mw of 750,000 Da, DP ≈ 1,500—physically reasonable. An implausible DP prompts re-examination of the proposed repeating unit or Mw determination.
Building and Refining the Model. A repeating unit consistent with all composition, linkage, and NMR connectivity data is proposed, validated against measured Mw, and refined for minor structural variants (partial branching, sub-stoichiometric modification, microheterogeneity). For complex heteropolysaccharides lacking a strict repeating unit—common in pectic polysaccharides and arabinogalactans—the model takes the form of a statistical description: average composition, linkage type distribution, degree of branching, and average molecular dimensions.
When ambiguity persists, enzymatic sequencing with linkage-specific glycosidases (e.g., α-1,4-glucosidase, β-1,3-glucanase, endo-polygalacturonase) followed by LC-MS or HPAEC-PAD profiling of released oligosaccharides resolves branching patterns and confirms anomeric assignments. This approach is particularly powerful when the organism's glycosyltransferase repertoire suggests the expected linkage types.
For projects investigating polysaccharide-protein recognition events—where structural data must be correlated with binding specificity—glycan microarray technology provides complementary functional validation. The complete data integration and modeling process benefits from bioinformatics for proteomics expertise, where multi-omics data integration frameworks developed for cross-platform structural validation apply directly to polysaccharide structural modeling.
Quality Control and Industrial Applications
Polysaccharide structural characterization increasingly serves industrial QC requirements. Polysaccharides used as pharmaceutical active ingredients (heparin), vaccine antigens (capsular polysaccharides), food texturizers (pectin, carrageenan, alginate), and biomaterials (chitosan, hyaluronic acid) all require demonstrated batch-to-batch structural consistency.
Critical Quality Attributes
| Attribute | Analytical Method | Example Acceptance Criterion |
|---|---|---|
| Identity (monosaccharide composition) | GC-MS or HPAEC-PAD | Molar ratios within ±10% of reference |
| Molecular weight (Mw) | SEC-MALLS | Within ±15% of reference; PDI ≤ 1.5 |
| Glycosidic linkage profile | Methylation-GC-MS | Key linkage ratios within ±15% |
| Branching degree | Methylation-GC-MS | Branch-point % within ±3% absolute |
| Sulfate content | Elemental analysis / IC | SO₄% within ±5% of target |
| Anomeric configuration integrity | ¹H NMR | Key anomeric signal ratio consistent |
The 2007–2008 heparin crisis—in which oversulfated chondroitin sulfate (OSCS) was used as an adulterant and caused an estimated 81 deaths in the United States—established the regulatory principle that orthogonal structural characterization is a non-negotiable component of polysaccharide QC. Standard pharmacopoeial tests of the era (anti-Factor Xa/anti-Factor IIa activity) failed to detect OSCS; the contaminant was identified by ¹H NMR (detecting an N-acetyl methyl signal at δ 2.02 ppm absent in heparin), ¹³C NMR, and SAX-HPLC—techniques now mandatory in the revised USP heparin monograph.
Emerging QC trends include enzymatic fingerprinting (panels of specific glycosidases generating characteristic oligosaccharide profiles by LC-MS), UPLC-QqQ-MS/MS for targeted glycosidic linkage screening (a 2026 Food Hydrocolloids study demonstrated MRM-based detection of permethylated oligosaccharide fragments as a faster complement to GC-MS), and chemometric batch comparability using PCA or PLS-DA of combined GC-MS, SEC-MALLS, and NMR datasets to detect multi-parameter structural shifts. These analytical approaches, part of a comprehensive glycomics service portfolio, provide the multi-orthogonal evidence required for robust polysaccharide identity and purity assessment.
This article is for research use only and is not intended for diagnostic or therapeutic purposes.
Frequently Asked Questions
Why can't a single analytical technique fully characterize a polysaccharide?
Polysaccharide structure operates at multiple hierarchical levels—monosaccharide identity, linkage position, anomeric configuration, branching pattern, molecular weight, and chain conformation—each requiring different analytical principles. No single instrument addresses all levels simultaneously.
What is the minimum sample amount for complete structural analysis?
For the full pipeline (composition + linkage + Mw + 1D/2D NMR), approximately 5–10 mg of purified homogeneous polysaccharide. Composition and Mw determinations each require 0.5–1 mg; methylation analysis 0.5–1 mg; comprehensive NMR 2–5 mg for overnight acquisition on a 500–600 MHz instrument with cryoprobe.
Which methylation protocol is most reliable for routine linkage analysis?
The NaOH/DMSO slurry method with methyl iodide (Ciucanu and Kerek, 1984) remains the standard for neutral and acidic polysaccharides. Microwave-assisted versions produce comparable results in 2–3 minutes. For base-sensitive polysaccharides (O-acyl or O-sulfate substituents), milder methyl triflate or diazomethane protocols are preferred.
How does SEC-MALLS differ from conventional column-calibrated SEC?
Conventional SEC reports relative molecular weight by comparing elution volumes to a calibration curve—this can deviate 50–100% if the analyte and calibrant have different solution conformations. SEC-MALLS determines absolute Mw from light scattering intensity at each elution slice, independent of elution volume.
What are the most common pitfalls in polysaccharide structural analysis?
(1) Incomplete methylation—verify by FT-IR (no residual OH at ~3400 cm⁻¹). (2) Uronic acid degradation—use methanolic HCl or carboxyl reduction before TFA hydrolysis. (3) PMAA isomer co-elution—select appropriate column polarity; DB-23 resolves most critical pairs. (4) Aggregation in SEC-MALLS—ensure adequate ionic strength. (5) NMR misassignment—confirm with at least two complementary 2D experiments.
How are sulfated polysaccharides handled in structural analysis?
Sulfated polysaccharides require desulfation (0.05 M HCl in dry methanol, 4–6 h, room temperature) before methylation, as sulfate groups block methylation at their attachment positions. Sulfate content is determined independently by elemental analysis or ion chromatography. Sulfate positions are inferred by comparing linkage profiles of desulfated vs. native polymer.
What is a realistic turnaround time for complete structural characterization?
For a purified homogeneous polysaccharide fraction, the full pipeline—composition, linkage, molecular weight, and 1D/2D NMR—can be completed in 2–3 weeks. Rate-limiting steps are methylation analysis (2–3 days) and 2D NMR acquisition (overnight scans for HMBC and NOESY/ROESY).
Can polysaccharide structure be inferred from genomic data?
Not reliably. While glycosyltransferase gene inventories suggest possible linkages, the actual product depends on coordinated expression, substrate availability, and non-template-driven processivity. Genomic information guides hypotheses but cannot substitute for direct analytical characterization.
References:
- Pettolino FA, Walsh C, Fincher GB, Bacic A. Determining the polysaccharide composition of plant cell walls. Nature Protocols. 2012;7(9):1590-1607. doi: 10.1038/nprot.2012.081.
- Sims IM, Carnachan SM, Bell TJ, Hinkley SFR. Methylation analysis of polysaccharides: a practical guide. Methods in Molecular Biology. 2022;2303:287-302. doi: 10.1007/978-1-0716-1398-6_23.
- Bajwa HK, O'Neill MA, York WS. Characterization of unfractionated polysaccharides in brown seaweed by methylation-GC-MS-based linkage analysis. Marine Drugs. 2024;22(10):464. doi: 10.3390/md22100464.
- Zhou Q, Yang K, Li J, et al. Marine algae polysaccharides: an overview of characterization techniques for structural and molecular elucidation. Marine Drugs. 2025;23(3):105. doi: 10.3390/md23030105.
- Guerrini M, Beccati D, Shriver Z, et al. Oversulfated chondroitin sulfate is a contaminant in heparin associated with adverse reactions. Nature Biotechnology. 2008;26(6):669-675. doi: 10.1038/nbt1407.
- Casillo A, Parrilli E, Sannino F, Corsaro MM. Sulfated polysaccharides from macroalgae—a simple roadmap for chemical characterization. Polymers. 2023;15(2):399. doi: 10.3390/polym15020399.














