

Glycan-Mediated Host-Pathogen Recognition
Every viral pandemic, every antibiotic-resistant bacterial outbreak, every fungal infection that takes hold in an immunocompromised patient begins with the same molecular event: a pathogen surface protein contacts a host glycan. Influenza hemagglutinin binds sialic acid on respiratory epithelial cells. SARS-CoV-2 spike protein engages heparan sulfate co-receptors before ACE2 docking. Helicobacter pylori BabA adhesin latches onto fucosylated Lewis b antigens in the gastric mucosa. Candida albicans recognizes host fucose and N-acetylglucosamine via multiple adhesins. These interactions are not generic charge-based associations — they are structurally specific, glycan-sequence-dependent binding events that determine tissue tropism, host range, and virulence.
Understanding this molecular recognition is the prerequisite for antiviral development, vaccine design, and diagnostic assay creation. But mapping glycan-protein interactions has historically been rate-limited by the structural complexity of the glycome. Unlike DNA or proteins, glycans are not linear biopolymers synthesized from a template — they are branched, heterogeneous, and combinatorially diverse. A single hexasaccharide can theoretically adopt more unique structures than the entire human proteome. Probing pathogen binding one glycan at a time is not practical.
Glycan microarrays solve this problem by presenting hundreds to thousands of structurally defined glycans in a spatially addressable format, allowing a single experiment to screen an entire glycan library against a pathogen protein, a whole virus particle, a bacterial adhesin, or even intact bacterial cells. The result is a binding specificity fingerprint — a quantitative map of which glycans a pathogen recognizes, how strongly, and with what structural selectivity. This article provides a practical platform-selection and workflow guide for researchers using glycan microarrays to study pathogen-glycan interactions, with a decision framework for matching platform choice to biological question.
Glycan Microarray Platforms: Three Technologies and When to Use Each
The term "glycan microarray" covers three fundamentally different technologies. Choosing the right platform is the single most consequential decision in experimental design, and the choice depends on whether your priority is structural diversity, quantitative throughput, or compatibility with live-cell screening.
Traditional Printed Glycan Microarrays
The printed array is the classic platform, pioneered by the Consortium for Functional Glycomics (CFG) and now deployed commercially and academically worldwide. Structurally defined glycans — isolated from natural sources, released from glycoproteins, or chemically/enzymatically synthesized — are printed onto NHS-ester or epoxide-functionalized glass slides at defined positions. Each glycan is printed in replicate (typically 4-6 spots), and a complete array may contain 100 to over 600 glycan structures. The printed array is interrogated with a fluorescently labeled or fluorescently detected analyte — a recombinant viral hemagglutinin, a GFP-tagged bacterial adhesin, a fluorophore-conjugated whole virus, or even fluorescently stained intact bacteria. After washing, the fluorescence intensity at each spot position is quantified, and a binding profile emerges.
Printed arrays dominate the literature because they offer the widest structural diversity and the most straightforward experimental protocol. The CFG array was instrumental in defining the sialic acid linkage preferences of pandemic versus seasonal influenza strains. The limitation is throughput: printed arrays interrogate one analyte per array, and array-to-array variability requires careful normalization. For Creative Proteomics clients studying pathogen-glycan interactions, glycan microarray assay services provide printed array platforms covering mammalian, microbial, and synthetic glycan libraries.
DNA-Encoded Glycan Arrays
DNA-encoded glycan libraries address the throughput limitation by replacing spatial encoding with molecular barcoding. Instead of printing each glycan at a known position on a slide, each glycan in the library is conjugated to a unique DNA oligonucleotide that serves as an amplifiable barcode. The entire library is incubated with the analyte of interest in solution. After binding, the DNA barcodes of bound glycans are recovered by PCR amplification and identified by next-generation sequencing. The number of NGS reads for each barcode is proportional to the amount of that glycan bound by the analyte, providing a quantitative binding profile.
The LiGA (Liquid Glycan Array) system, published in Nature Protocols in 2025, exemplifies this approach: DNA-barcoded M13 bacteriophages display glycans at controlled valency (5-1,500 copies per phage), and the glycan-displaying phage library is screened against live cells expressing glycan-binding proteins. Because the readout is NGS rather than fluorescence imaging, DNA-encoded arrays achieve higher quantitative dynamic range and can be screened against complex samples. Valency control is a distinctive advantage — by varying the number of glycan copies per phage, LiGA can distinguish high-avidity from low-avidity interactions, information that is inaccessible from printed arrays where glycan density is fixed. The trade-off is that library size is limited by the number of unique DNA barcodes available, and the conjugation chemistry for each glycan-DNA pair must be validated independently.
Bead-Based Multiplex Arrays (MGM and Related Platforms)
The Mammalian Glycan Microarray (MGM), developed as a successor to the CFG array, uses Luminex bead-based multiplexing. Each glycan is conjugated to a spectrally distinct bead population, and up to 500 bead populations can be combined in a single well. The analyte is incubated with the pooled bead library, and binding to each bead population is detected by flow cytometry — fluorescence intensity on the phycoerythrin channel indicates analyte binding, while the bead's spectral code identifies the glycan.
Bead-based arrays offer three practical advantages over printed arrays. First, the binding reaction occurs in solution, not on a planar surface, which more closely approximates physiological binding kinetics and eliminates surface artifacts. Second, each bead population provides thousands of replicate measurements in a single well, enabling robust statistics. Third, the multiplex format allows simultaneous screening of multiple analyte concentrations in parallel wells, generating full binding curves rather than single-concentration endpoints. The limitation is that the glycan library is pre-defined by the bead manufacturing process, and custom glycan addition requires bead conjugation optimization.
 Figure 1: Platform comparison matrix — 3 columns (Printed Array, DNA-Encoded Array, Bead-Based MGM) x rows covering: library size, quantitative dynamic range, throughput, compatibility with live cells, glycan valency control, custom glycan addition, equipment requirements, recommended use case.
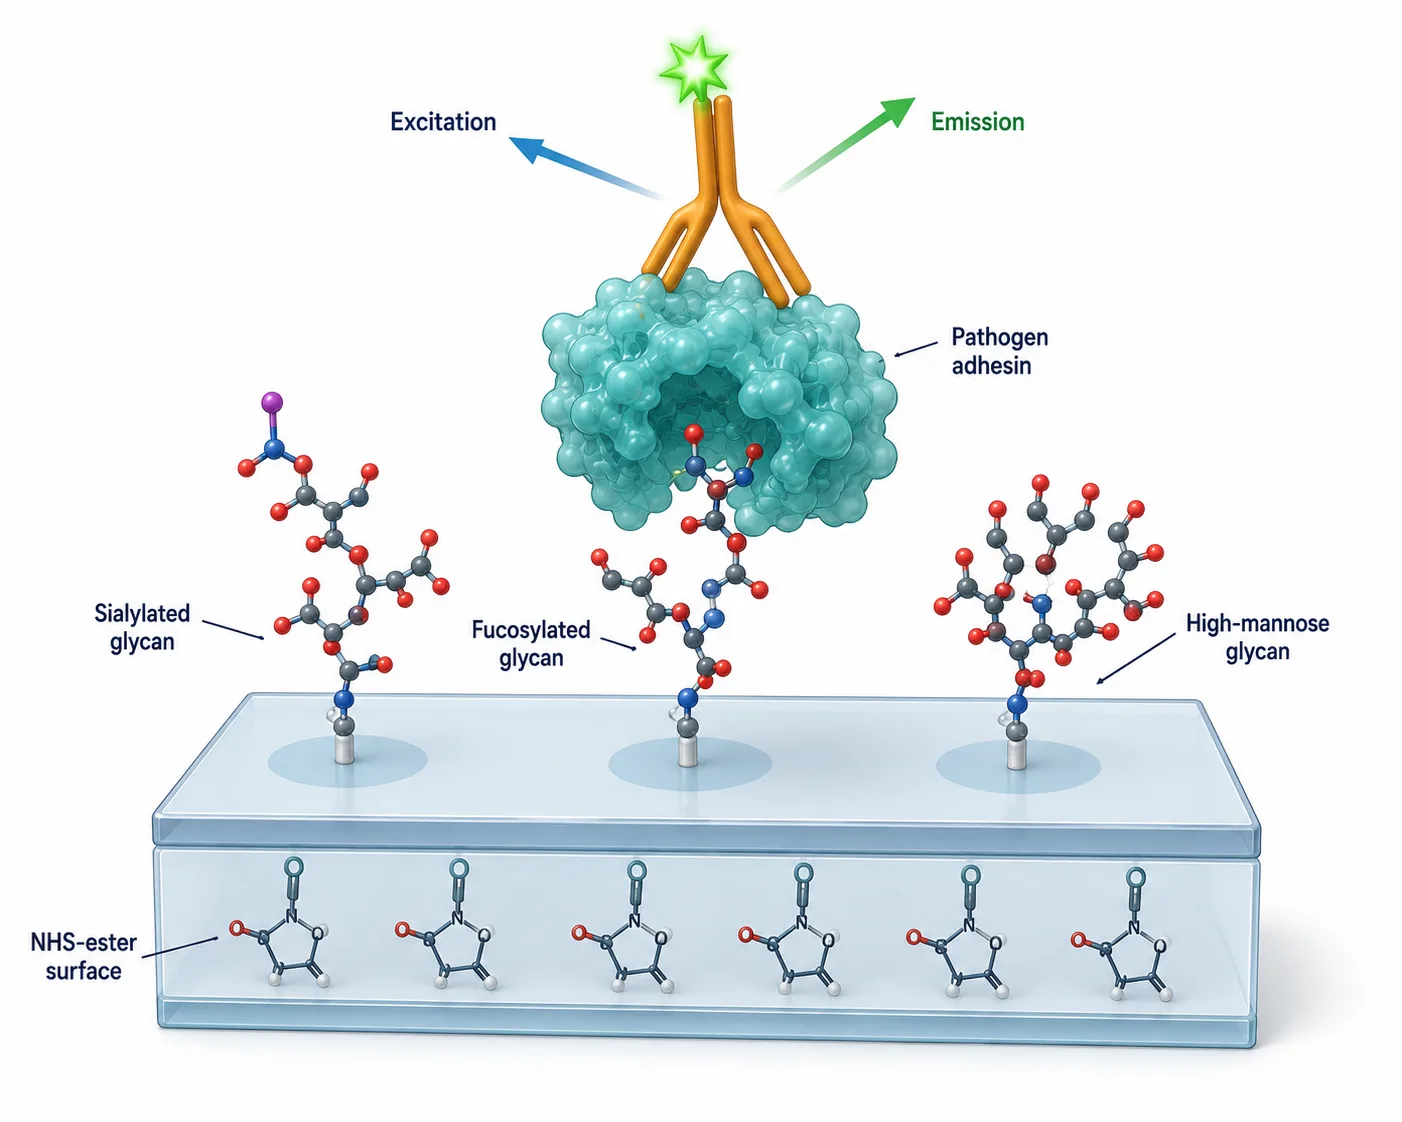 Figure 2: 3D isometric cutaway illustration of a glycan microarray surface showing chemically functionalized glass slide surface with printed glycan spots, a pathogen protein binding to a specific glycan spot, and fluorescently labeled secondary detection antibody. The molecular detail should show the glycan structure (branched hexasaccharide), the protein binding pocket engaging specific sugar residues, and the fluorescent readout mechanism.
For researchers requiring complementary lectin-based profiling alongside glycan arrays, Creative Proteomics provides lectin microarray assay services and comprehensive glycan-related microarray services spanning multiple detection modalities. For a side-by-side decision framework comparing these three platforms across key performance dimensions, see Figure 1.
Experimental Workflow: From Glycan Panel Design to Binding Data
A glycan microarray experiment for host-pathogen studies follows five sequential stages, and decisions made at each stage constrain what can be measured downstream.
Stage 1: Glycan Panel Design
The starting question is deceptively simple: Which glycans should go on the array? The answer depends on the pathogen and the hypothesis. For a broad receptor screen of a newly characterized viral hemagglutinin, a comprehensive panel of 300-600 mammalian N-glycans, O-glycans, glycolipids, and gangliosides is appropriate. For testing a specific hypothesis — "this bacterial adhesin recognizes blood group A antigen" — a focused panel of 20-50 blood group glycans and related structures is more efficient. For fungal host-pathogen studies, mannans and β-glucans must be included. The CFG and MGM libraries are well-characterized starting points; custom glycan addition is warranted when the pathogen's known host range or tissue tropism points to specific glycan structures not represented in standard libraries.
Stage 2: Array Printing and Surface Chemistry
Printed arrays require covalent immobilization of glycans to a functionalized surface. Most glycans are printed with a nucleophilic linker (amine or hydrazide) that reacts with NHS-ester or epoxide groups on the slide surface. The printing is done by a robotic microarray spotter under controlled humidity, and each glycan is printed at multiple concentrations to distinguish specific high-affinity binding from non-specific low-affinity adhesion. Neoglycoconjugates — glycans conjugated to a carrier such as bovine serum albumin or a polyacrylamide backbone — are used when the monovalent glycan-protein interaction is too weak to detect, as multivalent presentation amplifies binding avidity.
Stage 3: Quality Control
Before the biological experiment, the printed array must pass QC. A fluorescently labeled plant lectin with known specificity (typically ConA for mannose, WGA for GlcNAc/sialic acid, RCA-I for galactose) is used to verify that each glycan spot is present and accessible. Spots that fail lectin binding in QC are excluded from downstream analysis. For bead-based arrays, each bead population must generate the expected spectral code with acceptable CV.
Stage 4: Binding Assay
The analyte — recombinant protein, virus-like particle, whole inactivated virus, bacterial adhesin domain, or intact fluorescently labeled bacteria — is applied to the array at a defined concentration in binding buffer. For pathogen studies, biosafety considerations are paramount: live BSL-2 or BSL-3 pathogens typically cannot be used on open-format printed arrays, so recombinant proteins or inactivated particles are the norm. After incubation (typically 1-2 hours at room temperature with gentle rocking), unbound analyte is washed away, and bound analyte is detected either by direct fluorescence (if the analyte was pre-labeled) or by a fluorescently labeled secondary reagent (anti-His antibody for His-tagged proteins, anti-HA, or a fluorophore-conjugated antibody against the pathogen protein).
Stage 5: Data Extraction and Normalization
Fluorescence intensities are extracted from scanned array images using spot-finding software. Each glycan spot's intensity is background-subtracted, and replicate spots are averaged. Normalization is critical: the highest-binding glycan is typically set to 100%, and all other signals are expressed as relative fluorescence units (RFU) or as a percentage of the maximum. For bead-based arrays, median fluorescence intensity (MFI) is extracted from the flow cytometer output. The output is a binding profile — a ranked list of glycans by binding strength — that can be visualized as a bar chart, heatmap, or clustered binding fingerprint.
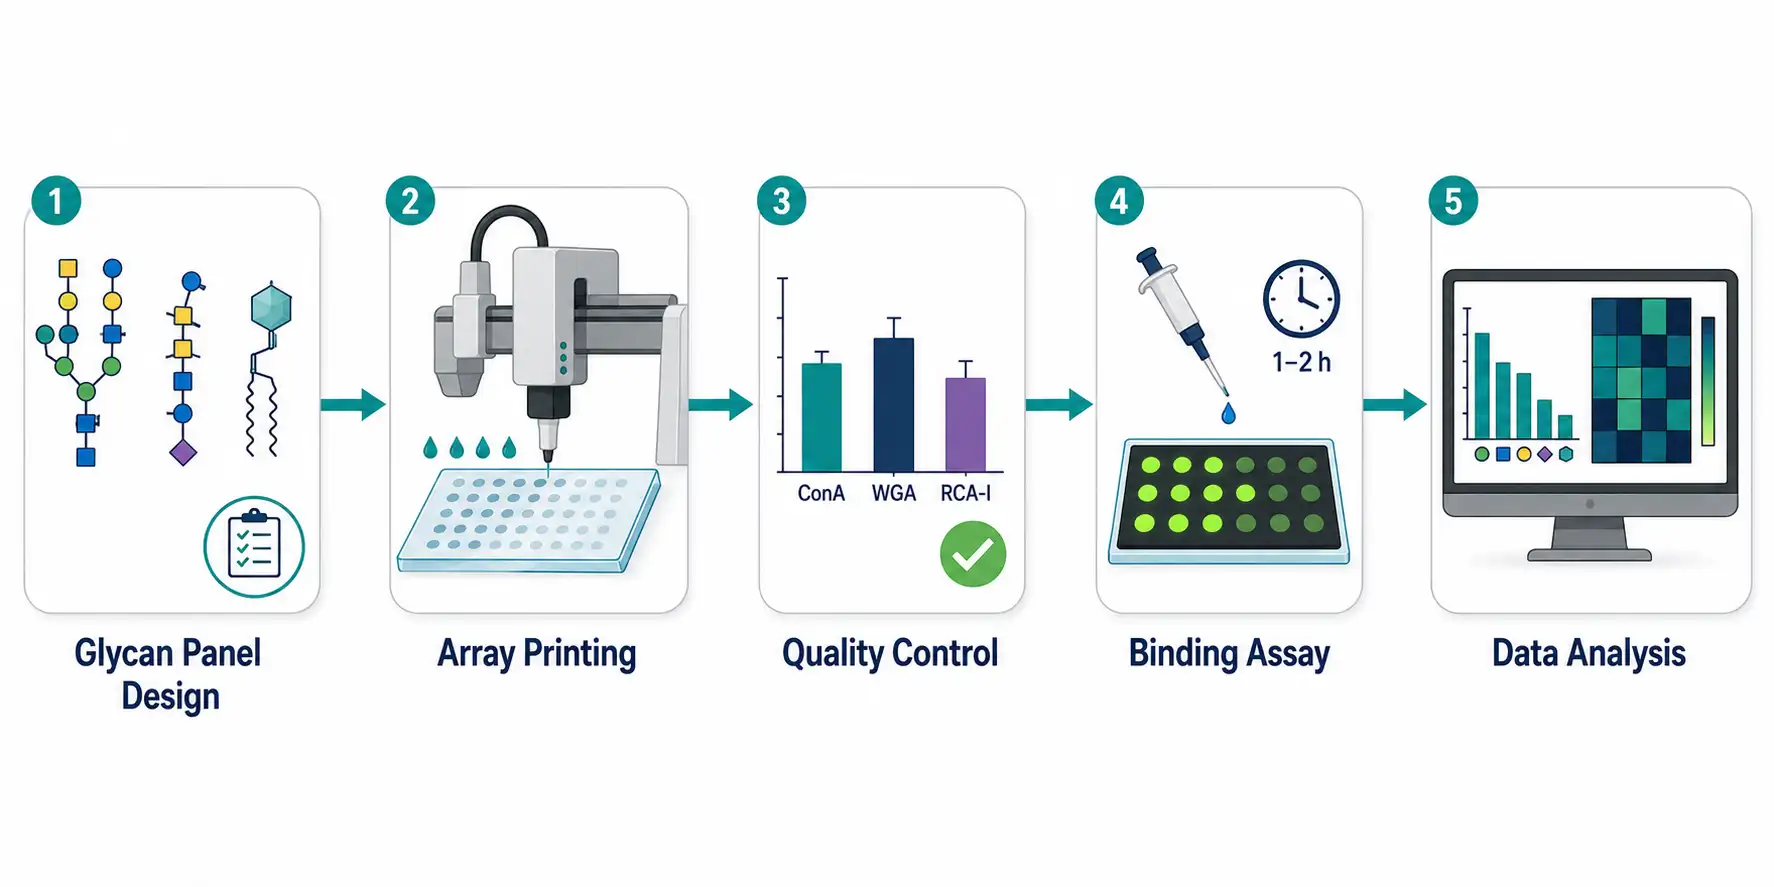 Figure 3: Complete glycan microarray workflow flowchart — 5 stages in horizontal flow: (1) Glycan Panel Design — icons for natural glycans, synthetic glycans, glycoproteins; (2) Array Printing/Surface Chemistry — robotic spotter schematic; (3) Quality Control — lectin QC with ConA/WGA; (4) Binding Assay — pathogen protein incubated on array with fluorescent detection; (5) Data Extraction — fluorescence intensity bar chart output.
For researchers analyzing pathogen glycans specifically, Creative Proteomics offers microbial glycan microarray assay services with pathogen-specific glycan libraries and structural characterization of glycans for custom glycan probe development.
Host-Pathogen Applications Across Viral, Bacterial, and Fungal Systems
Viral Glycan Recognition
The influenza virus field is the canonical example of glycan microarray-driven discovery. The hemagglutinin (HA) of human-adapted influenza A viruses preferentially binds α2,6-linked sialic acid (abundant in the human upper respiratory tract), while avian-adapted strains prefer α2,3-linked sialic acid (abundant in the avian gut). This linkage specificity, mapped exhaustively on printed glycan arrays, explains host tropism and pandemic potential. When a novel avian influenza strain acquires α2,6-binding capability through HA mutations, the glycan array signal shifts, providing an early warning of pandemic adaptation. The 2024 H5N1 outbreak in dairy cattle was rapidly characterized using glycan array profiling of the HA receptor-binding domain, which confirmed retention of avian-like α2,3 preference but with detectable binding to human-type receptors in the bovine mammary gland context.
SARS-CoV-2 spike protein glycan array studies revealed a different binding strategy. Unlike influenza HA, which engages terminal sialic acid, the SARS-CoV-2 spike receptor-binding domain (RBD) recognizes the ACE2 protein receptor — glycans are not the primary receptor. However, glycan arrays demonstrated that the spike protein also binds heparan sulfate, which serves as an attachment co-receptor that concentrates virus particles on the cell surface before ACE2 engagement. This two-step mechanism — heparan sulfate co-receptor followed by ACE2 docking — was elucidated in part through glycan array screening.
HIV gp120 presents a unique case in glycan array analysis. The heavily glycosylated HIV envelope protein uses host N-glycans as a "glycan shield" to evade antibody recognition, yet broadly neutralizing antibodies (bNAbs) isolated from elite controllers target clusters of these same glycans. Glycan array profiling of bNAbs from HIV-infected individuals has identified the specific high-mannose and complex glycan epitopes recognized by protective antibodies, directly informing immunogen design for vaccine development.
Bacterial Adhesin and Toxin Profiling
Bacterial pathogens use glycan-binding proteins — adhesins and toxins — for host cell attachment and invasion. Glycan arrays have mapped the carbohydrate specificity of Helicobacter pylori BabA (Lewis b antigen), Vibrio cholerae cholera toxin B subunit (GM1 ganglioside), Pseudomonas aeruginosa LecA and LecB (galactose and fucose, respectively), uropathogenic E. coli FimH (mannose), and Clostridium difficile toxin A (Galα1-3Galβ1-4GlcNAc). In each case, the glycan array provided a quantitative binding profile that explained the tissue tropism of the pathogen and identified potential glycan-based inhibitors.
For uropathogenic E. coli, glycan array screening identified mannose-based oligosaccharides with nanomolar affinity for FimH, which are now under investigation as non-antibiotic therapeutic candidates for recurrent urinary tract infection. The key insight from array data was that FimH binds mannose in a specific conformational context — terminal α-D-mannose presented on a flexible linker — that is not reproduced by all mannose-containing glycans.
Fungal Host-Pathogen Interactions
A 2025 PNAS study using synthetic glycan microarrays profiled IgM and IgG antibody responses in humans and mice to Candida species, identifying β-glucan-directed IgM as the early response and oligomannose-directed IgG as the later, species-discriminating response. A single β-(1,2)-mannose monomer could distinguish Candida albicans from C. glabrata, C. parapsilosis, and the emerging multidrug-resistant pathogen C. auris — a finding with direct diagnostic implications. Glycan arrays thus serve not only to probe pathogen protein-glycan binding but also to map the host anti-glycan antibody response as a readout of infection.
Kinetic Validation: From Array Hits to Quantitative Binding Data
A glycan array provides a binding fingerprint — which glycans bind and their relative ranking — but array data are semi-quantitative. The avidity-driven, multivalent nature of glycan array binding means that the signal intensity reflects both affinity and valency, and these two contributions cannot be deconvoluted from array data alone. For applications requiring true binding constants — drug development, inhibitor optimization, structural biology — orthogonal validation by surface plasmon resonance (SPR) or biolayer interferometry (BLI) is essential.
SPR/BLI Orthogonal Validation
SPR measures the change in refractive index at a sensor chip surface as analyte binds to immobilized ligand. For glycan-protein interactions, the glycan is typically immobilized on the chip surface (via biotin-streptavidin capture or direct amine coupling), and the pathogen protein or virus particle is flowed over the surface in solution. As the analyte binds, the SPR signal increases; when buffer replaces analyte, the dissociation phase begins. Fitting the association and dissociation curves yields ka, kd, and the equilibrium dissociation constant KD. BLI uses a similar principle but detects binding through interference pattern shifts, enabling higher throughput with disposable biosensor tips.
The kinetic validation pipeline is strategically important because it separates specific, high-affinity interactions from the polyreactive binding that glycan-binding proteins often display on arrays. A lectin or adhesin may bind 50 glycans on an array, but SPR reveals that only three of those interactions have KD values below 10 µM — the affinity threshold generally considered biologically meaningful for a monovalent carbohydrate-protein interaction.
Creative Proteomics provides SPR services for kinetic validation of glycan-protein interactions identified by glycan array screening.
Cryo-EM Integration for Structural Mechanism
The combination of glycan array epitope mapping and cryo-electron microscopy is the current gold standard for understanding viral-glycan interactions at atomic resolution. The workflow is: glycan array identifies the preferred glycan ligand → SPR quantifies the binding affinity → cryo-EM of the viral protein-glycan complex reveals the interacting residues, the bound glycan conformation, and the structural basis of specificity. This array-to-structure pipeline has been applied to influenza HA, SARS-CoV-2 spike, rotavirus VP8*, norovirus capsid proteins, and multiple bacterial adhesin-glycan complexes. The structural information feeds directly into structure-based drug design — if you can see exactly how a glycan sits in a viral binding pocket, you can design a glycomimetic inhibitor that occupies the same pocket with higher affinity.
Data Analysis: From Fluorescence Intensities to Biological Meaning
Raw glycan array data — a spreadsheet of fluorescence intensities for hundreds of glycans — requires structured analysis to extract biological patterns. The analysis pipeline follows a standard sequence: background subtraction → replicate averaging → normalization (typically to the highest-binding glycan or to an internal reference glycan) → thresholding to define positive hits → clustering to group glycans by structural features → motif extraction to identify the minimal glycan epitope sufficient for binding.
The motif extraction step is where biological insight emerges. If a pathogen protein binds a set of 15 related glycans, structural comparison of the positive hits identifies the shared motif — a terminal sialic acid in α2,3-linkage, a fucosylated LacNAc, a high-mannose patch — that defines the binding specificity. This motif is the actionable output: it tells the researcher exactly what structural feature to target with an inhibitor, what type of glycan to include in a vaccine conjugate, or what glycan variation distinguishes a pandemic from a seasonal viral strain.
Several open-source and web-based tools support glycan array data analysis, including the CFG Glycan Array Dashboard for binding profile visualization and motif extraction tools for identifying the minimal glycan epitope from positive hits. For large-scale studies, custom R or Python scripts using the CFG glycan structure database enable automated motif mining across multiple array experiments. Cross-experiment statistical comparison is the critical step for host-pathogen studies aiming to discriminate pathogen strains: statistical tests (t-test, ANOVA, or non-parametric equivalents applied to normalized RFU values across biological replicates) identify glycans whose binding differs significantly between, for example, a low-pathogenicity and a high-pathogenicity viral strain — these differentially bound glycans are the candidates that explain altered tissue tropism.
For researchers requiring bioinformatics support for glycan array data interpretation, Creative Proteomics offers bioinformatics services including glycan array data processing, binding motif identification, and cross-experiment comparison. For glycopeptide-level host-pathogen interaction studies, glycopeptide microarray assay services enable screening of pathogen proteins against glycopeptide libraries that preserve the peptide context of glycosylation.
Emerging Technologies: Single-Cell Resolution and AI-Driven Glycan Recognition
Two emerging capabilities are reshaping glycan microarray research in 2025-2026.
Single-cell glycan array analysis addresses a fundamental biological reality: glycan-binding protein expression is heterogeneous across cell populations. A bulk lectin staining experiment reports an average, but single-cell resolution reveals that only a subpopulation of immune cells expresses a particular glycan receptor. Microfluidic droplet-based approaches encapsulate individual cells with glycan-functionalized beads, and the binding of beads to each cell is scored by fluorescence microscopy, generating single-cell glycan-binding profiles. This approach is in early development but promises to identify rare cell populations defined by their glycan-binding specificity — relevant for understanding how specific immune cell subsets respond to pathogen glycans.
AI-driven glycan recognition prediction uses deep learning to predict glycan-protein binding from sequence and structure. Graph neural networks trained on glycan array datasets can now predict, for a given protein sequence, which glycans it will bind — without running an array experiment. Multi-task models predict not only whether a protein binds a glycan but also the glycan's structural class (high-mannose, complex, hybrid), the terminal epitope (sialylated, fucosylated), and a predicted KD range. These models are not yet accurate enough to replace arrays, but they serve as a prioritization tool: for a newly sequenced viral hemagglutinin, the AI model can predict which subset of a 600-glycan library is most likely to be bound, focusing validation experiments on the top 50 candidates.
Training data quality is the rate-limiting factor — model accuracy correlates directly with the diversity and curation of the underlying glycan array datasets. Community efforts to standardize glycan array data deposition in public repositories (GlyGen, SugarBind) are accelerating model development. Combined with structural prediction tools such as AlphaFold, the AI-plus-structure pipeline can generate testable glycan-binding hypotheses from sequence alone, compressing a workflow that previously required months of array experimentation into days of computation.
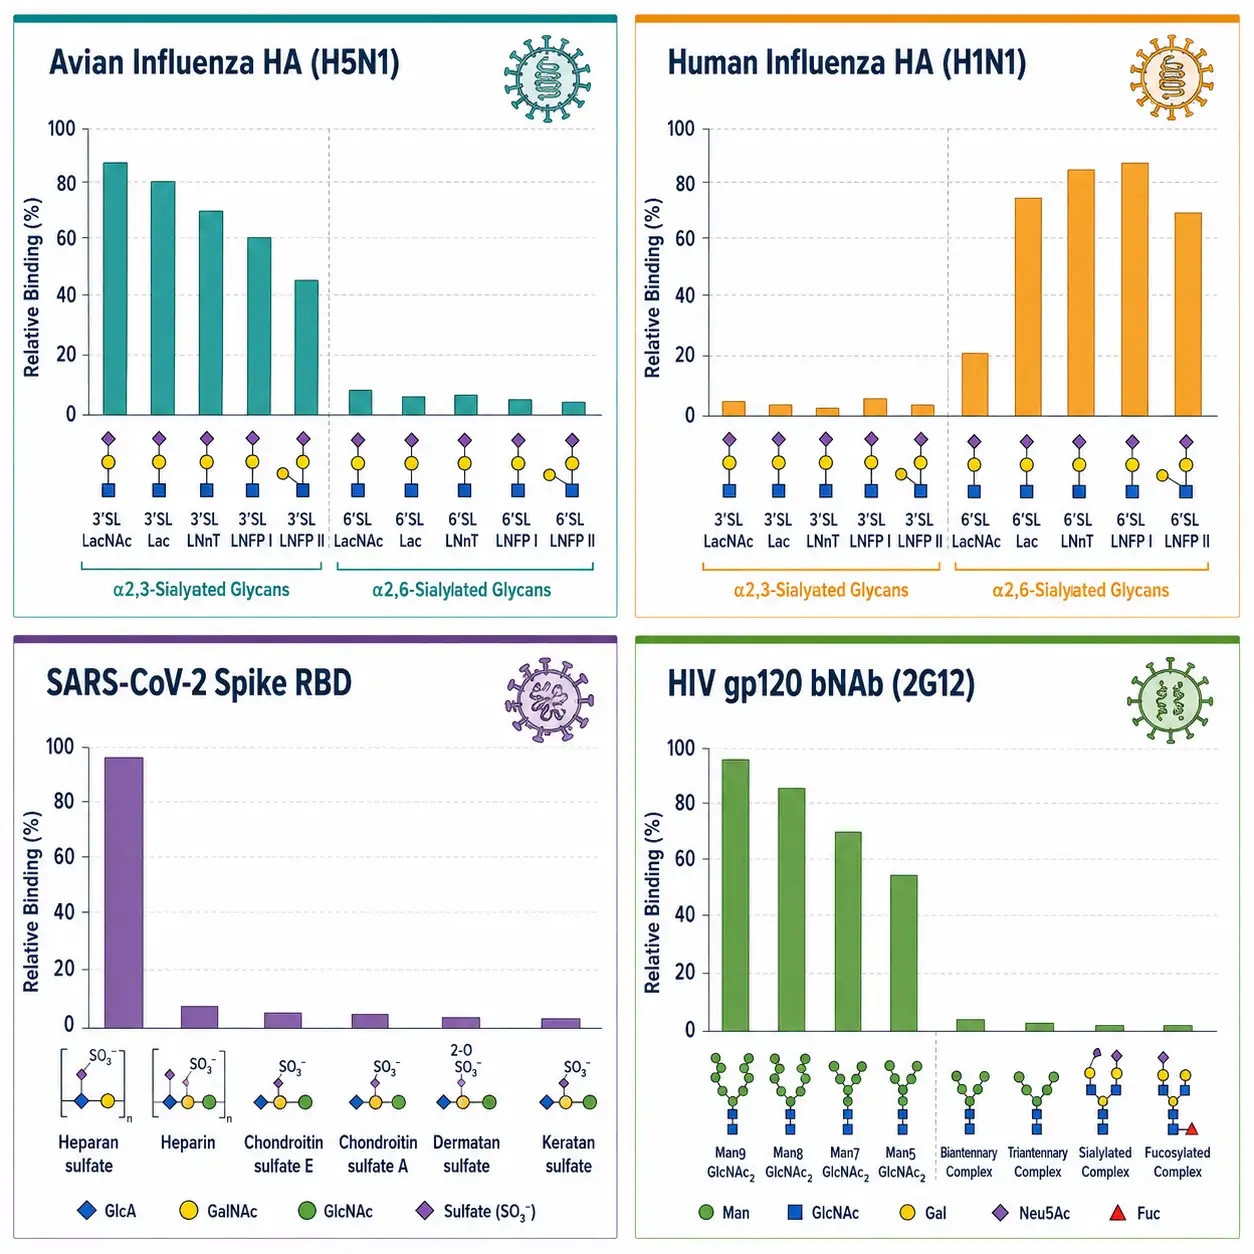 Figure 4: Viral binding specificity fingerprints — multi-panel figure with 4 representative bar chart binding profiles for different viral strains: avian influenza HA (α2,3-SA preference), human influenza HA (α2,6-SA preference), SARS-CoV-2 RBD (heparan sulfate binding), HIV gp120 bNAb (high-mannose epitope).
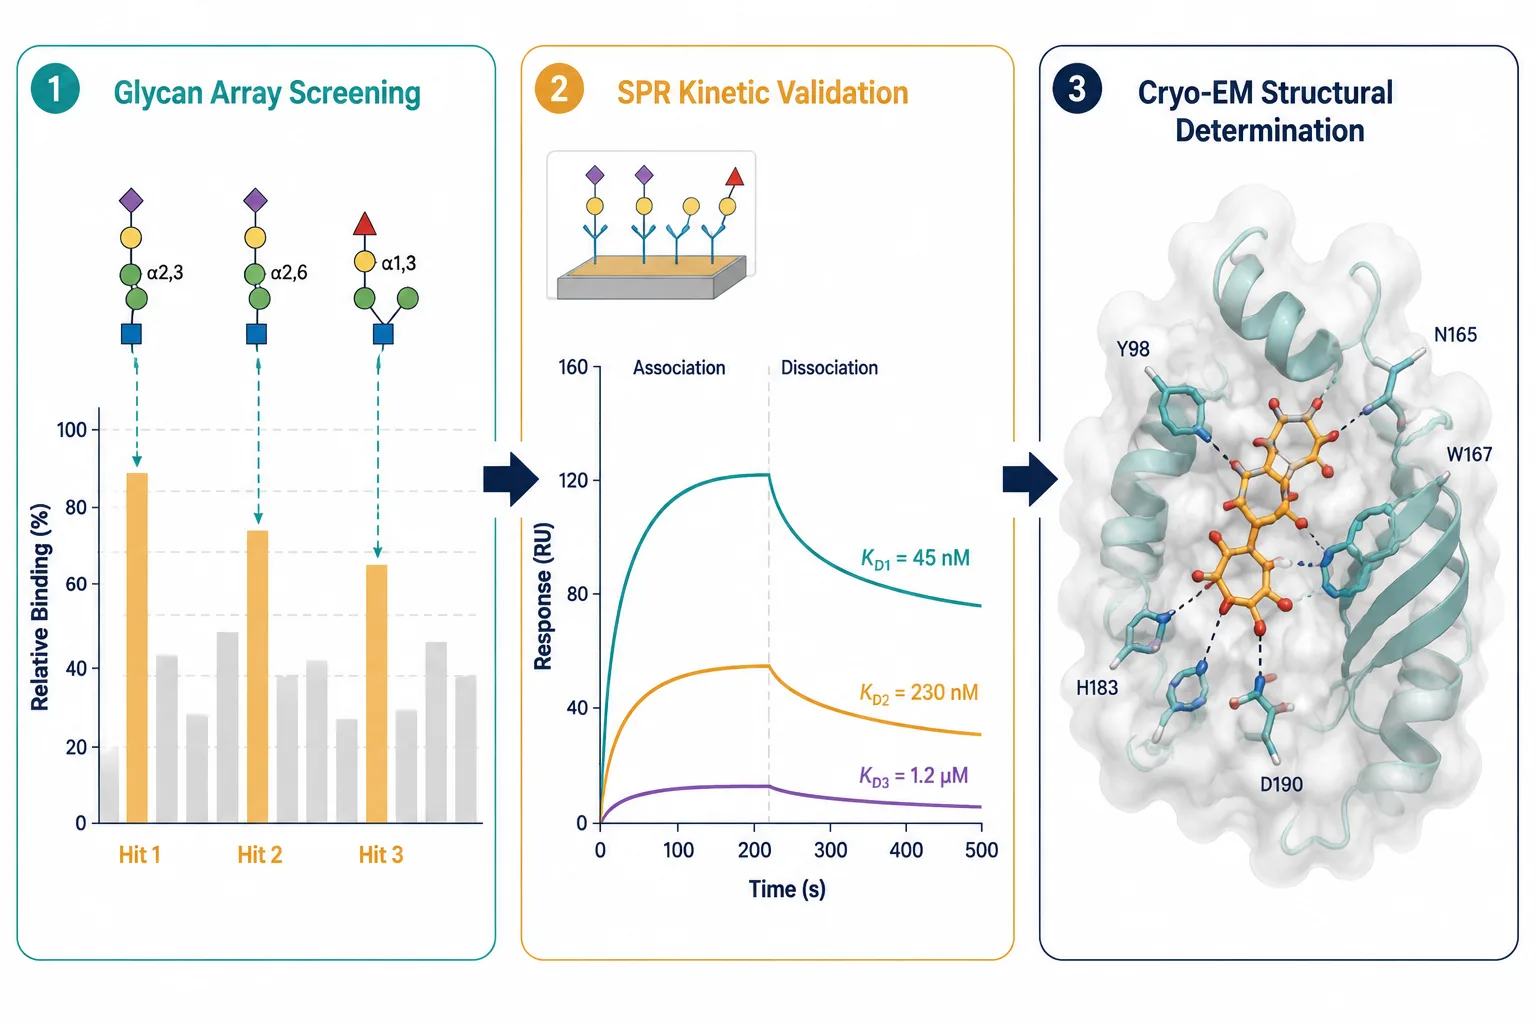 Figure 5: Array hit-to-structure validation cascade — 3-stage horizontal flow: (left) glycan array bar chart with 3 highlighted hits, (center) SPR sensorgram showing binding curves for the 3 hits with KD values, (right) cryo-EM density map with fitted glycan-protein complex structure showing atomic-level interaction details.
For researchers investigating the broader glycoproteomics context of host-pathogen interactions, see our guide on glycoproteomics by LC-MS/MS for site-specific glycosylation analysis. For structural characterization of pathogen-associated polysaccharides, see our article on polysaccharide structural analysis. For N-glycan and O-glycan profiling workflows relevant to viral glycoprotein characterization, see our guide on O-glycan and N-glycan profiling for glycoprotein research.
FAQ
What is a glycan microarray?
A glycan microarray is a high-throughput screening platform that presents hundreds to thousands of structurally defined glycans immobilized on a solid surface (glass slide) or on spectrally encoded beads, allowing a single experiment to measure binding of a protein, virus, bacterium, or antibody against an entire glycan library simultaneously.
How does a glycan microarray differ from a lectin microarray?
A glycan microarray presents defined glycan structures and asks "which glycans does my protein/pathogen bind?" A lectin microarray presents defined lectins (glycan-binding proteins) and asks "which lectins bind the glycans present in my sample?" They are complementary: glycan arrays probe pathogen protein specificity; lectin arrays profile the glycome of a biological sample.
What types of glycans can be printed on a glycan microarray?
N-glycans, O-glycans, glycosphingolipids, gangliosides, glycosaminoglycans (heparan sulfate, chondroitin sulfate), blood group antigens, milk oligosaccharides, microbial polysaccharides, and synthetic glycans designed to probe specific structural features. Most commercial arrays cover mammalian glycan libraries of 100-600 structures; custom glycan addition is available for specialized pathogen studies.
What is the minimum amount of protein needed for a glycan microarray experiment?
Typically 5-50 µg of purified recombinant protein per array. For fluorescently labeled analyte, the detection limit can be as low as 1 µg/mL. Whole inactivated virus requires approximately 10^8-10^9 particles per array. The exact requirement depends on the binding affinity — high-affinity interactions (KD < 100 nM) require less material than weak interactions (KD > 10 µM).
Can live pathogens be used on glycan microarrays?
For biosafety reasons, live BSL-2 or BSL-3 pathogens are generally not compatible with open-format printed arrays. Recombinant proteins, virus-like particles, and chemically inactivated whole virus are the standard analytes. Bead-based (MGM) arrays in a sealed 96-well plate format offer better containment but still require institutional biosafety approval for live pathogen use.
How are glycan array hits validated?
Array positives are validated by an orthogonal biophysical method, most commonly surface plasmon resonance (SPR) or biolayer interferometry (BLI), which provides quantitative KD, ka, and kd values. For structural studies, the validated glycan-protein complex is analyzed by cryo-EM or X-ray crystallography to resolve the atomic-level interaction. Functional validation — an ELISA, a cell-based binding assay, or an infection inhibition assay — confirms that the array-identified binding event is biologically meaningful.
What is the Liquid Glycan Array (LiGA)?
LiGA is a DNA-encoded glycan array technology published as a Nature Protocols method in 2025. Glycans are displayed on DNA-barcoded M13 bacteriophages, the entire glycan-phage library is incubated with live cells expressing glycan-binding proteins, and bound phages are recovered and quantified by NGS. LiGA operates in solution on live cells, enabling glycan-binding profiling in a physiological context without specialized array printing equipment.
Why do some array hits fail to validate by SPR?
Glycan array binding is avidity-driven — multivalent presentation of glycans on the array surface amplifies weak monovalent interactions. SPR measures true monovalent affinity. A glycan that shows strong binding on an array but fails SPR validation typically has a monovalent KD above 100 µM, meaning the interaction is too weak to be biologically significant. This is why SPR validation is an essential filter in the glycan array workflow.
References:
- Cummings RD, Smith DF. Insights Into Glycobiology and the Protein-Glycan Interactome Using Glycan Microarray Technologies. Molecular & Cellular Proteomics, 2024, 23(9):100814. doi:10.1016/j.mcpro.2024.100814.
- Reuber EE, Hickey E, Pradhan A, et al. Glycan microarray analysis of Candida-related antibodies in human and mice sera guides biomarker discovery and vaccine development. Proceedings of the National Academy of Sciences. 2025;122(39):e2505340122. doi:10.1073/pnas.2505340122.
- Sojitra M, Schmidt EN, Lima GM, et al. Measuring Carbohydrate Recognition Profile of Lectins on Live Cells Using Liquid Glycan Array (LiGA). Nature Protocols, 2025, 20:989-1019. doi:10.1038/s41596-024-01070-3.
- Yang H, Liu Y, Chen X. Deciphering Disease Through Glycan Codes: Leveraging Lectin Microarrays for Clinical Insights. Acta Biochimica et Biophysica Sinica, 2024, 56(8):1145-1155. doi:10.3724/abbs.2024123.
- Fenno KF, Ajayi AO, Wilson IBH. Infection and the Glycome—New Insights into Host Response. ACS Infectious Diseases, 2024, 10(8):2691-2706. doi:10.1021/acsinfecdis.4c00315.
- Bhargava D, Chowdhury A, Dube DH. Chemical tools to study and modulate glycan-mediated host-bacteria interactions. Current Opinion in Chemical Biology. 2025;87:102603. doi:10.1016/j.cbpa.2025.102603.














