

Introduction
O-glycan and N-glycan profiling represents two complementary yet analytically distinct branches of glycoprotein characterization. From biopharmaceutical lot-release testing to mucin cancer biomarker discovery, the ability to quantitatively profile both glycan classes—their structures, relative abundances, and site-specific distributions—is a core capability in modern glycomics. This article provides a practical, method-focused guide to the complete N- and O-glycan analytical workflow, with emphasis on release strategy selection, platform-specific trade-offs, mucin-focused optimization, and the data analysis practices that distinguish rigorous profiling from artifact-prone measurement.
N-Glycan vs O-Glycan Structural and Biosynthetic Differences
Protein glycosylation is not one modification but two fundamentally distinct classes that differ in biosynthesis, structure, and analytical requirements. Understanding these differences is the prerequisite for selecting appropriate profiling strategies.
N-glycans are preassembled as a 14-sugar Glc₃Man₉GlcNAc₂ dolichol-linked precursor in the endoplasmic reticulum, transferred en bloc to the asparagine side chain within the consensus sequon Asn-X-Ser/Thr (X ≠ Pro), then trimmed and elaborated in the Golgi. All N-glycans share a common Man₃GlcNAc₂ pentasaccharide core, from which three principal classes diverge: high-mannose, hybrid, and complex types. This shared core means that a single enzyme—PNGase F—releases nearly all mammalian N-glycans intact, a uniformity that has made N-glycan profiling analytically more mature than its O-linked counterpart.
O-glycans, by contrast, are built incrementally: a single GalNAc is transferred to serine or threonine by a family of 20 ppGalNAc transferases, then sequentially extended by glycosyltransferases in the Golgi. There is no known consensus sequence, no single core structure, and—critically—no universal O-glycanase. The most common mucin-type core structures (cores 1–4) are all built on GalNAc-α-Ser/Thr, but the diversity of extension (linear vs branched, sialylated, fucosylated, sulfated) produces vastly greater structural heterogeneity than N-glycans, making comprehensive O-glycan profiling a fundamentally more challenging analytical problem. Moreover, O-glycans can be densely clustered in mucin domains where every second or third residue is glycosylated, creating steric and solubility challenges for analytical workflows.
| Feature | N-Glycans | O-Glycans |
|---|---|---|
| Biosynthesis | En bloc transfer of dolichol-linked Glc₃Man₉GlcNAc₂ precursor | Sequential addition of GalNAc then stepwise extension |
| Consensus sequence | Asn-X-Ser/Thr (X ≠ Pro) | None |
| Core structure | Man₃GlcNAc₂ pentasaccharide (3 classes: high-mannose, hybrid, complex) | GalNAc-α-Ser/Thr (cores 1–4) with greater structural diversity |
| Universal release enzyme | PNGase F | None (chemical β-elimination required) |
| Typical density | 1–5 sites per glycoprotein | Up to every 2nd–3rd residue in mucin domains |
These differences cascade into every subsequent analytical decision: release chemistry, derivatization strategy, separation platform, and data interpretation must account for the fundamentally different properties of N- and O-glycans.
Figure 1: N-glycan vs O-glycan structural comparison — core structures, linkage types, and biosynthetic pathway divergence
 N-glycan vs O-glycan structural comparison — core structures, linkage types, and biosynthetic pathway divergence
Sample Preparation for Glycan Release
Regardless of the downstream analytical platform, sample quality determines data quality. For purified glycoproteins, the minimum requirement is buffer exchange into a volatile, MS-compatible solvent (50–100 mM ammonium bicarbonate, pH 7.8–8.0) with removal of detergents, salts, and stabilizing agents that interfere with enzymatic or chemical release. For complex biological samples—cell lysates, tissue homogenates, serum, or secreted mucins—additional pre-fractionation steps are essential.
Reduction and alkylation (5–10 mM DTT, 30 min at 56°C; followed by 15–20 mM iodoacetamide, 30 min in the dark) denature the protein and block free cysteines, improving both PNGase F accessibility and subsequent glycopeptide resolution. Detergent removal is particularly critical for SDS-containing samples: SDS at concentrations above 0.1% irreversibly inactivates PNGase F, and even trace SDS can suppress ionization in MALDI and ESI sources. For membrane-associated glycoproteins, Rapigest (acid-labile surfactant) or methanol-chloroform precipitation are preferred alternatives.
Mucin-Specific Considerations
Mucins—both secreted gel-forming mucins (MUC2, MUC5AC, MUC5B, MUC6) and membrane-tethered mucins (MUC1, MUC4, MUC16)—present unique sample preparation challenges. Their extensive O-glycosylation (up to 80% of molecular mass in carbohydrate) renders them resistant to standard proteolytic digestion and prone to aggregation. Three adaptations improve mucin glycan release: (1) reductive β-elimination directly on the intact mucin without prior tryptic digestion, avoiding the solubility problems of heavily glycosylated peptides; (2) pre-treatment with hyaluronidase or chondroitinase ABC when samples co-purify with glycosaminoglycans; (3) limited proteolysis with non-specific proteases (Proteinase K or pronase) under denaturing conditions (6 M urea, 2 h at 55°C) to generate O-glycopeptides with short peptide stubs that improve β-elimination efficiency.
For clinical mucin samples—sputum, bronchoalveolar lavage fluid, or colonic mucus—a critical quality consideration is mucin polymer integrity. Disulfide bond reduction (10–50 mM DTT, 1 h at 37°C) disaggregates the multimeric mucin network without cleaving glycosidic bonds, dramatically improving both release yield and glycan recovery from these challenging matrices. For researchers studying mucin-type O-glycosylation in host-pathogen or disease contexts, optimized sample preparation is the single most important determinant of data quality.
Glycan Release Strategies
Enzymatic N-Glycan Release: PNGase F and Endo H
PNGase F (Peptide-N-Glycosidase F, from Elizabethkingia miricola) is the universal reagent for releasing intact N-glycans. It cleaves the amide bond between the innermost GlcNAc and the asparagine residue, converting Asn to Asp and leaving the glycan with a free reducing terminus—the form required for reductive amination labeling. Standard protocols use 1–5 U of enzyme per 50–100 μg glycoprotein in 50 mM ammonium bicarbonate, 37°C, overnight (12–18 h), and are routinely applied in N-glycosylation site occupation analysis where complete release is essential for accurate occupancy determination. Rapid PNGase F variants with enhanced thermostability complete digestion in 10–30 minutes at 50°C and are preferred for high-throughput workflows.
PNGase F has a known limitation: it cannot cleave N-glycans with α1-3-linked core fucose, a modification common in plant, insect, and some parasitic glycoproteins. For these substrates, PNGase A (from almonds, requiring prior peptide digestion) or Endo F₃ are alternatives. Endo H (Endoglycosidase H) cleaves between the two core GlcNAc residues but only recognizes high-mannose and hybrid-type N-glycans—it does not cleave complex-type N-glycans. Endo H is therefore used diagnostically to assess N-glycan processing status (Endo H sensitivity = immature ER/cis-Golgi form) rather than for comprehensive profiling.
Chemical O-Glycan Release: β-Elimination
O-glycans are released from Ser/Thr residues by alkaline β-elimination, typically using 0.05–0.1 M NaOH with 0.5–1.0 M NaBH₄ at 45–50°C for 16–18 h. The borohydride serves a dual function: it drives the elimination reaction and simultaneously reduces the released glycan to the alditol, preventing alkaline degradation ("peeling") from the reducing terminus. The trade-off is that the resulting glycan alditol lacks a free reducing end and cannot be labeled with fluorophores via reductive amination—only permethylation or direct MS detection remains available.
Non-reductive β-elimination methods address this limitation. Ammonium hydroxide-based β-elimination (28% NH₄OH, 60°C, 6 h) releases O-glycans as glycosylamines, which can be converted to free reducing glycans by mild acid treatment. The EZGlyco O-Glycan Prep Kit uses dimethylamine with an organic superbase (1,8-diazabicyclo[5.4.0]undec-7-ene, DBU) to release O-glycans while simultaneously trapping them as stable adducts, achieving higher yields with significantly reduced peeling. These non-reductive methods preserve the free reducing end for fluorophore labeling, enabling HILIC-FLD and CE-LIF analysis of released O-glycans, and are the preferred approach for O-glycosylation site occupation analysis where site-specific information must be preserved alongside structural characterization.
One-Pot Simultaneous N- and O-Glycan Release
The most significant recent advance in glycan release technology is the development of unified workflows that profile N- and O-glycans from a single sample. The most prominent example—published by Ortega-Rodriguez and colleagues at the FDA in Cell Reports Methods (2024)—combines PNGase F digestion, Proteinase K digestion, selective N-glycan reduction, and a one-step β-elimination/during-permethylation protocol in a single reaction vessel. Critically, this method enables direct determination of N-to-O-glycan ratios from a single mass spectrum, a measurement that previously required two separate experiments with independent sample aliquots. At the 2026 ACS Spring Meeting, Wells, Azadi, and Moremen (Complex Carbohydrate Research Center) presented a further refinement: a "One-Flow" method using a unified buffer system that releases both N- and O-glycans simultaneously, completing the entire workflow within a single workday (Wells et al., 2026).
These one-pot methods address a longstanding practical problem: splitting a precious biological sample into separate aliquots for N- and O-glycan analysis doubles the required starting material and introduces inter-aliquot variability. For samples from clinical cohorts, primary cell cultures, or laser-microdissected tissue—where material is inherently limited—unified workflows represent a genuine capability advance rather than merely a convenience.
Figure 2: Glycan release method decision tree — selecting between PNGase F, Endo H, reductive vs non-reductive β-elimination, and one-pot methods based on sample type and analytical goal
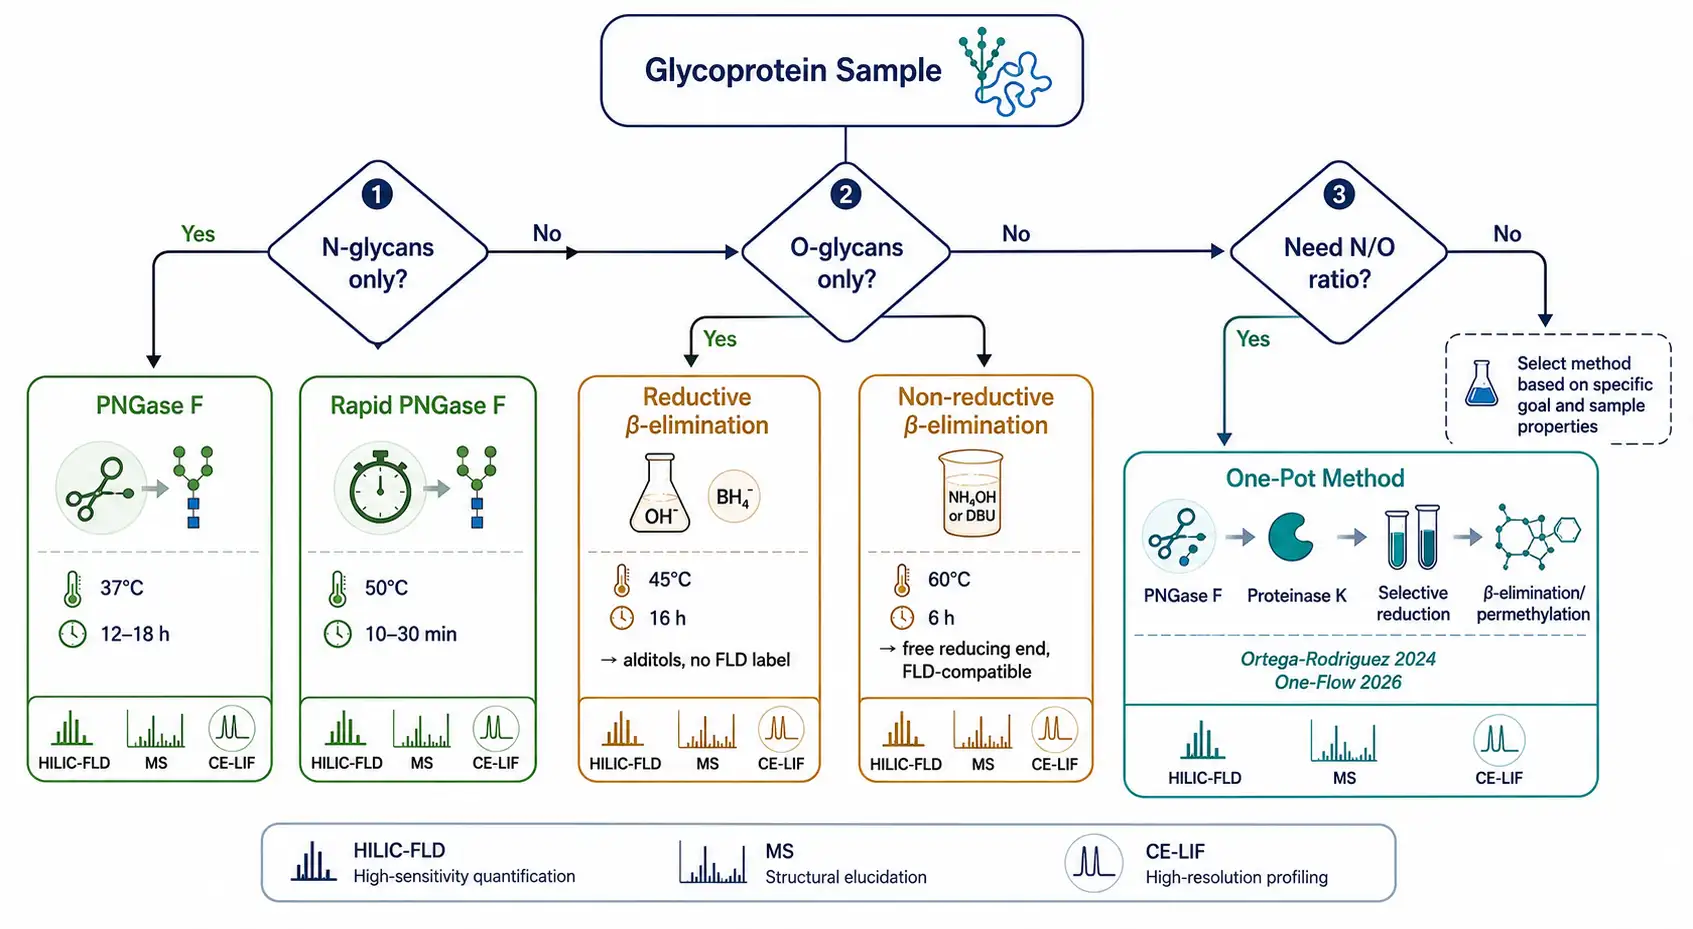 Glycan release method decision tree — selecting between PNGase F, Endo H, reductive vs non-reductive β-elimination, and one-pot methods based on sample type and analytical goal
Derivatization and Cleanup
Released glycans lack intrinsic chromophores or fluorophores and ionize poorly in their native state. Derivatization serves three simultaneous purposes: introducing a detection handle (fluorescence or UV chromophore), improving ionization efficiency (MS sensitivity), and stabilizing labile residues (sialic acid protection).
Reductive Amination Labels: 2-AB, Procainamide, RFMS
2-Aminobenzamide (2-AB) has been the workhorse label for HILIC-FLD glycan analysis for two decades. The reaction proceeds via Schiff base formation between the glycan reducing end and the aromatic amine, followed by reduction with sodium cyanoborohydride (NaBH₃CN)—typically 2–3 h at 65°C. Procainamide (ProcA) has largely superseded 2-AB for MS-compatible workflows: its tertiary amine side chain provides a permanent positive charge, dramatically improving ESI-MS sensitivity (10- to 50-fold over 2-AB in positive mode) while maintaining identical HILIC chromatographic behavior. RapiFluor-MS (RFMS) uses an amine-reactive NHS-carbamate group combined with a fluorescent quinolinone moiety; labeling completes in 5 minutes at room temperature, with 10- to 100-fold FLD and MS sensitivity gains relative to 2-AB, and it is fully compatible with HILIC-FLD and HILIC-MS platforms (Latousakis & Juge, 2025).
Permethylation
Permethylation converts all free hydroxyls (including those on sialic acid carboxyl groups) to methyl ethers, making the glycan fully hydrophobic, stabilizing sialic acids, and equalizing the ionization efficiency of neutral and acidic glycans—a critical advantage for quantitative comparisons. Permethylated glycans are analyzed exclusively by MS (MALDI-TOF or LC-MS with reverse-phase or PGC columns), not FLD. The NaOH/DMSO slurry method with methyl iodide remains the standard. The major limitation is the requirement for thorough removal of residual moisture and borate salts (from reductive β-elimination), which otherwise produce undermethylated side-products that complicate spectral interpretation.
For CE-LIF analysis, glycans are labeled with APTS (8-aminopyrene-1,3,6-trisulfonic acid) via reductive amination. APTS carries three permanent negative charges (sulfonate groups), which provide the electrophoretic mobility required for CE separation, along with strong fluorescence (excitation 455 nm, emission 512 nm).
Post-Derivatization Cleanup
Regardless of the labeling chemistry, excess label must be removed before analysis. For 2-AB/ProcA/RFMS labeling, HILIC-SPE cartridges retain labeled glycans while unreacted label elutes in the high-organic wash. For permethylated glycans, chloroform-water extraction followed by C18-SPE cleanup is standard. For APTS-labeled glycans, size-exclusion chromatography (Sephadex G-10) or gel filtration plates remove excess APTS.
Separation and Detection Platforms
HILIC-FLD with GU Value Calibration
HILIC-FLD is the most widely deployed platform for quantitative glycan profiling within a comprehensive glycomics service, particularly in biopharmaceutical quality control. Amide-bonded HILIC stationary phases separate neutral and charged glycans based on hydrophilicity—larger, more polar glycans (sialylated, highly branched) elute later. Retention times are calibrated against a dextran hydrolysate ladder and expressed as Glucose Unit (GU) values, enabling inter-laboratory comparison through the GlycoStore database. However, HILIC-FLD alone cannot resolve co-eluting isomers, nor can it definitively identify peaks without MS confirmation. Typical run times range from 30–45 minutes for comprehensive N-glycan profiles.
PGC-LC-MS for Isomer Resolution
Porous graphitized carbon (PGC) columns separate glycans through a mixed mechanism combining hydrophobic stacking on the flat carbon surface with polar retention from residual charged groups. This unique selectivity provides significantly better isomer resolution than HILIC, particularly for O-glycan core types and linkage isomers. PGC-LC is almost always coupled to MS (Orbitrap or Q-TOF) rather than FLD, as the carbon surface absorbs UV/fluorescence. The trade-off is longer equilibration times and greater sensitivity to column fouling from biological matrices.
CE-LIF for High-Throughput and Sialic Acid Resolution
Capillary electrophoresis with laser-induced fluorescence detection using APTS-labeled glycans provides the highest resolution available for charged glycan species. Separation is based on charge-to-size ratio: sialylated glycans migrate fastest toward the anode due to their additional negative charge, and even mono- vs di-sialylated isomers of the same neutral core are baseline-resolved. Run times are typically under 5 minutes per sample, and multichannel DNA-sequencer-based systems (pioneered by Callewaert's group) achieve true high-throughput operation—96 samples in approximately 4 hours. CE-LIF is particularly powerful for clinical glycan biomarker studies, where the combination of speed, resolution, and low sample consumption (sub-picomole detection limits) enables large-cohort profiling with robust glycan quantification.
MALDI-TOF MS for Rapid Screening
MALDI-TOF MS of permethylated glycans provides the fastest semi-quantitative glycan profiling workflow, with spectra acquired in seconds per spot. Permethylation normalizes ionization efficiency across neutral and sialylated species, meaning relative ion abundances approximate true molar ratios. The technique is particularly well-suited for initial glycan screening, comparison of glycan profiles across samples (e.g., wild-type vs knockout, healthy vs disease), and analysis of O-glycans from mucins where quantities are limited. The principal limitation is the inability to distinguish isomeric structures without MS/MS fragmentation.
Platform Comparison
Figure 3: Platform comparison matrix — HILIC-FLD vs PGC-LC-MS vs CE-LIF vs MALDI-TOF across resolution, throughput, quantitation accuracy, isomer resolution, and sample requirements
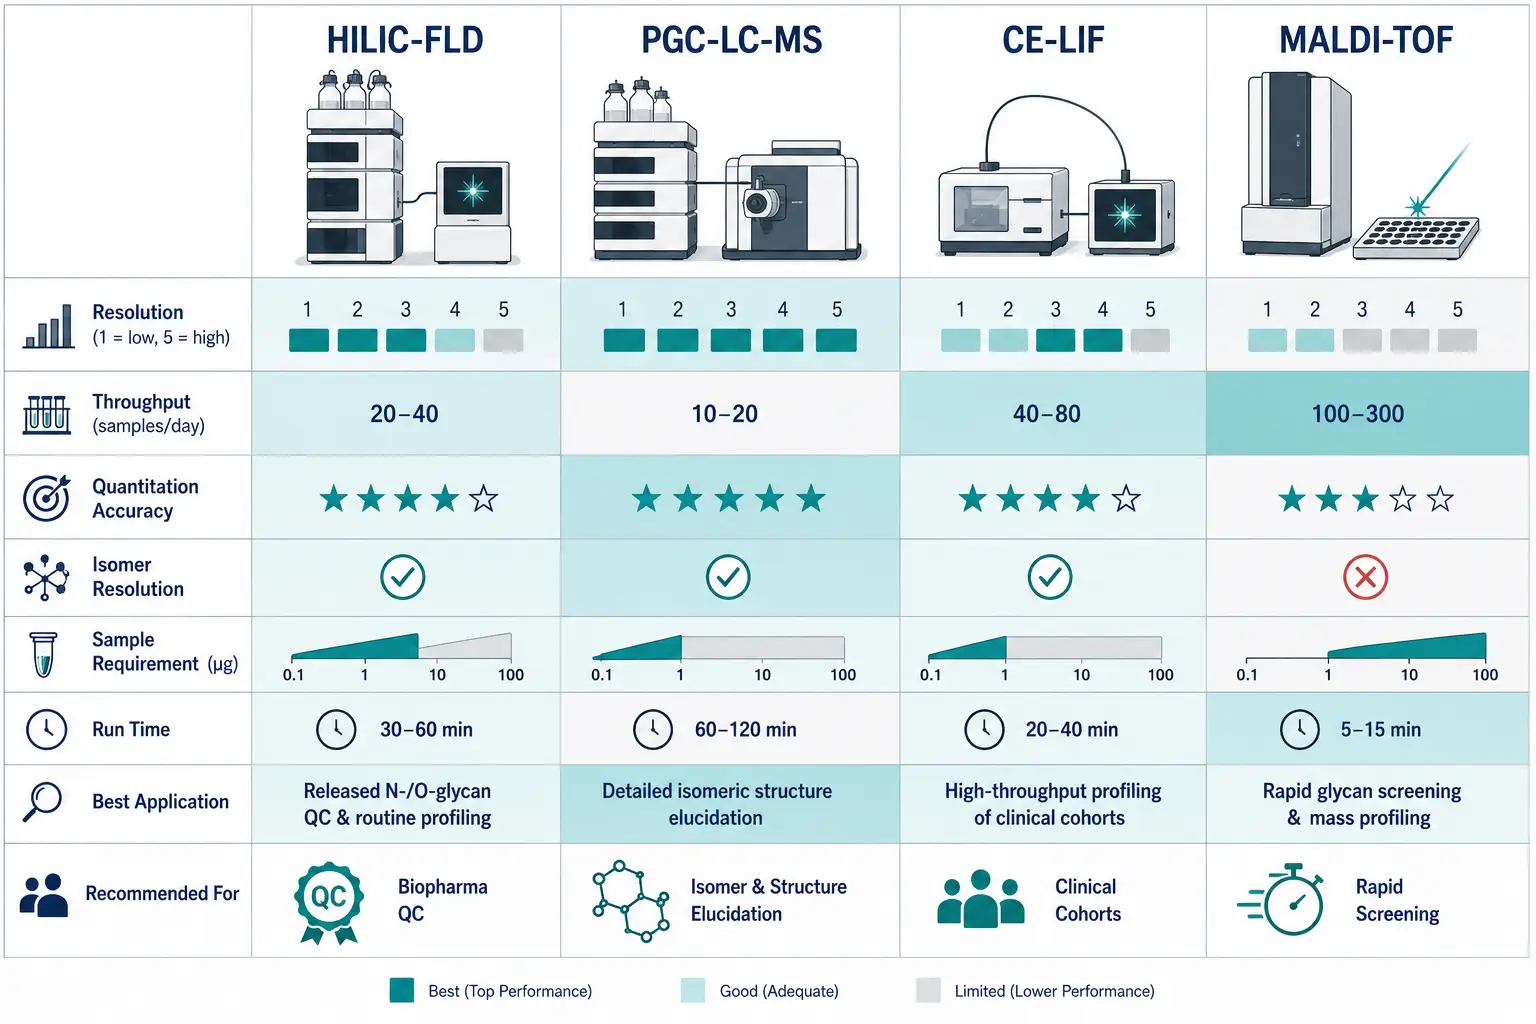 Platform comparison matrix — HILIC-FLD vs PGC-LC-MS vs CE-LIF vs MALDI-TOF across resolution, throughput, quantitation accuracy, isomer resolution, and sample requirements
The choice of separation platform should be driven by the analytical question, not platform availability. For comprehensive N-glycan quantification with structural identification, HILIC-FLD-MS with GU calibration is the reference method. For isomeric O-glycan resolution, PGC-LC-MS/MS is the platform of choice, particularly when paired with expert glycan sequencing for structural assignment of disease-associated features. For high-throughput clinical cohort studies where sialic acid linkage information is critical, CE-LIF provides unmatched speed-to-resolution ratio. For initial screening and rapid profiling of limited material, MALDI-TOF of permethylated glycans is the most practical entry point. Many laboratories now operate at least two platforms in complementary fashion—for example, CE-LIF for high-throughput quantification plus PGC-LC-MS/MS for structural characterization of disease-associated features identified in the CE-LIF screen.
Data Analysis: GU Values, Quantification, and Bias
GU Value-Based Identification
The Glucose Unit (GU) system, originally developed by Rudd and colleagues, standardizes glycan identification across laboratories and platforms and underpins routine structural characterization of glycans in both research and regulated environments. Each glycan is assigned a GU value by interpolating its retention time against a dextran hydrolysate ladder analyzed under identical chromatographic conditions. The GlycoStore database (launched 2017, expanded through 2025) now contains over 850 glycans with more than 8,500 retention entries spanning UHPLC-FLD, HPLC-FLD, PGC-LC-MS, and CE-LIF platforms. Critically, GU values are labeling-chemistry-dependent: a given glycan produces different GU values when labeled with 2-AB, ProcA, or RFMS on the same HILIC column. Laboratories transitioning between labels must recalibrate and, ideally, verify with MS.
Figure 4: Representative GU-calibrated HILIC-FLD profile of 2-AB-labeled N-glycans released from human serum IgG, with major peaks annotated by GU value and proposed structure
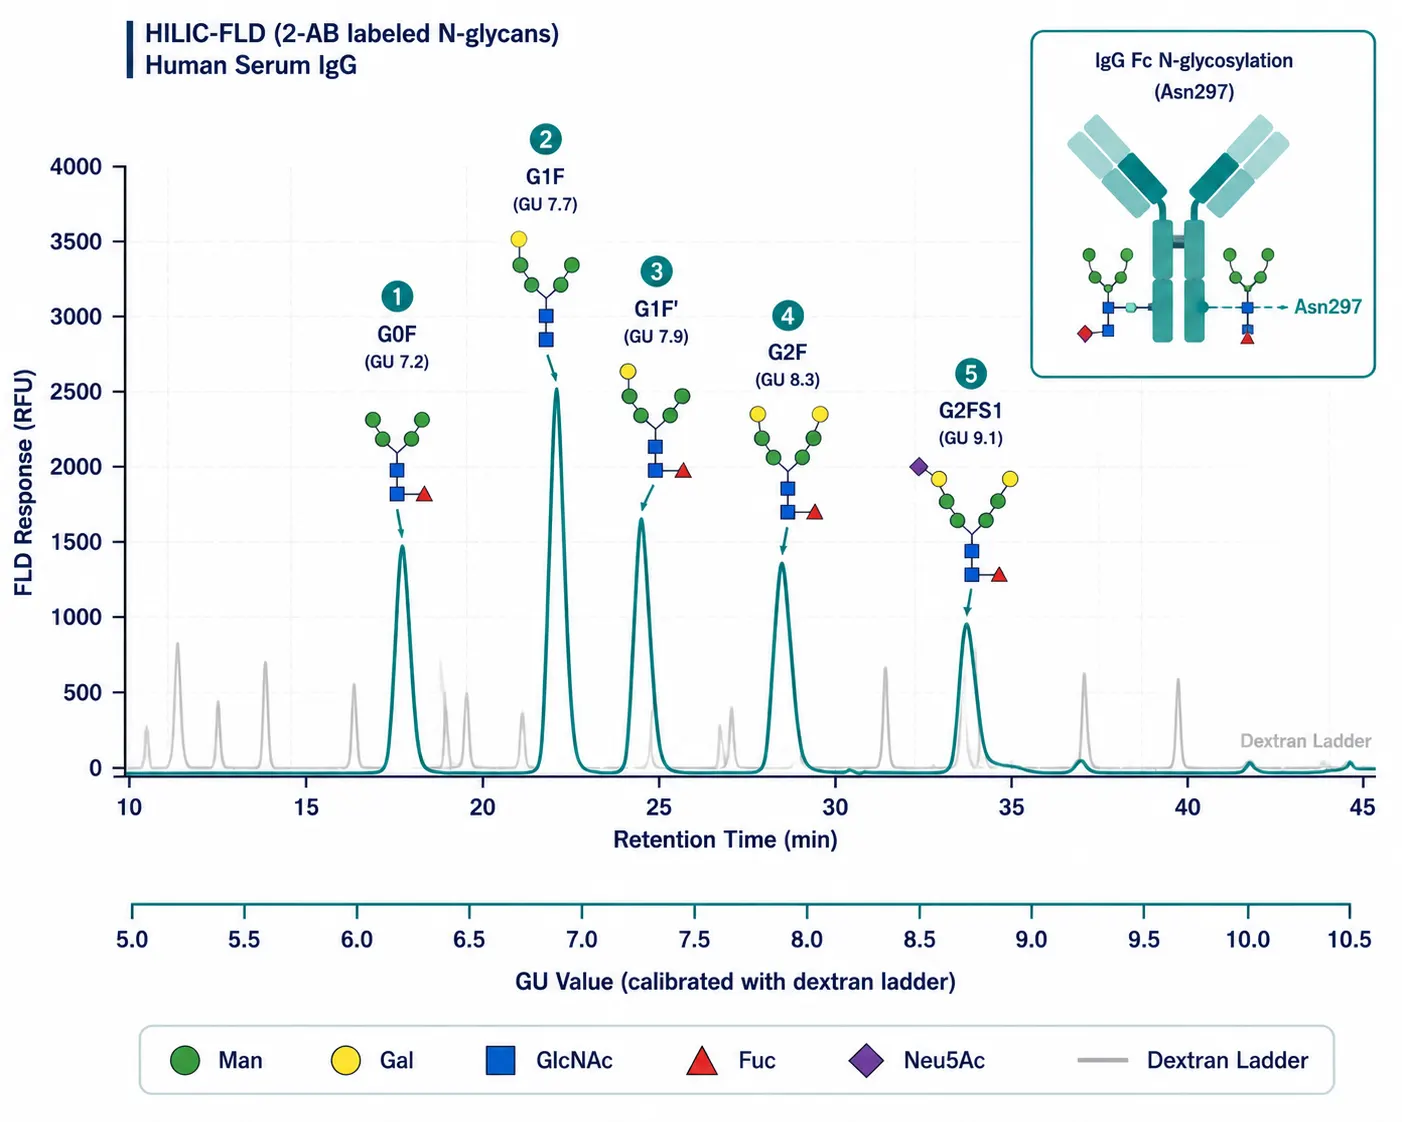 Representative GU-calibrated HILIC-FLD profile of 2-AB-labeled N-glycans released from human serum IgG, with major peaks annotated by GU value and proposed structure
Sialic Acid Quantification Bias
Sialic acid quantification deserves explicit attention because it is among the most common and consequential sources of systematic error in glycan profiling. Three mechanisms contribute: (1) In-source or in-flight sialic acid loss during MALDI-TOF analysis, which disproportionately reduces the signal of sialylated species relative to neutral glycans—permethylation eliminates this bias by converting the labile carboxyl group to a stable methyl ester. (2) Differential ionization efficiency between neutral and sialylated glycans in ESI-MS, particularly in positive ion mode where sialylated glycans ionize as sodiated adducts with variable efficiency—negative ion mode or permethylation mitigates this. (3) Incomplete release of sialylated O-glycans under standard β-elimination conditions, especially for glycans with O-acetylated sialic acids (Neu5,9Ac₂), which are resistant to alkaline conditions—milder release with carboxyl stabilization (carbodiimide coupling) or independent sialic acid analysis by DMB (1,2-diamino-4,5-methylenedioxybenzene) labeling with reverse-phase HPLC can serve as orthogonal validation.
Failure to account for sialic acid bias can produce misleading biological conclusions. A reported "decrease in sialylation" may reflect analytical artifact rather than biological regulation. The minimum standard for quantitative glycan analysis in 2025–2026 is to report sialic acid content by an orthogonal method (DMB-LC or LC-MS of released sialic acids) alongside the full glycan profile.
For broader quantitative rigor, the emerging consensus—articulated in Bennett et al. (2025, Nature Communications)—is that glycomics data are inherently compositional (relative abundances sum to a constant) and must be analyzed using centre log-ratio (CLR) or additive log-ratio (ALR) transformations rather than raw percentages, to avoid spurious "decreases" caused by genuine increases in other glycan species.
Applications in Mucin and Cancer Biomarker Research
Mucin glycosylation is profoundly altered in cancer. Truncated O-glycan structures—Tn antigen (GalNAc-α-Ser/Thr), sialyl-Tn (Neu5Ac-α2-6-GalNAc-α-Ser/Thr), and T antigen (Gal-β1-3-GalNAc-α-Ser/Thr)—accumulate on tumor-associated mucins due to disrupted Core 1 synthase (C1GalT1) activity or its chaperone Cosmc. These truncated glycans are rarely found on normal tissues and represent some of the most specific cancer biomarkers yet characterized, with validated diagnostic utility in colorectal, pancreatic, ovarian, and gastric cancers (Chen et al., 2025).
Analytically, cancer-associated mucin O-glycosylation is interrogated through complementary approaches. Profiling released O-glycans by PGC-LC-MS/MS or MALDI-TOF provides a global picture of glycan structural alterations—increased short core 1 structures, increased sialylation, altered fucosylation patterns—while site-specific glycoproteomics maps these changes to particular glycosylation sites on individual mucin protein backbones. This combined glycomics-plus-glycoproteomics strategy was recently demonstrated on clinical sputum samples from cystic fibrosis patients by Bechtella et al. (2024, Nature Communications), where trapped ion mobility spectrometry (TIMS) coupled to MS/MS achieved complete O-glycan profiling in approximately 2 minutes per sample—compared to ~1 hour for conventional PGC-LC-MS—and identified disease-associated glycosylation signatures including elevated sialylation, decreased fucosylation and sulfation, and reduced core structural diversity.
Mucin-domain glycoproteins are also increasingly recognized as targets for therapeutic intervention. The presence of cancer-specific truncated O-glycans has driven development of monoclonal antibodies (e.g., anti-Tn, anti-STn), antibody-drug conjugates, and CAR-T cells targeting these glycoepitopes. Rigorous glycan profiling throughout the therapeutic development pipeline—from target validation through manufacturing consistency—is therefore not only an analytical exercise but a regulatory requirement.
Figure 5: Comparative panel of mucin O-glycan profiles in normal vs cancer tissue — showing accumulation of truncated Tn and STn antigens, altered sialylation patterns, and reduced core diversity in tumor-associated mucins
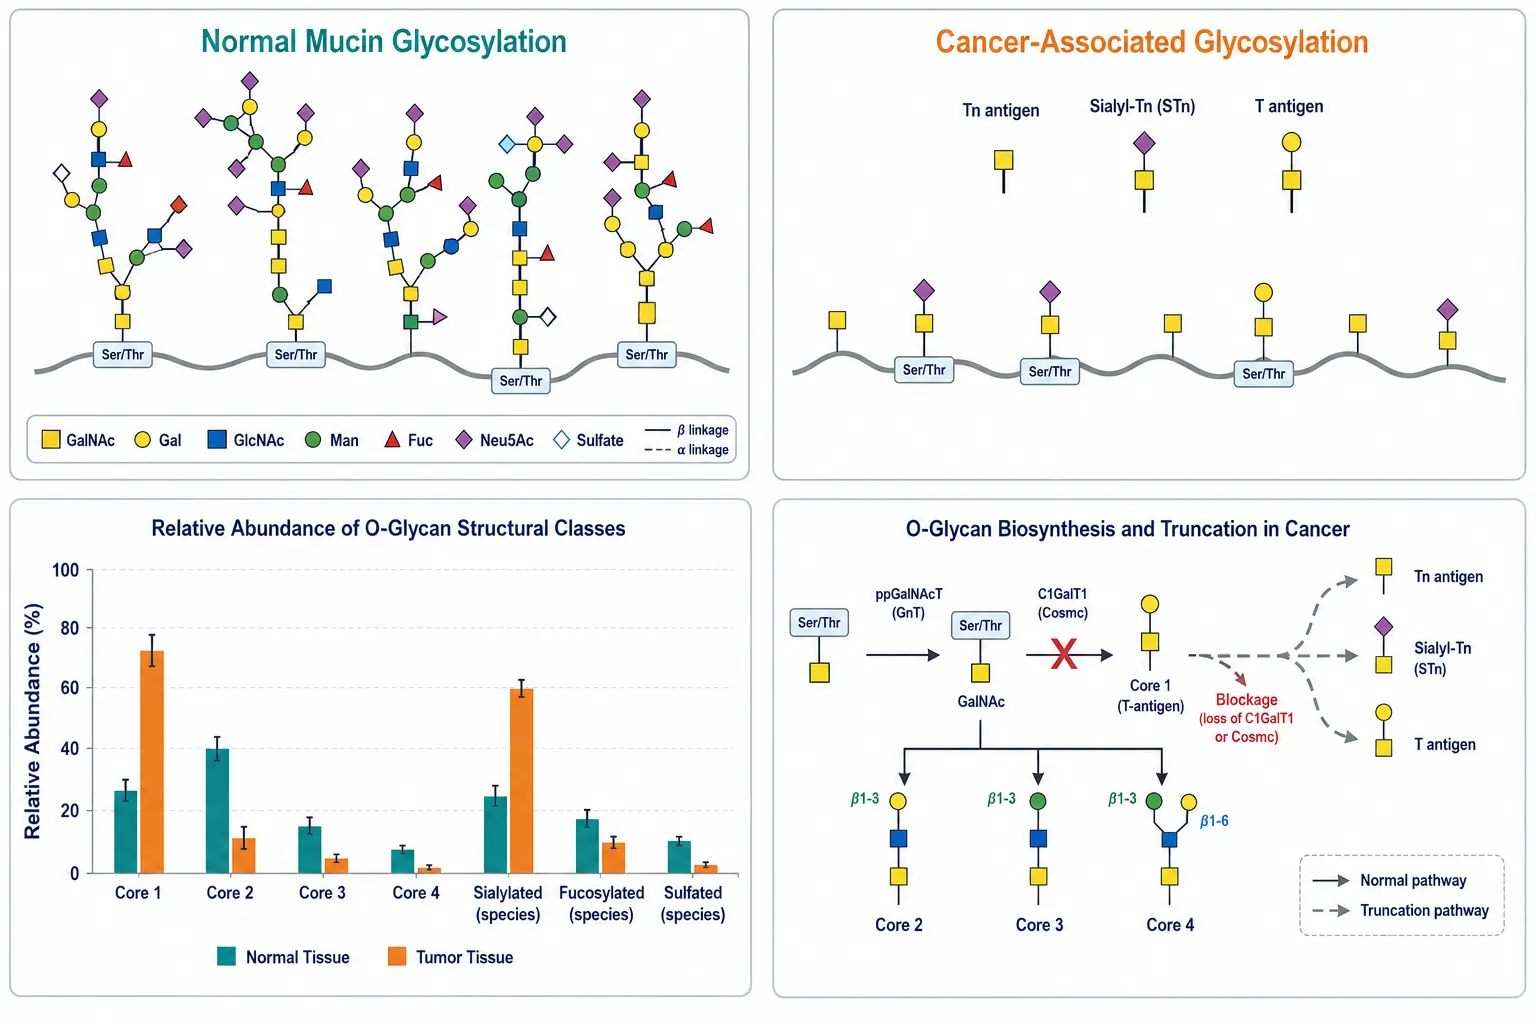 Comparative panel of mucin O-glycan profiles in normal vs cancer tissue — showing accumulation of truncated Tn and STn antigens, altered sialylation patterns, and reduced core diversity in tumor-associated mucins
Quality Control and Standardization
The 2025–2026 period marks a turning point for glycomics standardization. The MIRAGE (Minimum Information Required for A Glycomics Experiment) guidelines, originally published in 2013 and maintained by the Beilstein-Institut, received a major update in 2025 that extends their scope from free glycans to glycoproteomics experiments (Molecular & Cellular Proteomics, 2025). The updated guidelines mandate GlyTouCan glycan accession numbers and UniProt protein accession numbers for identification reporting, and recommend deposition of raw data to GlycoPOST (a ProteomeXchange satellite repository).
For routine QC of glycan profiling workflows, the following practices represent the current community standard: (1) inclusion of a system suitability standard—a well-characterized glycoprotein such as bovine fetuin or human IgG—with every analytical batch, with acceptance criteria for GU value drift and relative abundance reproducibility; (2) independent verification of sialic acid content by DMB-LC or LC-MS of released sialic acids; (3) confirmation of glycan assignments by MS/MS or an orthogonal separation platform for any peak comprising more than 5% of the total profile; (4) adoption of compositional data analysis (CLR transformation) for quantitative comparisons; and (5) deposition of raw data and processed assignments to GlycoPOST upon publication.
It is worth noting that these QC principles for glycoprotein-derived glycans complement the distinct analytical requirements of polysaccharide characterization, where linkage analysis and molecular weight determination present their own standardization challenges. Despite the availability of these glycomics standards, adoption remains uneven. A HUPO Human Glycoproteomics Initiative (HGI) community benchmarking study found that different laboratories analyzing the same glycoprotein standard with different software packages and parameter settings produced markedly divergent glycoproteomics results—a reproducibility challenge that the combined MIRAGE-GlycoPOST-GlyTouCan ecosystem aims to address.
This article is for research use only and is not intended for diagnostic or therapeutic purposes.
Frequently Asked Questions
Can one analytical method fully characterize both N- and O-glycans on a glycoprotein?
No single method comprehensively profiles both classes. The one-pot chemoenzymatic methods (Ortega-Rodriguez et al., 2024) come closest by releasing both simultaneously, but downstream separation and detection must still address the different physical properties of N- and O-glycans. In practice, HILIC-FLD-MS provides the most complete picture for N-glycans, while PGC-LC-MS/MS or MALDI-TOF of permethylated glycans is necessary for O-glycan structural detail.
Why is PNGase F insufficient for O-glycan analysis?
PNGase F is exquisitely specific for the GlcNAc-β-Asn linkage found exclusively in N-glycans. O-glycans are attached via GalNAc-α-Ser/Thr—a chemically and stereochemically different linkage—and no universal O-glycanase exists. Engineered bacterial POGases show broader specificity but remain research tools, not routine analytical reagents.
What is the minimum amount of purified glycoprotein needed for combined N- and O-glycan profiling?
For a standard workflow with separate N-glycan (PNGase F + 2-AB labeling + HILIC-FLD-MS) and O-glycan (reductive β-elimination + permethylation + MALDI-TOF) analysis, 50–100 μg per analysis is typical. One-pot methods reduce the total to 25–50 μg since the sample is not split.
How do I choose between reductive and non-reductive β-elimination?
If O-glycans will be analyzed by MALDI-TOF after permethylation, reductive β-elimination is acceptable since permethylation does not require a free reducing end. If HILIC-FLD or CE-LIF is planned, non-reductive β-elimination is mandatory to preserve the reducing terminus for fluorophore labeling.
Why do GU values differ between 2-AB and ProcA labeling?
The ProcA label contains a hydrophobic tertiary amine group that slightly alters HILIC retention compared to the more polar 2-AB label. Both use the same dextran ladder calibration principle, but a given glycan structure will have different absolute GU values with each label. Laboratories switching labels must re-establish their GU library.
Are sialylated O-glycans quantitatively recovered by standard β-elimination?
Not always. O-Acetylated sialic acids (common in mucins from the colon and respiratory tract) are base-labile and may be partially de-O-acetylated or lost during standard alkaline β-elimination. For samples where O-acetylated sialic acids are suspected, mild release conditions with carboxyl stabilization (carbodiimide) or independent DMB-LC analysis of sialic acids should be included.
What is the typical turnaround time for a complete N- and O-glycan profiling study?
For a purified glycoprotein: 3–5 working days for separate workflows (PNGase F, β-elimination, labeling, cleanup, HILIC-FLD-MS + MALDI-TOF, data analysis). One-pot methods reduce this to 2–3 days. Clinical cohort studies with hundreds of samples benefit substantially from CE-LIF platforms, which process 96 samples per 4-hour run.
How should glycan profiling data be reported for publication?
Follow the 2025 MIRAGE guidelines: report GU values (if HILIC-FLD), provide GlyTouCan accession numbers for each assigned structure, deposit raw data to GlycoPOST, and—for quantitative comparisons—use compositional data analysis methods (CLR transformation) rather than raw relative abundances. Independent sialic acid quantification by an orthogonal method is strongly recommended.
References:
- Ortega-Rodriguez U, Bettinger JQ, Zou G, Shen RF, Agarabi C, Ju T. A chemoenzymatic method for simultaneous profiling N- and O-glycans on glycoproteins using one-pot format. Cell Reports Methods. 2024;4(8):100834. doi: 10.1016/j.crmeth.2024.100834
- Bechtella L, Jin C, Kirschner S, et al. Ion mobility-tandem mass spectrometry of mucin-type O-glycans. Nature Communications. 2024;15:2624. doi: 10.1038/s41467-024-46825-4
- Chen C, Patel A, Demirkhanyan L, Gondi CS. The role of mucins in cancer and cancer progression: a comprehensive review. Current Issues in Molecular Biology. 2025;47(6):406. doi: 10.3390/cimb47060406
- Bennett AR, Lundstrøm J, Chatterjee S, Thaysen-Andersen M, Bojar D. Compositional data analysis enables statistical rigor in comparative glycomics. Nature Communications. 2025;16:795. doi: 10.1038/s41467-025-56249-3
- Latousakis D, Juge N. Profiling of permethylated mucin O-glycans using MALDI-TOF mass spectrometry. Journal of Visualized Experiments. 2025;(211):e67751. doi: 10.3791/67751














