

The choice between single-stage liquid chromatography-mass spectrometry (LC-MS) and tandem mass spectrometry (LC-MS/MS) is not purely a matter of instrument capability — it is a decision about what information a given analytical question requires. LC-MS provides accurate mass measurement and isotopic pattern information from the full mass spectrum. LC-MS/MS adds a fragmentation dimension: precursor isolation, activation, and product ion detection that generates structural evidence no single-stage measurement can provide. The implications of this difference extend across every domain of analytical chemistry — from targeted quantification of drugs in plasma at sub-nanogram concentrations to the identification of unknown metabolites, the mapping of post-translational modifications, and the structural characterization of isomers that cannot be distinguished by mass alone. All LC-MS/MS methods and analytical workflows described in this guide are for research use only. For further reading on this topic, see our dedicated resource on lc-ms/ms biologics quantitation.
This guide compares the two approaches at the level of physical principles and practical consequences for method design — across targeted quantification, untargeted discovery, proteomics, metabolomics, and DMPK (drug metabolism and pharmacokinetics) applications. Each section covers a specific analytical scenario, the information LC-MS alone can provide, the point at which fragmentation becomes necessary, and the instrument parameters that govern the trade-off. The focus is on translating physical principles — collision energy, duty cycle, resolution, scan speed — into practical decisions for method development and data interpretation. For additional insights into fragmentation strategy, explore our in-depth resource.
LC-MS/MS analysis services provide both targeted and untargeted workflows with optimized acquisition parameters for different compound classes and biological matrices, including method development, validation, and data interpretation.
For additional insights into principles instrumentation, explore our in-depth resource.
What Distinguishes LC-MS from LC-MS/MS at the Instrument Level
The fundamental architectural difference between LC-MS and LC-MS/MS is the addition of a second mass analysis stage with an intervening fragmentation step. In single-stage LC-MS, ions generated by the ionization source (ESI, APCI, or APPI) pass directly to a single mass analyzer — a single quadrupole, time-of-flight (TOF), or Orbitrap operated in full-scan mode. The data acquired is limited to a single m/z dimension per retention time point: accurate mass and relative abundance of all ions present in the source at that moment.
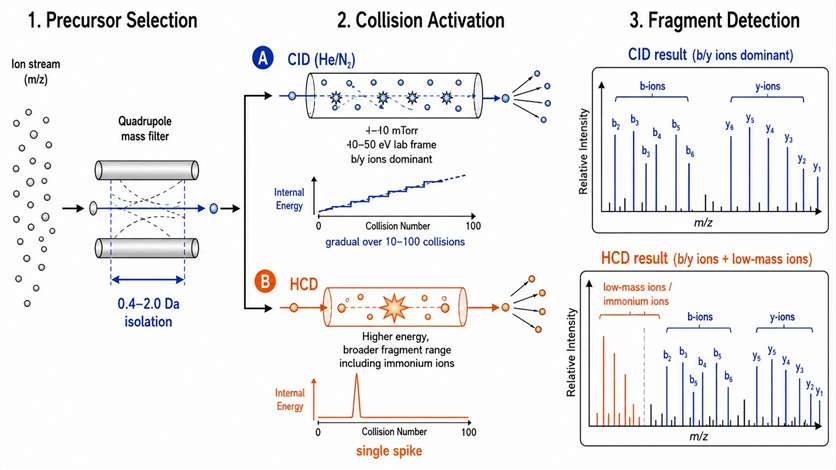
In LC-MS/MS, ions pass through three sequential stages: precursor selection in Q1 (isolating a window of 0.4-2.0 Da, depending on the quadrupole resolution setting), collision-induced fragmentation in a pressurized collision cell (using N₂ or He at pressures of 1-10 mTorr, with collision energies ranging from 5-200 eV depending on the instrument), and product ion analysis in Q3 (for triple quadrupoles), a TOF analyzer (for Q-TOF instruments), or an Orbitrap (for quadrupole-Orbitrap hybrids). This three-stage sequence — select, activate, detect — generates a product ion mass spectrum that maps the connectivity of atoms within the selected precursor molecule.
The technology evolution from single-stage to tandem MS followed a trajectory determined by analytical needs: single quadrupole (1960s-1980s) established quantitative LC-MS for simple matrices; triple quadrupole (1980s-present) added fragment-based selectivity, transforming bioanalysis; Q-TOF (1990s-present) added high-resolution accurate mass to both MS1 and MS2; and quadrupole-Orbitrap (2000s-present) pushed resolution to 240,000 FWHM, enabling accurate mass measurement even in the MS2 stage. Each step expanded the analytical questions that mass spectrometry could address. The modern mass spectrometry laboratory typically maintains both single-stage and tandem instruments because the cost structure — a single quadrupole system is approximately one-tenth the price of a high-resolution tandem instrument — means that not every application requires the full capability of a tandem high-resolution system. Laboratories processing high volumes of routine samples on single quadrupole instruments can reserve their tandem high-resolution instruments for the subset of analyses that genuinely require fragmentation and high-resolution data, optimizing both throughput and operating costs.
Figure 1: CID vs HCD collision pathways — energy regimes and resulting fragment ion series
Why LC-MS (MS1 Alone) Remains a Valuable First Pass
Single-stage LC-MS, particularly when combined with high-resolution accurate mass measurement (HRAM), remains an essential tool for several analytical scenarios. The full-scan acquisition collects data across the entire mass range without prior assumptions about which ions are present, making it the natural starting point for untargeted analysis. The data is inherently archival — a full-scan dataset can be re-interrogated years later for compounds that were not of interest during the original analysis, a feature that is not available in targeted SRM methods where only predefined transitions are acquired.
HRAM MS1 data at resolution 60,000-120,000 (FWHM at m/z 200) can assign elemental compositions to unknown features with mass accuracy within 3-5 ppm when isotopic pattern information is used. For a compound with a monoisotopic mass of 500 Da measured at 3 ppm, the mass uncertainty is only 0.0015 Da, sufficient to distinguish between elemental compositions that differ by one nitrogen atom (0.003 Da) in most cases. This is sufficient to generate putative identifications for compounds that are present in libraries, provided that the chromatographic system resolves them from co-eluting interferences.
For known compounds in simple matrices — purity assessment of synthetic products, stability monitoring of formulated drugs, or quality control of reference standards — a single mass filter is often adequate because the analytical question does not require structural evidence. The limit of detection in full-scan mode with a modern Q-TOF or Orbitrap is typically 10-100 ng/mL in plasma, limited not by the instrument's ability to detect ions at the target m/z but by the chemical noise from endogenous matrix components that produce signals at every nominal mass across the m/z range.
The limitation emerges when the sample matrix is complex. In plasma, tissue homogenate, or cell lysate samples, multiple compounds can co-elute at the same retention time with masses within 0.01 Da of each other. Under these conditions, MS1 data alone cannot distinguish the target compound from interferences, and fragmentation becomes necessary to resolve the analytical ambiguity. The transition from "LC-MS is enough" to "LC-MS/MS is required" occurs at the point where the signal-to-noise ratio at the target m/z in full-scan mode falls below 10:1 — a threshold that is reached at different absolute concentrations depending on the matrix complexity, the ionization efficiency of the target compound, and the resolution of the mass analyzer.
The Physics of Tandem MS — Why Fragmentation Is the Information Step
Tandem mass spectrometry adds structural information through controlled gas-phase fragmentation of isolated precursor ions. The mechanism of energy transfer and the resulting fragment types depend on the activation method, the energy regime, and the time scale of the experiment.
Collision-induced dissociation (CID): In quadrupole collision cells, CID uses multiple low-energy collisions with neutral gas (N₂ or He) at pressures of 1-10 mTorr. Each collision transfers a small amount of kinetic energy (0.1-1 eV per collision) to internal vibrational modes, and after 10-100 collisions, the accumulated internal energy exceeds the bond dissociation threshold (typically 2-5 eV for most covalent bonds). The energy deposition is gradual and favors cleavage of the weakest bond in the molecule. CID produces predominantly b- and y-type fragment ions for peptides (cleavage at the amide bond, producing the N-terminal b-ion and C-terminal y-ion series), and a diverse set of fragments for small molecules depending on the most labile bonds — typically loss of water (18 Da), ammonia (17 Da), or cleavage at heteroatom bonds. The collision energy is typically optimized per compound across a ramp of 10-50 eV (laboratory frame), with the optimal energy defined as the point where the precursor ion abundance drops to 10-20% of its maximum and the total fragment ion signal is maximized.
Higher-energy collisional dissociation (HCD): In HCD, ions are accelerated into a dedicated collision cell at higher kinetic energies than conventional CID, producing fewer but more energetic collisions. The energy deposition is more efficient per collision, producing a broader range of fragment types — including immonium ions (diagnostic for specific amino acid residues in peptides), side-chain losses, and internal fragment ions that CID cannot generate. HCD is particularly valuable for peptide identification in shotgun proteomics, where the additional immonium ions improve sequence coverage and confidence. It is essential for isobaric tag quantification (TMT, iTRAQ) because the low-mass reporter ions (m/z 114-131 for TMT) are only released in the HCD regime — CID does not deposit enough energy to produce fragments below approximately m/z 200 from the multiply charged precursors used in proteomics.
Practical considerations for CID vs HCD selection: For small molecule metabolites and drugs, CID produces spectra that match well with library entries from NIST and mzCloud, which are predominantly acquired on CID-capable instruments. HCD spectra of the same compounds may show different fragment distributions, requiring either spectral library conversion or re-acquisition of reference spectra. Energy-resolved mass spectrometry (ERMS) — acquiring MS2 spectra at multiple collision energies and plotting fragment ion abundance as a function of energy — provides information about the relative stability of different bonds in the molecule and can distinguish structural isomers that produce the same fragments at a single energy. For drug metabolism studies requiring identification of unknown metabolites through library matching, CID-based acquisition is preferred. For proteomics studies requiring TMT reporter ion detection or PTM localization, HCD is required regardless of the small molecule application. Protein identification services use optimized CID and HCD methods depending on the study objectives and sample characteristics.
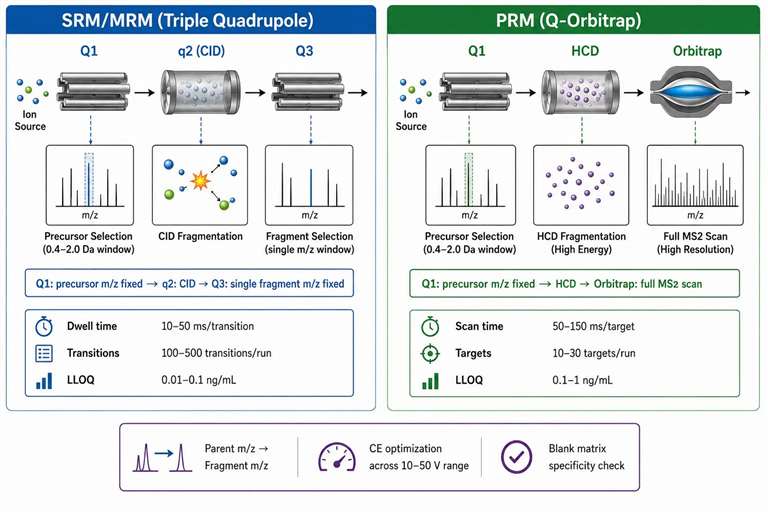
Figure 2: SRM/MRM vs PRM — targeted quantification workflows with transition design parameters
Targeted Quantification — SRM/MRM vs. PRM
For targeted quantification of known compounds, two LC-MS/MS strategies dominate: selected reaction monitoring (SRM, also called MRM) on triple quadrupole instruments, and parallel reaction monitoring (PRM) on quadrupole-Orbitrap instruments. Each has distinct strengths determined by the instrumental architecture.
SRM/MRM on triple quadrupoles: A triple quadrupole executes SRM by fixing both quadrupoles to predefined mass pairs: Q1 transmits the precursor ion m/z, and Q3 transmits a specific fragment ion m/z (a transition). The pair (parent m/z → fragment m/z) defines a detection channel that is highly specific — if an interfering compound does not produce a fragment at exactly the same m/z from a precursor at exactly the same m/z, it is not detected. The dwell time per transition is typically 10-50 ms, and with scheduled SRM (where each transition is acquired only within a retention time window of 60-120 seconds), a single method can accommodate 500-1,000 transitions per chromatographic run.
Transition design follows established rules: the most abundant fragment ion in the MS2 spectrum is selected as the quantifier transition, and 2-3 additional fragments are selected as qualifier transitions for confirmation. The ratio between quantifier and qualifier peak areas should remain constant (±20%) across all samples and standards — deviation from the expected ratio indicates an interfering compound contributing to one of the transitions. Collision energy optimization is performed at 2-5 eV increments across a 20-50 eV range, and the optimal CE follows an empirical relationship: CE = (slope × m/z) + intercept, where the slope is typically 0.03-0.06 and the intercept is 5-15, depending on the charge state and compound class.
The analytical sensitivity of SRM is unmatched in quantitative bioanalysis. LLOQs of 0.01-0.1 ng/mL in plasma are routine for compounds with good ionization efficiency, achieved by the dual mass filter's ability to reject chemical noise at both the precursor and fragment level. The signal-to-noise ratio at LLOQ is defined as ≥5:1 in regulated bioanalysis, with accuracy within 80-120% of nominal and precision (CV) ≤20%.
PRM on Q-Orbitrap instruments: PRM uses Q1 for precursor selection and the Orbitrap for full product ion scan acquisition at resolution 15,000-60,000 (FWHM at m/z 200). Instead of a single transition, all fragment ions from the selected precursor are recorded in a single high-resolution scan, providing the complete fragmentation profile. PRM offers higher selectivity than SRM because chromatographic interferences that produce the same parent→fragment pair in SRM can be resolved in PRM by the full MS2 spectrum — if the interference has a different fragmentation pattern, it is identifiable even if one fragment overlaps. The trade-off is acquisition speed: each PRM scan at 60,000 resolution requires 150-300 ms, limiting the number of targets to 10-30 per run at acceptable sampling rates (8-12 data points per peak).
For regulated quantitative bioanalysis where LLOQ requirements are most stringent (0.1-1 ng/mL in plasma), SRM on a triple quadrupole remains the standard platform. PRM is preferred when the risk of transition interference is high — for example, in complex tissue homogenates or when quantifying metabolites that share fragmentation pathways with the parent drug. PRM analysis services provide high-resolution targeted quantification for challenging matrices. SRM/MRM quantification services provide validated methods across multiple biological matrices with established LLOQ and linear range specifications.
Duty Cycle and Its Practical Consequences
The duty cycle — the total time required to complete one full cycle of MS1 + MS2 acquisition — is the constraint that governs the practical trade-offs between the number of targets, the chromatographic peak width, and the quantitative precision. The Nyquist sampling criterion requires 8-12 data points across a chromatographic peak for reliable quantification. For a 30-second peak (typical of UHPLC at 0.5 mL/min with 1.7 µm particle columns), this means each target must be sampled every 2.5-3.75 seconds.
In SRM mode, the duty cycle is determined by: (number of transitions × dwell time) + overhead (polarity switching at 20-50 ms per switch, quadrupole settling at 1-5 ms per transition) = total cycle time. Using 10 ms dwell and 50 transitions with 5 ms settling per transition, the SRM cycle time is approximately 0.75-1.0 seconds, providing 30-40 data points across a 30-second peak. Scheduled SRM reduces the effective number of concurrent transitions by acquiring each transition only within a defined retention time window, increasing multiplex capacity to 500+ transitions without exceeding the duty cycle constraint.
In PRM mode, a single target at 60,000 resolution takes 150-300 ms for the Orbitrap scan, plus 10-50 ms for Q1 isolation and HCD activation. A 10-target PRM method requires 1.5-3 seconds per cycle — barely meeting the 8-point minimum for 30-second peaks and limiting quantitative precision. At 15,000 resolution, the PRM scan time drops to 50-100 ms, enabling 20-30 targets per cycle but reducing mass accuracy and the ability to resolve isobaric interferences.
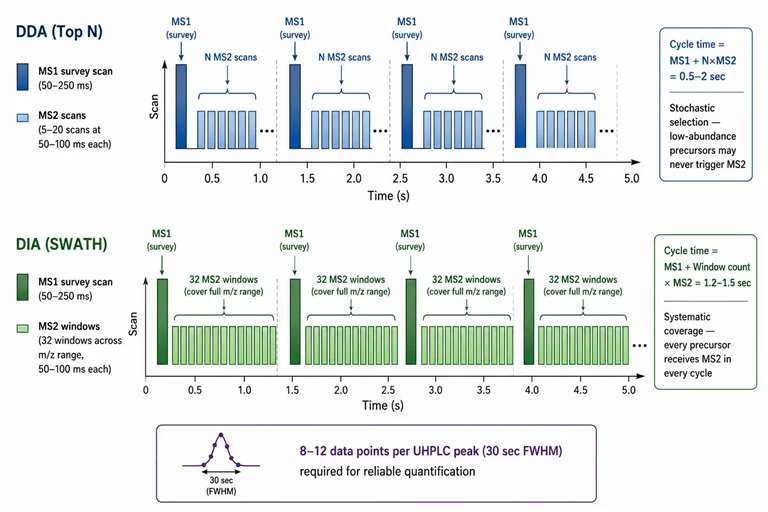
In DDA mode, each MS1 scan (50-250 ms at resolution 60,000-120,000) is followed by N MS2 scans (Top N, each 50-100 ms). The cycle time for a Top 10 DDA method on an Orbitrap is approximately 0.5-2.0 seconds, based on the MS1 resolution and the number of MS2 events triggered. In DIA mode, the cycle time depends on the number of windows and MS2 resolution. A 32-window DIA method at 15,000 resolution has a cycle time of approximately 1.2-1.5 seconds, providing complete MS2 coverage across the full m/z range.
The relationship between gradient length and peak width is a controllable variable in method design that directly affects duty cycle constraints. A 60-minute gradient on a 2.1 mm × 150 mm column at 0.3 mL/min produces peak widths of 15-30 seconds. A 10-minute gradient on the same column produces peak widths of 6-10 seconds. For fast gradients, the duty cycle must be proportionally faster to maintain the 8-12 data points per peak, which limits the number of targets in SRM mode (fewer transitions, shorter dwell times) and the number of MS2 events in DDA or DIA mode. Microflow LC (0.3-1.0 mm columns at 5-50 µL/min) produces peak widths of 60-120 seconds, relaxing the duty cycle constraint and enabling deeper MS2 coverage for discovery applications. NanoLC (75 µm columns at 200-300 nL/min) produces even wider peaks (30-60 seconds at 1/10th the flow rate), providing the longest effective duty cycle for deep proteome coverage at the cost of longer gradient times (60-180 minutes per run).
Figure 3: DDA vs DIA acquisition strategy — parallel timelines with cycle time and window annotations
DDA vs. DIA — How Acquisition Strategy Affects Data Completeness
Data-dependent acquisition (DDA) and data-independent acquisition (DIA) represent fundamentally different approaches to allocating the MS2 acquisition budget within the duty cycle constraint. The choice between them determines the completeness, reproducibility, and interpretability of the resulting dataset.
DDA (Top N): After each MS1 survey scan, the instrument selects the N most abundant precursor ions for sequential MS2 acquisition. The stochastic selection means that low-abundance ions are systematically missed — if a peptide or metabolite is not among the top N ions at the moment of the MS1 scan, it receives no MS2 fragmentation. For complex proteomics samples with 50,000+ co-eluting peptides, DDA typically identifies 5-15% of the detectable precursor features in a single run. Replicate injections improve coverage (the "dice" effect), with 3-5 technical replicates identifying 30-50% of the total features. Dynamic exclusion — a feature that temporarily adds fragmented precursors to an exclusion list for 30-60 seconds — reduces redundant MS2 events on highly abundant ions and increases the diversity of MS2 spectra acquired across the gradient.
Window-based DDA, implemented on ion mobility-enabled instruments (Bruker timsTOF), adds a gas-phase separation dimension that resolves co-eluting ions by their collision cross section (CCS) before MS2 triggering. The 4D-DDA approach (LC × retention time × CCS × m/z) increases the number of identified precursors by 30-50% compared to LC-MS/MS DDA alone because ions that co-elute chromatography are separated in the mobility dimension, each receiving its own MS2 event rather than competing for the Top N slot.
DIA (SWATH, diaPASEF, DIA-IMS): DIA uses sequential wide isolation windows (20-25 Da for SWATH, variable windows for diaPASEF based on ion density) that cycle through the full m/z range independently of precursor abundance. Each window co-fragments all precursors within the window, generating a composite MS2 spectrum that must be decoded computationally. The key advantage is that every detectable precursor receives MS2 coverage in every cycle, producing a complete data matrix with minimal missing values — making DIA the method of choice for quantitative comparison across many samples. DIA quantitative proteomics services offer standardized acquisition methods with optimized window configurations for different sample types.
A critical design parameter in DIA methods is the window width and the window overlap strategy. Narrower windows (4-10 Da) reduce the complexity of co-fragmentation, producing cleaner spectra that are easier to deconvolve, but increase the total number of windows and thus the cycle time. Wider windows (20-25 Da) increase cycle time efficiency (fewer windows) at the cost of more complex composite spectra. State-of-the-art DIA implementations use variable window widths — narrow at high ion density (where more precursors are present per Da) and wide at low ion density — to balance spectral complexity with cycle time. The diaPASEF implementation on Bruker timsTOF instruments uses the ion mobility dimension to further deconvolve co-fragmented precursors: ions with different CCS values are separated in the mobility dimension before fragmentation, producing cleaner MS2 spectra that approach DDA quality.
Library generation for DIA: DIA data interpretation requires spectral libraries for peptide-centric identification (matching the deconvolved MS2 spectra to library entries), or library-free approaches using predicted spectra from deep learning models (Prosit, DIA-NN). Project-specific libraries generated from DDA data on the same instrument platform achieve the highest identification rates, with 80-90% of DDA-identified precursors also quantifiable in DIA data. Pan-human libraries covering 100,000+ proteotypic peptides from 10,000+ proteins provide good coverage for mammalian samples without project-specific DDA runs. The quality of the spectral library — the number of peptides per protein, the fragment ion coverage per peptide, and the CCS values (for ion mobility DIA) — directly determines the identification rate in DIA data.
In the DMPK context, DDA is the standard for MetID workflows because metabolite identification requires high-quality, unmixed MS2 spectra for structural assignment — the co-fragmented spectra from DIA cannot be reliably deconvolved for unknown metabolites where no reference library exists. For targeted quantitative bioanalysis, neither DDA nor DIA is used — SRM remains the standard because it provides the highest sensitivity and selectivity for known analytes at the required LLOQ.
In-Source Fragmentation — The Artifact That Affects Both LC-MS and LC-MS/MS
In-source fragmentation (ISF) occurs when target molecules fragment in the atmospheric pressure ionization region before the first mass analyzer, rather than in the collision cell. ISF is caused by excessive heating in the ESI source (high desolvation temperature, typically >350°C), high declustering potential (DP >100 V), or high orifice voltage — all of which transfer enough internal energy to break labile bonds during the desolvation and ion transfer process. The temperature and voltage conditions that cause ISF vary by compound class: ester-containing compounds may fragment at DP >80 V, while stable aromatic compounds may require DP >150 V for detectable ISF.
The consequence for LC-MS analysis is the appearance of fragment ions at m/z values that differ from the intact precursor, adding extra features to the chromatogram that can be misinterpreted as separate compounds. For LC-MS/MS, ISF causes the instrument to select the fragment ion (not the intact precursor) for MS2, generating a fragmentation spectrum that is actually derived from a different structure than the intended target. The resulting spectrum fails library matching or produces a false identification — a critical risk in MetID workflows where the goal is to determine the structure of an unknown metabolite.
Detection of ISF requires running the same sample at multiple source conditions (varying DP across a 50-150 V range, or desolvation temperature across 200-400°C) and observing the relative abundance changes of the precursor and candidate fragment ions. A fragment whose relative intensity increases with harsher source conditions while the parent ion decreases is diagnostic of ISF — when plotted as an energy-resolved breakdown curve, the fragment appears at the expense of the parent, with the crossover point (where fragment intensity equals parent intensity) defining the ISF threshold. Establishing appropriate source conditions for each compound class is an essential QC step in LC-MS/MS method development that is often overlooked. In DMPK bioanalysis, ISF is particularly problematic for prodrugs (which are designed to be chemically labile for improved absorption) and for compounds with ester, carbamate, or N-oxide functional groups, where the labile bond can break both in the source and in the collision cell, making it difficult to determine the origin of observed fragment ions.
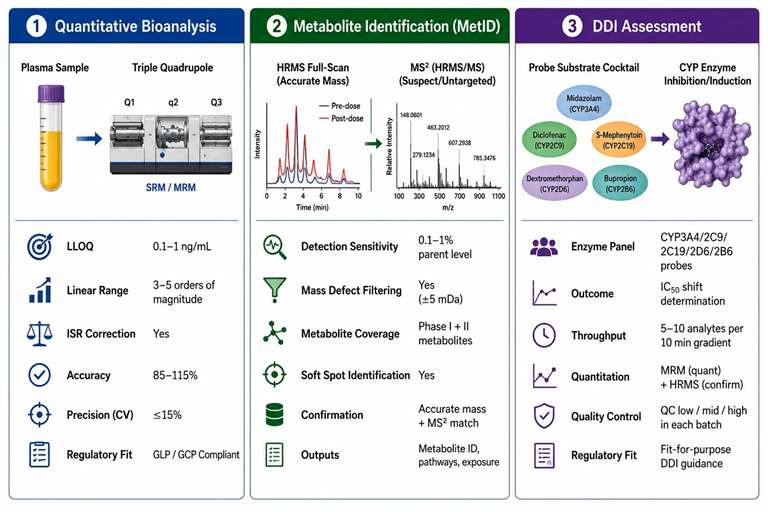
Figure 4: DMPK applications of LC-MS/MS — quantitative bioanalysis, MetID workflow, and DDI assessment matrix
How LC-MS/MS Supports DMPK Studies — Beyond Proteomics and Metabolomics
In drug metabolism and pharmacokinetics (DMPK), LC-MS/MS is the core analytical platform because the biological matrices and low concentration requirements exceed what single-stage LC-MS can provide. Three application areas illustrate the decisive advantage of tandem MS in DMPK.
Quantitative bioanalysis in biological matrices: The determination of drug and metabolite concentrations in plasma, serum, tissue homogenate, urine, and cerebrospinal fluid requires LLOQs of 0.1-1 ng/mL for most small molecule drugs, with a calibration curve spanning 3-5 orders of magnitude. Only SRM on a triple quadrupole achieves this reliably — the dual mass filter rejects endogenous matrix components that would otherwise contribute to the background signal. Matrix effects (ion suppression or enhancement from co-eluting endogenous compounds such as phospholipids, bile salts, and salts) are assessed by post-column infusion experiments and corrected using stable isotope-labeled internal standards. The calibration curve acceptance criteria follow regulatory guidelines: accuracy within 85-115% of nominal (80-120% at LLOQ), precision (CV) ≤15% (≤20% at LLOQ), with at least 6 non-zero calibration standards distributed across the concentration range.
Method validation for regulated bioanalysis covers ten parameters: selectivity (no interference at the retention time of the analyte and IS from at least 6 individual matrix lots), carryover (≤20% of LLOQ in the blank after the highest standard), linearity (coefficient of determination r² ≥0.99), accuracy and precision (within-run and between-run, at 4-5 concentration levels including LLOQ, low QC, mid QC, and high QC), matrix effect (IS-normalized matrix factor within 15% CV across lots), recovery (consistent across concentration levels, within ±15%), and stability (bench-top, freeze-thaw, autosampler, long-term at -80°C). A fully validated method can take 4-8 weeks to develop and document, while partial validation (for a matrix change or a minor method modification) requires 1-2 weeks.
Metabolite identification (MetID): In vitro and in vivo metabolite profiling requires HRMS full-scan acquisition (for detection of all drug-related components) combined with data-dependent MS2 acquisition (for structural characterization). LC-MS/MS at resolution 60,000-120,000 in both MS1 and MS2 enables detection of metabolites at 0.1-1% of parent drug level, covering Phase I (oxidation, reduction, hydrolysis) and Phase II (glucuronidation, sulfation, glutathione conjugation, methylation) metabolites. The typical MetID workflow uses a two-tier approach: initial HRMS full-scan acquisition identifies all potential metabolite peaks by comparing pre-dose and post-dose sample chromatograms using mass defect filtering (a 50 mDa window around the expected metabolite mass defect) or isotope pattern filtering. Identified peaks are then targeted for MS2 acquisition at multiple collision energies (10, 20, 40, 60 eV) to generate comprehensive fragmentation data for structural assignment.
Metabolite soft spots identified by MS2 fragmentation data — the specific atom or functional group where metabolic oxidation occurs — guide medicinal chemistry optimization. For example, MS2 data showing that oxidation occurs on an aromatic ring (detected by +16 Da shift with characteristic water loss from the fragment) versus an aliphatic side chain (detected by the fragment retaining the +16 Da) directs the synthetic chemist to block the labile site while preserving the pharmacophore. The MIST regulatory framework requires characterization of metabolites exceeding 10% of parent drug exposure, achievable only with LC-MS/MS-based MetID workflows with quantitative bioanalysis.
CYP inhibition and induction assays: Drug-drug interaction (DDI) risk assessment uses probe substrate cocktails (e.g., midazolam for CYP3A4/5, tolbutamide for CYP2C9, omeprazole for CYP2C19, dextromethorphan for CYP2D6, phenacetin for CYP1A2) incubated with human liver microsomes or hepatocytes. LC-MS/MS simultaneously quantifies each probe substrate and its specific metabolite in a single analytical run, using SRM transitions specific to each analyte. The IC₅₀ shift between vehicle control and test compound incubations determines the inhibition potential. A standard 10-point inhibition curve in duplicate requires 20 incubations, each producing a single LC-MS/MS run of 5-10 minutes. The key advantage — simultaneous quantification of 5-10 probe substrate pairs in a single injection — is achievable only with the transition-level selectivity of SRM. Single-stage LC-MS cannot resolve the co-eluting probes and their metabolites because multiple parent compounds share overlapping m/z ranges and retention time windows. LC-MS/MS services for DMPK cover the full range of bioanalytical methods for early discovery studies, from method development through full validation to sample analysis.
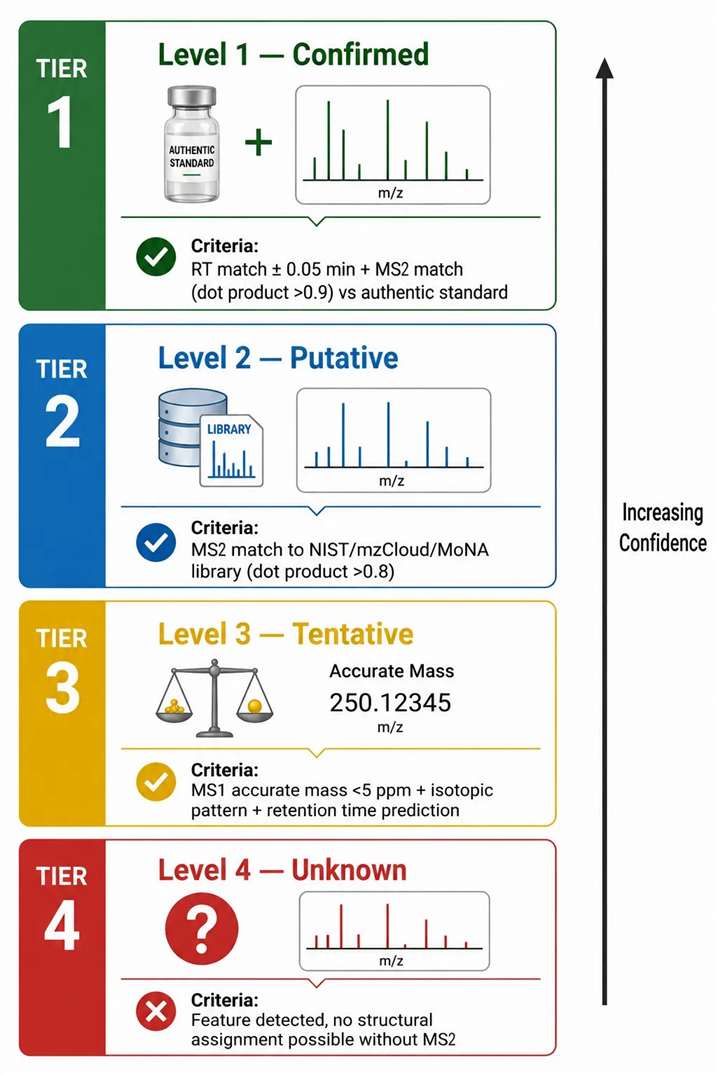
Figure 5: Metabolite identification confidence levels — MSI tiered framework with criteria for each level
LC-MS vs. LC-MS/MS in Proteomics — Why Fragmentation Became the Standard
In proteomics, LC-MS/MS is virtually universal because peptide identification depends on fragmentation evidence that single-stage MS cannot provide. The accurate mass of an intact peptide combined with retention time is insufficient to uniquely identify it — tens of thousands of theoretical peptides from a proteome digest can share similar mass (±10 ppm) and retention time (±1 minute) windows. The MS2 fragmentation spectrum, producing b- and y-ion series, provides the sequence-specific evidence that assigns the peptide to a specific protein with statistical confidence (typically 1% false discovery rate at the peptide level). Proteomics analysis services apply these principles across both discovery and targeted workflows.
Post-translational modification (PTM) localization requires even more specific fragmentation evidence. A phosphorylated peptide with +80 Da mass shift can have the phosphate group on different serine, threonine, or tyrosine residues — only the diagnostic neutral losses and fragment ion series in MS2 can localize the PTM to a specific residue. ETD (electron transfer dissociation) has become standard for PTM localization because it fragments the peptide backbone without dissociating labile modifications, producing c- and z-ion series that retain the modification. For phosphorylation analysis, the combination of CID (for sequence identification) and ETD (for PTM localization) on instruments capable of alternating activation methods provides the most complete characterization.
Isobaric labeling quantification (TMTpro 18-plex, iTRAQ 8-plex) uses LC-MS/MS to detect reporter ions released only upon HCD fragmentation. These reporter ions in the low m/z range (114-131 for TMT, 113-121 for iTRAQ) are unique to the MS2 step — MS1 alone cannot provide multiplexed quantification because labeled precursors from different samples have identical precursor masses. The TMT multiplexing capacity of up to 18 samples per run has made it the dominant quantification strategy for large-scale proteomics, with a single 18-plex experiment generating data comparable to 18 individual label-free runs while eliminating run-to-run quantification variability through simultaneous measurement. The ratio compression effect — where co-eluting precursors with similar masses are co-isolated in the MS2 window, diluting the reporter ion ratios — is a recognized limitation that requires careful method optimization (narrow isolation windows of 0.4-0.7 Da) and computational correction (collapsing co-isolated interference using a signal-to-noise threshold).
LC-MS vs. LC-MS/MS in Metabolomics — Structural Confidence Is the Hardest Currency
The Metabolomics Standards Initiative (MSI) defines four levels of metabolite identification confidence. Level 1 — confirmed identification — requires matching retention time (within 0.05 min) and MS2 spectrum (dot product >0.9) to an authentic standard analyzed under identical conditions. Level 2 — putative identification — requires MS2 spectrum matching to a spectral library (NIST, mzCloud, MoNA) with dot product >0.8. Level 3 — tentative identification — relies on MS1 accurate mass and isotopic pattern only, with assignment to a compound class. Level 4 represents an unknown feature that cannot be identified without MS2 data. The critical point is that Levels 1 and 2, which account for >90% of reliable metabolite annotations in published studies, both require LC-MS/MS data. Level 3 annotations, achievable with single-stage LC-MS alone, carry high uncertainty and are considered putative at best.
The isomer discrimination challenge illustrates why MS1 alone is insufficient for confident identification. Leucine and isoleucine (C₆H₁₃NO₂, monoisotopic mass 131.0946 Da) cannot be distinguished by accurate mass. Their MS2 spectra differ reproducibly — Leu produces an immonium ion at m/z 86.0964, while Ile produces the same nominal mass but with a different fragment at m/z 69.0699 (C₅H₉⁺) that is diagnostic for the isoleucine side chain. Without MS2, identification at the isomer level is impossible, and pathway-level interpretations based on incorrect isomer assignments propagate through the metabolic network analysis, producing unreliable biological conclusions. The same principle applies to dozens of metabolite isomer pairs routinely encountered in untargeted metabolomics — citrate/isocitrate, glucose/galactose, glutamine/glutamic acid γ-methyl ester, and glucuronide positional isomers all require MS2 fragmentation for confident discrimination. In DMPK studies, glucuronide regioisomers of drug metabolites (O-glucuronide vs N-glucuronide vs acyl glucuronide) have different biological activities and clearance rates, making their discrimination by LC-MS/MS essential for interpreting pharmacokinetic data. Targeted metabolomics services use LC-MS/MS with optimized transitions for each metabolite of interest.
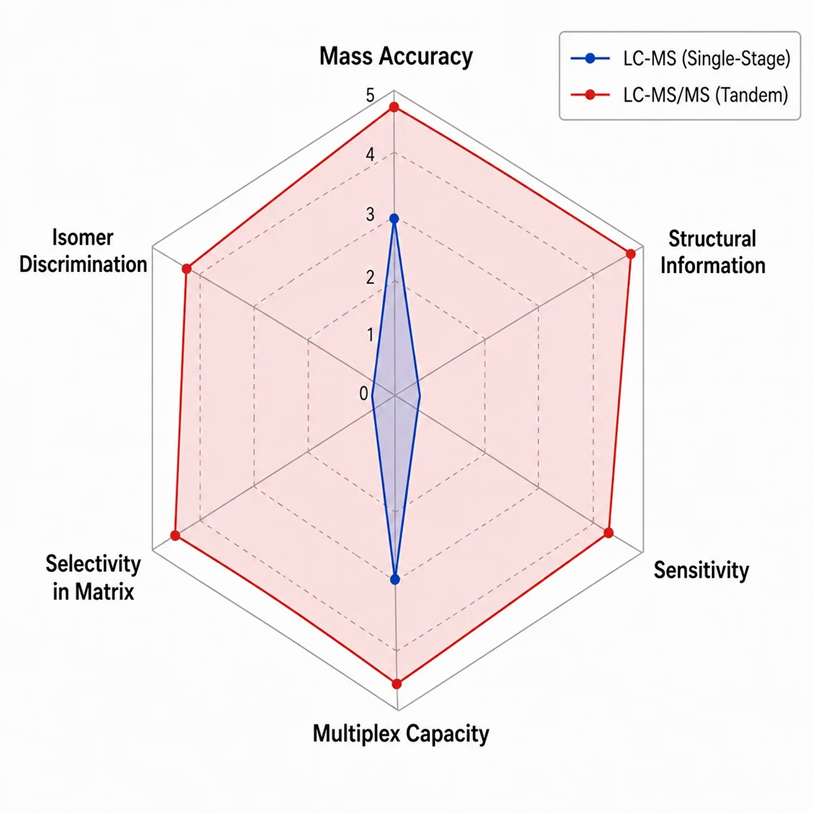
Figure 6: LC-MS vs LC-MS/MS six-parameter comparison — radar chart across analytical dimensions
Decision Framework — When Is LC-MS Enough, and When Does LC-MS/MS Become Necessary?
The decision to use single-stage or tandem mass spectrometry depends on the analytical question, not on the instrument available. The following framework maps common analytical scenarios to the minimum instrument configuration required.
LC-MS alone is sufficient when: the sample matrix is simple (pure compound, single-component formulation, buffer); the analytical goal is preliminary screening with tolerance for false positives and Level 3 identification confidence; the expected concentration is well above the LLOQ (typically >100 ng/mL) and signal-to-noise is not the limiting factor; the only information needed is accurate mass and retention time; the compounds being analyzed are known not to have isomeric interferences that require MS2 discrimination.
LC-MS/MS is necessary when: the sample matrix is complex (plasma, tissue, cell lysate) with potential for co-eluting interferences; the required LLOQ is below 1-10 ng/mL; structural confirmation of a candidate identification is needed (Level 1 or 2 identification); the analytical target includes isomeric compounds, regioisomers, or stereoisomers; the method must quantify multiple analytes simultaneously in multiplex format; the data must support regulatory submissions or clinical development decisions where data quality standards are codified.
For DMPK studies specifically, LC-MS/MS is the default platform for all quantitative bioanalysis and MetID work. A standard preclinical PK study with 8 time points, 4 dose groups, 4 animals per group generates approximately 128 samples for LC-MS/MS analysis, plus calibration standards and QC samples. The SRM method for each compound requires 2-5 days to develop and optimize, including transition selection, collision energy ramping, matrix effect assessment, and partial validation. At the discovery stage where compound numbers exceed 100 per project and structural diversity is broad, generic LC-MS/MS methods with automated optimization workflows can reduce method development to 1-2 days per compound, using software-driven transition prediction and automated CE optimization.
The cost difference between operating a single quadrupole system and a triple quadrupole or Q-Orbitrap system must also be factored into the decision. If 80% of a laboratory's analyses can be performed on a single quadrupole with adequate sensitivity and selectivity, maintaining a dedicated single quadrupole system alongside a high-end tandem system may be more cost-effective than running all analyses on the tandem system at higher per-sample cost.
Summary Parameter Comparison — LC-MS vs. LC-MS/MS
| Parameter | LC-MS (Single-Stage) | LC-MS/MS (Tandem) |
|---|---|---|
| Mass accuracy (MS1) | 3-5 ppm at 60K-120K resolution | 3-5 ppm (MS1) + MS2 matching for confirmation |
| Structural information | None — accurate mass and isotope pattern only | Fragmentation spectrum with covalent connectivity evidence |
| Sensitivity (LLOQ in plasma) | 10-100 ng/mL typical | 0.01-1 ng/mL with SRM on triple quadrupole |
| Selectivity in complex matrices | Limited by chemical noise at target m/z | High — dual mass filter eliminates most matrix background |
| Isomer discrimination | Not possible | Yes — diagnostic fragment ions distinguish isomers |
| Multiplexing capacity | Unlimited in full-scan mode (all masses) | 100-500 transitions (SRM) / 10-30 targets (PRM) |
| Quantification precision (CV) | 10-25% typical without IS correction | 3-10% at LLOQ with IS correction |
| Data archiving for retrospective analysis | Yes — full-scan data can be re-interrogated | Limited (SRM) / Yes (DIA) / Partial (DDA) |
FAQ
When would a single quadrupole LC-MS be sufficient for bioanalysis?
For quantification in simple matrices (buffer, formulation vehicle) at concentrations above 10-100 ng/mL, where no isomeric interferences exist and accurate mass confirmation is adequate without structural evidence.
What is the LLOQ difference between LC-MS and LC-MS/MS in plasma?
LC-MS typically achieves LLOQs of 10-100 ng/mL. LC-MS/MS with SRM achieves 0.01-1 ng/mL — a 10-1,000-fold improvement — because the second mass filter eliminates matrix background noise at the target m/z.
Can LC-MS/MS distinguish leucine and isoleucine?
Yes. Leu and Ile (identical mass C₆H₁₃NO₂, 131.0946 Da) produce diagnostic differences in their immonium ion and low-mass fragment patterns that enable unambiguous differentiation by LC-MS/MS.
What determines the number of targets in a multiplex SRM method?
The duty cycle constraint: 10 ms dwell per transition × number of concurrent transitions + overhead. Scheduled SRM (acquiring each transition only within its retention time window) enables 500+ transitions per run.
Is PRM more sensitive than SRM?
At LLOQ, SRM is typically more sensitive (photomultiplier detection has lower noise than Orbitrap image current). PRM provides higher selectivity (full MS2 spectrum vs single transition) and better resolves matrix interferences at higher concentrations.
How does DIA handle mixed fragmentation spectra?
DIA deconvolves mixed spectra using spectral library matching (comparing the composite spectrum to library entries), chromatographic co-elution correlation (grouping fragments with the same elution profile), or deep learning-based source separation (DIA-NN, Spectronaut).
What is the minimum data points per peak for reliable quantification?
8-12 data points across the peak FWHM are required by regulatory guidelines. Fewer than 8 points increases quantification variability due to under-sampling of the peak shape.
How does matrix effect correction differ between LC-MS and LC-MS/MS?
LC-MS relies on chromatographic separation to resolve the analyte from matrix components causing ion suppression. LC-MS/MS with SRM can partially reject matrix effects at the second mass filter, but stable isotope-labeled IS is still required for accurate correction.
References
- Lou R, et al. The hidden impact of in-source fragmentation in metabolic and chemical mass spectrometry data interpretation. Nature Metabolism. 2024;6:1018-1031.
- Development and validation of an LC-MS/MS method for simultaneous quantitation of compounds in biological matrices. Journal of Chromatography B. 2024;1245:124317.
- Bekker-Jensen DB, et al. A compact quadrupole-Orbitrap mass spectrometer with FAIMS interface. Molecular & Cellular Proteomics. 2020;19:716-729.
- Searle BC, et al. Generating high-quality libraries for DIA MS with empirically corrected peptide predictions. Nature Communications. 2020;11:1548.
- Ludwig C, et al. Data-independent acquisition-based SWATH-MS for quantitative proteomics: a tutorial. Molecular Systems Biology. 2018;14:e8126.
- Ivanisevic J, et al. From samples to insights into metabolism: A comprehensive guide to LC-MS-based metabolomics. Nature Protocols. 2024;19:2093-2120.













