

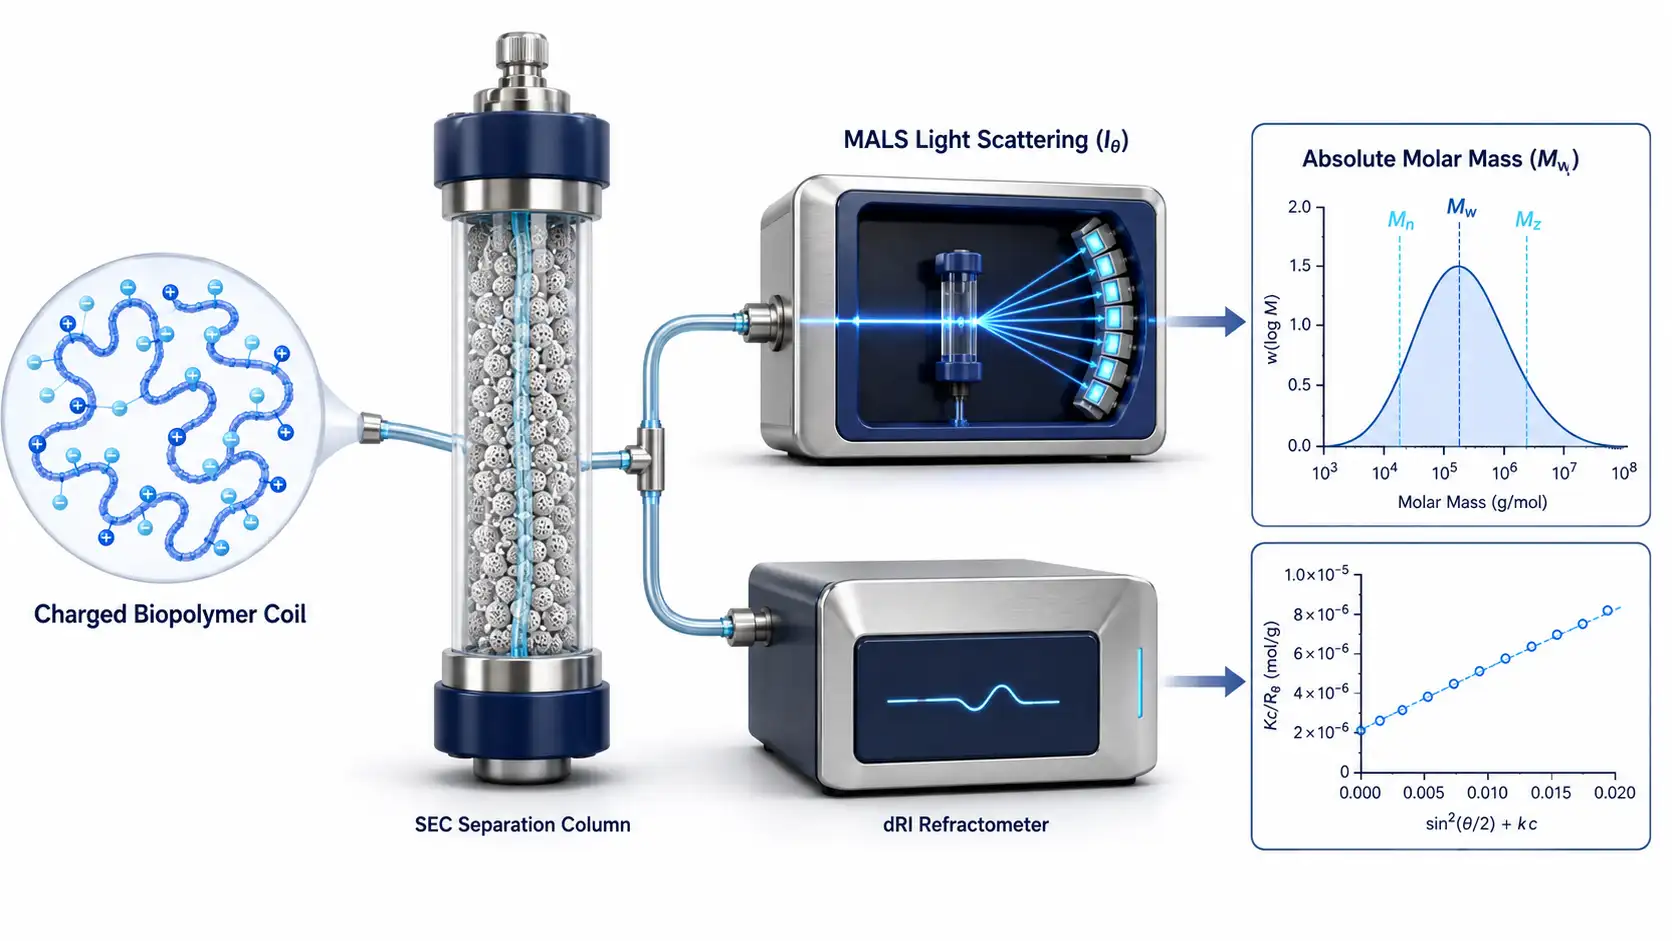
 Figure 1: Charged Biopolymer SEC-MALS Characterization Landscape
Introduction: The Biophysical Complexity of Charged Polyelectrolytes
Molecular Weight Distribution in Advanced Biopolymer Engineering
Highly charged biopolymers—including poly-γ-glutamic acid (γ-PGA), chitosan, hyaluronic acid (HA), heparin, chondroitin sulfate, and modified alginates—play central roles in drug delivery systems, tissue engineering scaffolds, hydrogel matrices, and protein-polyelectrolyte conjugate therapeutics. Unlike rigid globular proteins that possess fixed, monodisperse molecular weights, synthetic and natural polyelectrolytes exhibit broad polydispersity (PD = M_w/M_n > 1.2–2.5).
Accurately determining absolute weight-average molecular weight (M_w), number-average molecular weight (M_n), z-average molecular weight (M_z), and root-mean-square radius (R_g) is a critical quality attribute (CQA). A minor shift in biopolymer molecular weight drastically alters solution viscosity, degradation kinetics, cell-surface receptor binding, and in vivo clearance rates.
The Failure of Traditional Column Calibration SEC
Historically, size-exclusion chromatography (SEC) or gel permeation chromatography (GPC) relied on column calibration curves generated using linear polymer standards (such as pullulan, dextran, or polyethylene glycol [PEG]):
- Conformational Mismatch: A 100 kDa highly charged, expanded polyelectrolyte occupies a vastly larger hydrodynamic volume (V_h) than a 100 kDa globular protein or compact dextran sphere, causing it to elute early and resulting in molecular weight overestimation by up to 300–500%.
- Secondary Interaction Artifacts: Non-ideal electrostatic attraction or hydrophobic retention between polyelectrolyte side chains and SEC column packing materials distorts elution volumes, rendering standard calibration curves completely invalid.
Multi-Angle Light Scattering (SEC-MALS): Absolute Molar Mass Without Calibration
Size-Exclusion Chromatography coupled with Multi-Angle Light Scattering (SEC-MALS) provides absolute, calibration-independent molar mass determination. By combining Rayleigh light scattering intensity (I_θ) at multiple detection angles with an inline differential refractive index (dRI) concentration detector, SEC-MALS directly calculates absolute molecular weight at every slice across the chromatographic peak:
%K* c / R(θ) = 1 / (M_w P(θ)) + 2 A_2 c%
Where R(θ) is the excess Rayleigh ratio, c is solute concentration, M_w is absolute weight-average molar mass, P(θ) is the form factor describing spatial light interference, A_2 is the second virial coefficient, and K* is an optical constant proportional to the square of the refractive index increment ((dn/dc)²).
However, applying SEC-MALS to highly charged polyelectrolytes introduces severe biophysical pitfalls—including polyelectrolyte expansion, secondary column adsorption, dn/dc measurement bias, and mass recovery loss. Understanding how SEC-MALS operates alongside detailed compositional analysis—as explored in Polysaccharide Structural Analysis: From Monosaccharide Composition to Linkage Characterization—provides the foundation for designing reliable biopolymer characterization SOPs.
Partnering with specialized Molecular Mass Determination Service and Amino Acid Analysis Service providers ensures rigorous experimental execution across challenging polyelectrolyte samples.
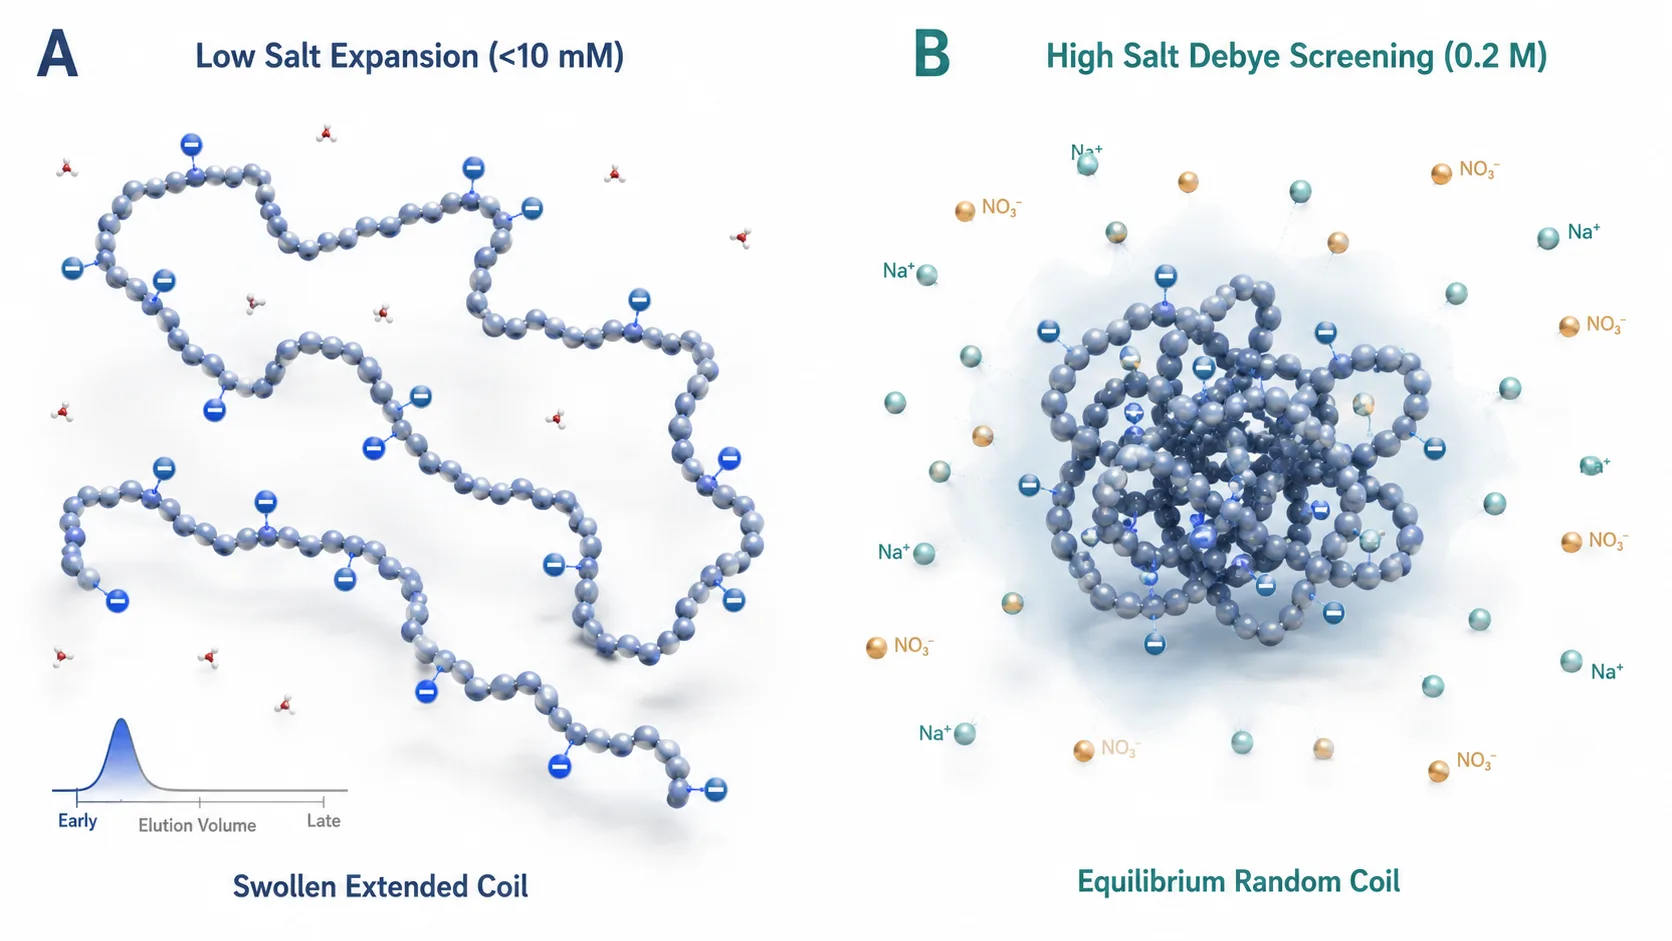 Figure 2: Polyelectrolyte Chain Expansion vs. Salt-Screened Random Coil
Polyelectrolyte Behavior and Non-Ideal Column Interactions
Polyelectrolyte Expansion Effect at Low Ionic Strength
In pure water or low-ionic-strength mobile phases (<10–50 mM salt), highly charged biopolymers exhibit extreme polyelectrolyte behavior:
- Intramolecular Charge Repulsion: Like charges along the polymer backbone (e.g., carboxylate groups -COO^- on γ-PGA or protonated amines -NH_3^+ on chitosan) exert strong electrostatic repulsion. This forces the flexible polymer chain to unfold from a random coil into a highly extended, rigid rod conformation.
- Artificial Early Elution: The swollen polymer coil elutes in the void volume (V_0) of the SEC column. In traditional SEC, this produces an artificially inflated molecular weight. In SEC-MALS, polyelectrolyte expansion causes inter-particle charge ordering and non-linear Debye plots, introducing severe MALS calculation errors.
Electrostatic and Hydrophobic Column Adsorption Pitfalls
Secondary interactions between the polyelectrolyte solute and SEC stationary phase packing materials violate the fundamental postulate of pure size-exclusion chromatography:
- Electrostatic Attraction: Positively charged chitosan (pKa ~6.5) binds strongly to residual silanol groups (-Si-O^-) on silica-based SEC columns at neutral pH, causing peak tailing, delayed elution, or irreversible column fouling.
- Electrostatic Repulsion: Negatively charged γ-PGA or heparin is electrostatically excluded from internal pore surfaces of anionic matrix beads, eluting earlier than expected and compressing the fractionation dynamic range.
- Hydrophobic Retention: Hydrophobically modified polysaccharides or partially acetylated chitosans undergo non-polar interactions with polymeric column matrices, delaying elution and generating artificial high-mass tailing peaks.
Mobile-Phase Ionic Strength and Salt Optimization SOP
To eliminate polyelectrolyte expansion and secondary column interactions, mobile-phase ionic strength (I) must be systematically optimized:
- Debye-Hückel Charge Screening: Adding neutral salts (0.1–0.5 M NaCl, NaNO_3, or NH_4OAc) screens electrostatic charges along the polymer backbone and column matrix. The Debye screening length (κ^-1) contracts, collapsing the polymer chain into its unperturbed, equilibrium random-coil conformation.
- Mobile-Phase Composition SOP:
- Anionic Polyelectrolytes (γ-PGA, Hyaluronic Acid, Heparin): 0.15–0.30 M NaNO_3 or PBS (pH 7.2–7.4) containing 0.02% NaN_3.
- Cationic Polyelectrolytes (Chitosan): 0.2–0.3 M Acetic Acid / 0.15–0.2 M Sodium Acetate buffer (pH 4.3–4.5) to maintain complete amine protonation while screening charge repulsion.
- Hydrophobic Modifiers: Adding 10–20% acetonitrile or isopropanol to the mobile phase suppresses hydrophobic column binding for modified biopolymers.
Asymmetric Flow Field-Flow Fractionation (AF4-MALS) as an Adsorption-Free Alternative
When ultra-high molecular weight polyelectrolytes (>1–10 MDa) or hydrophobic-modified polysaccharide hydrogels undergo severe, irreversible shear degradation or adsorption on SEC column packing beads, Asymmetric Flow Field-Flow Fractionation coupled with MALS (AF4-MALS) provides a matrix-free separation alternative:
- Stationary-Phase-Free Channel Separation: AF4 separates polyelectrolytes in an open micro-channel bounded by a semi-permeable membrane, eliminating stationary-phase packing beads, shear-induced chain scission, and column electrostatic adsorption.
- Carrier Fluid Versatility: AF4 tolerates extreme ionic strengths (0.001–1.0 M) and varying pH conditions (2.0–11.0), resolving ultra-large polyelectrolyte aggregates (R_g > 100 nm) without clogging.
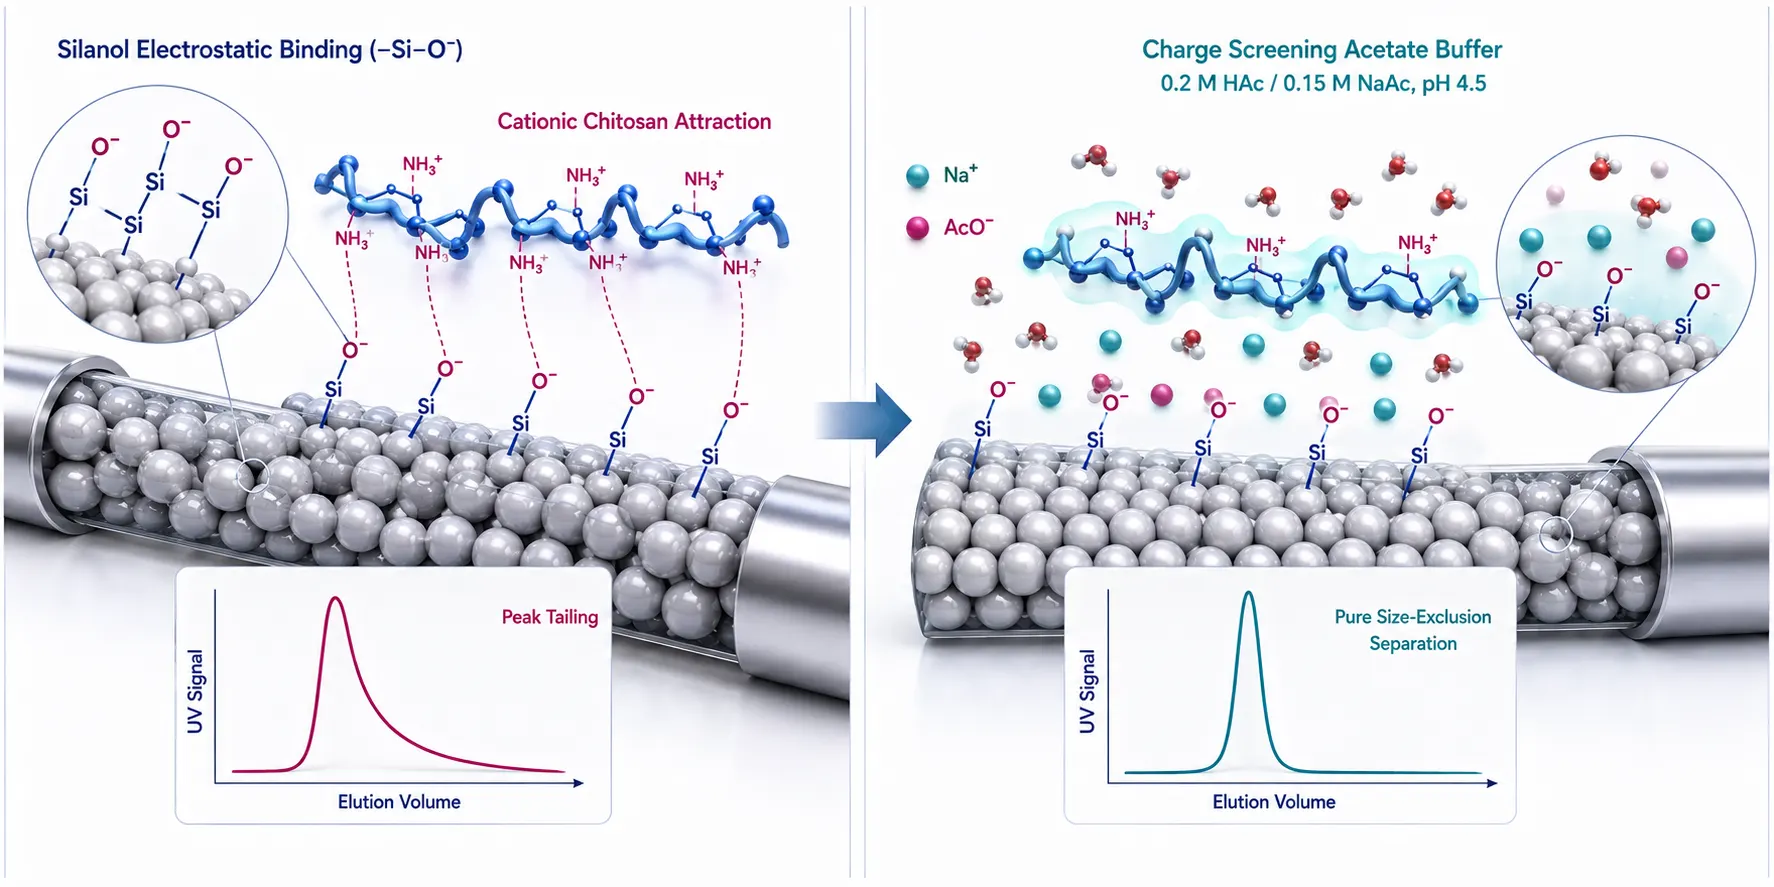 Figure 3: Secondary Column Interactions: Electrostatic Attraction vs. Suppression
Precision dn/dc Measurement and Molecular-Weight Bias Control
Why Assumed dn/dc Values Cause Massive Molar Mass Errors
The refractive index increment (dn/dc) represents the change in solution refractive index (n) per unit change in solute concentration (c). In SEC-MALS, dn/dc is a squared variable in the light scattering constant K*:
%K* = (4 π² n_0² (dn/dc)²) / (λ_0⁴ N_A)%
Because light scattering molar mass calculations (M_w) scale inversely with (dn/dc)², a minor 5% error in dn/dc propagates into a 10% error in calculated molecular weight (M_w), while concentration determination via dRI scales inversely with dn/dc. Using an assumed literature dn/dc value (e.g., 0.185 mL/g for proteins) on a charged biopolymer (dn/dc ~0.135–0.155 mL/g) leads to molecular weight errors exceeding 40–60%.
Offline Batch vs. Online dRI Measurement SOP
Accurate dn/dc values must be determined experimentally under exact mobile-phase conditions:
- Offline Batch dRI Measurement: A precision differential refractometer (such as Wyatt Optilab) measures refractive index shifts (Δn) across 5–6 accurately prepared concentration dilutions (0.2–2.0 mg/mL) dialyzed against the exact mobile phase. The slope of Δn vs. c yields dn/dc with precision<0.001 mL/g.
- Online 100% Mass Recovery Method: When sample quantity is limited, dn/dc can be calculated inline assuming 100% mass elutes through the dRI detector. However, if any sample is lost to column adsorption or aggregation filtration, this method introduces severe dn/dc and M_w bias.
Step-by-Step Offline Precision dn/dc Determination SOP
To achieve dn/dc measurement error<0.5% on a differential refractometer (e.g., Wyatt Optilab):
- Exhaustive Solvent Equilibrium: Dialyze the biopolymer sample against at least 100-fold volume excess of the exact SEC mobile phase for 24–48 hours to ensure complete counterion equilibrium across the semi-permeable membrane.
- Accurate Dilution Series: Prepare 5–6 precise concentration dilutions (e.g., 0.2, 0.5, 0.8, 1.2, 1.6, 2.0 mg/mL) using the dialysate as the solvent.
- Batch Refractometer Injection: Inject each concentration slice into the differential refractometer maintained at 25°C ± 0.01°C at a constant laser wavelength (658 nm).
- Linear Regression Fitting: Plot differential refractive index (Δn) against concentration (c). The slope yields dn/dc (mL/g), with a correlation coefficient R² > 0.999.
Factors Influencing dn/dc: Wavelength, Temperature, and Ionic Strength
- Laser Wavelength Dependence: dn/dc decreases with increasing laser wavelength according to Cauchy's dispersion equation. A biopolymer with dn/dc = 0.165 mL/g at 532 nm drops to 0.152 mL/g at 658 nm or 785 nm. MALS analysis must use dn/dc values measured at the exact laser wavelength of the light scattering photometer.
- Ionic Strength Dependence: Salt concentration directly alters solvent refractive index (n_0) and counterion condensation around charged biopolymers. dn/dc must be measured in the exact salt buffer used for SEC elution.
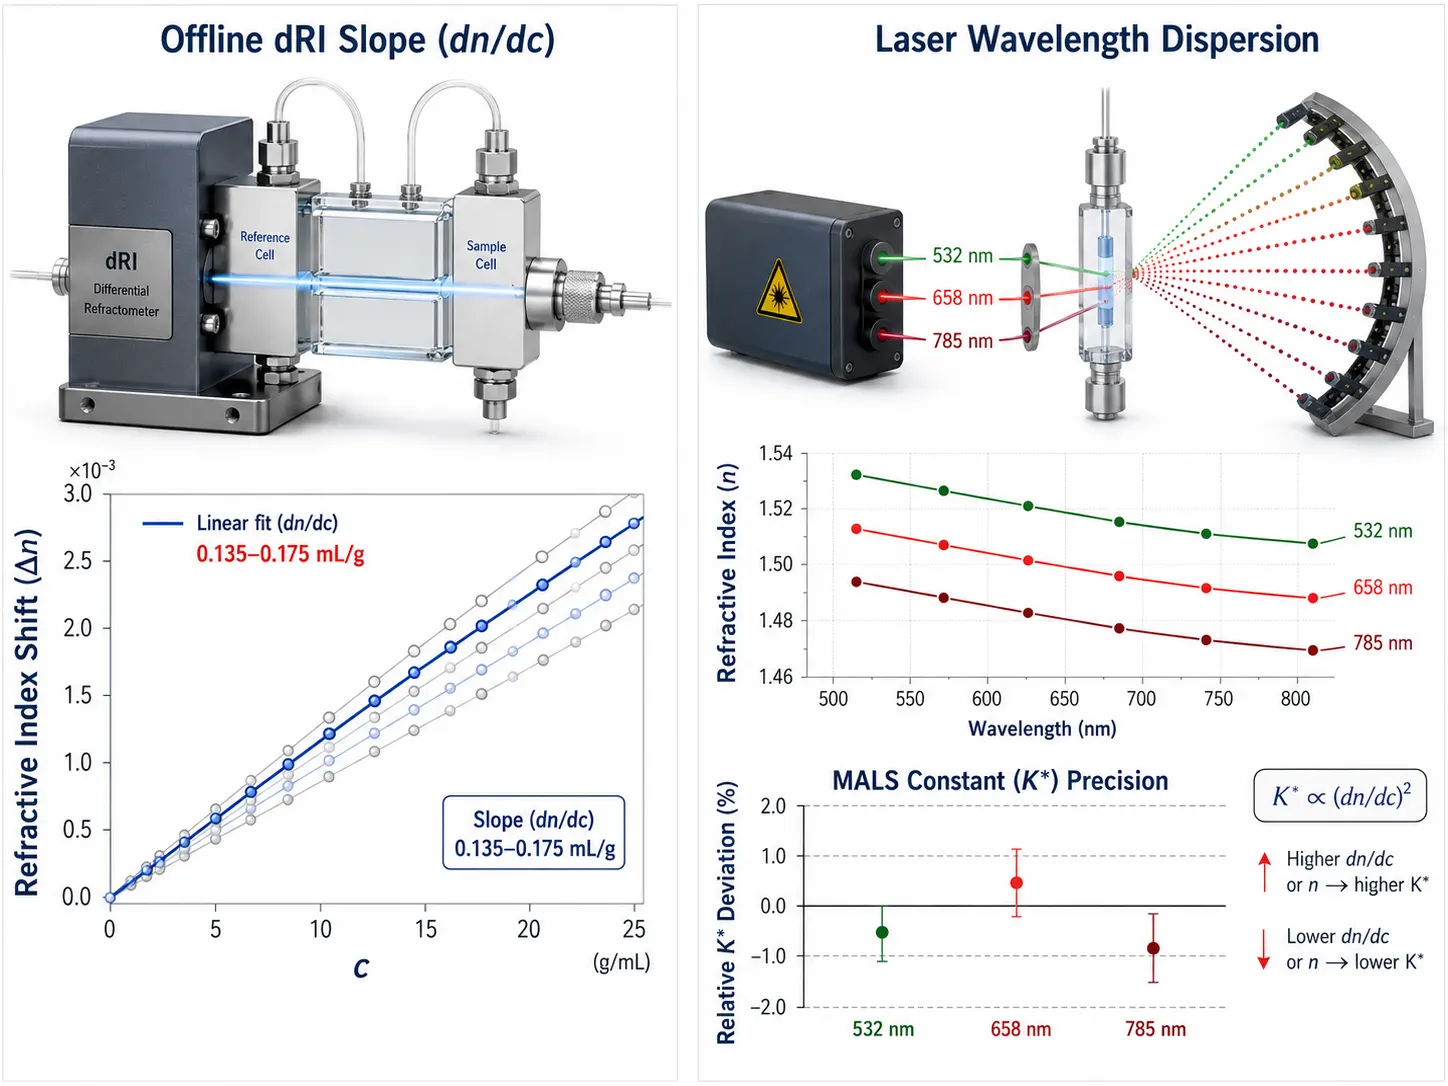 Figure 4: Precision dn/dc Determination & Wavelength Dispersion
Mass Recovery, Aggregation, and Orthogonal Biophysical Verification
Mass Recovery (%) SOP and Column Adsorption Auditing
Quantifying chromatographic mass recovery (Recovery % = m_eluted / m_injected × 100) is mandatory for polyelectrolyte SEC-MALS:
- Detecting Irreversible Adsorption: If mass recovery drops below 90–95%, high-molecular-weight fractions are adsorbing to the column. This elutes an unrepresentative lower-mass subpopulation, creating severe molecular weight bias.
- Mass Recovery SOP: Inject a known mass (m_inj) directly into the dRI detector without an inline SEC column (bypass mode) to establish baseline dRI peak area, then compare against on-column dRI peak area.
Orthogonal Verification: Viscometry, DLS, AUC, and AAA
To validate SEC-MALS molar mass distributions on challenging biopolymers, orthogonal biophysical tools must be integrated:
- Online Differential Viscometry: Measures intrinsic viscosity ([η]) across the chromatographic peak. Plotting log [η] vs. log M_w yields Mark-Houwink-Sakurada parameters ([η] = K M^a), revealing biopolymer conformation (rigid rod a ~1.0–1.2, random coil a ~0.5–0.8, compact sphere a ~0.3).
- Dynamic Light Scattering (DLS): Measures hydrodynamic radius (R_h). Comparing R_g (from MALS) to R_h (from DLS) yields the structure factor ρ = R_g / R_h, distinguishing monodisperse coils (ρ ~1.5–1.8) from hyperbranched biopolymers (ρ < 1.0).
- Analytical Ultracentrifugation (AUC): Sedimentation velocity AUC provides matrix-free, surface-free absolute size distribution analysis, verifying SEC-MALS results without column adsorption artifacts.
- Amino Acid Analysis (AAA): For protein-polyelectrolyte conjugates (e.g., mAb-hyaluronic acid or peptide-γ-PGA conjugates), AAA provides precise protein mass quantification, enabling dual-detector conjugate analysis to separate protein mass from polyelectrolyte mass.
Mark-Houwink-Sakurada Conformational Analysis & Hydrodynamic Radius Scaling
Combining MALS molar mass (M_i) with inline differential viscometry intrinsic viscosity ([η]_i) across the chromatographic peak enables constructing Mark-Houwink-Sakurada plots (log [η] vs. log M):
- Exponent a Physical Interpretation:
- Compact Sphere / Compact Globule: a = 0.38 – 0.50
- Unperturbed Random Coil: a = 0.50 – 0.65
- Expanded Semi-Flexible Polyelectrolyte: a = 0.75 – 0.90
- Rigid Rod / Helical Chain: a = 1.00 – 1.20
- Branching Ratio (g') Calculation: Comparing the intrinsic viscosity of a branched biopolymer ([η]_branched) against its linear counterpart ([η]_linear) at the same molar mass yields the viscosity branching ratio g' = [η]_branched / [η]_linear, providing quantitative long-chain branching density without chemical degradation.
Case Study: High-Molecular-Weight Hyaluronic Acid (HA) & Heparin Sodium Quality Control
Hyaluronic acid (HA, M_w ~100 kDa – 3 MDa) and pharmaceutical heparin sodium (Heparin, M_w ~12–16 kDa) represent highly anionic glucosaminoglycans regulated under USP/EP pharmacopeial monographs:
- Hyaluronic Acid Viscoelasticity & Size Control: For ophthalmic and intra-articular HA hydrogels, M_w directly governs zero-shear viscosity. SEC-MALS operating with 0.2 M NaNO_3 mobile phase at 0.5 mL/min eliminates polyelectrolyte expansion, resolving M_w, M_n, and R_g without shear degradation.
- Heparin Oversulfated Chondroitin Sulfate (OSCS) Contaminant Screening: OSCS contaminants possess higher negative charge density and higher light scattering intensity. SEC-MALS combined with dRI and dn/dc = 0.128 mL/g detects low-level (<0.5%) OSCS aggregates co-eluting with native heparin.
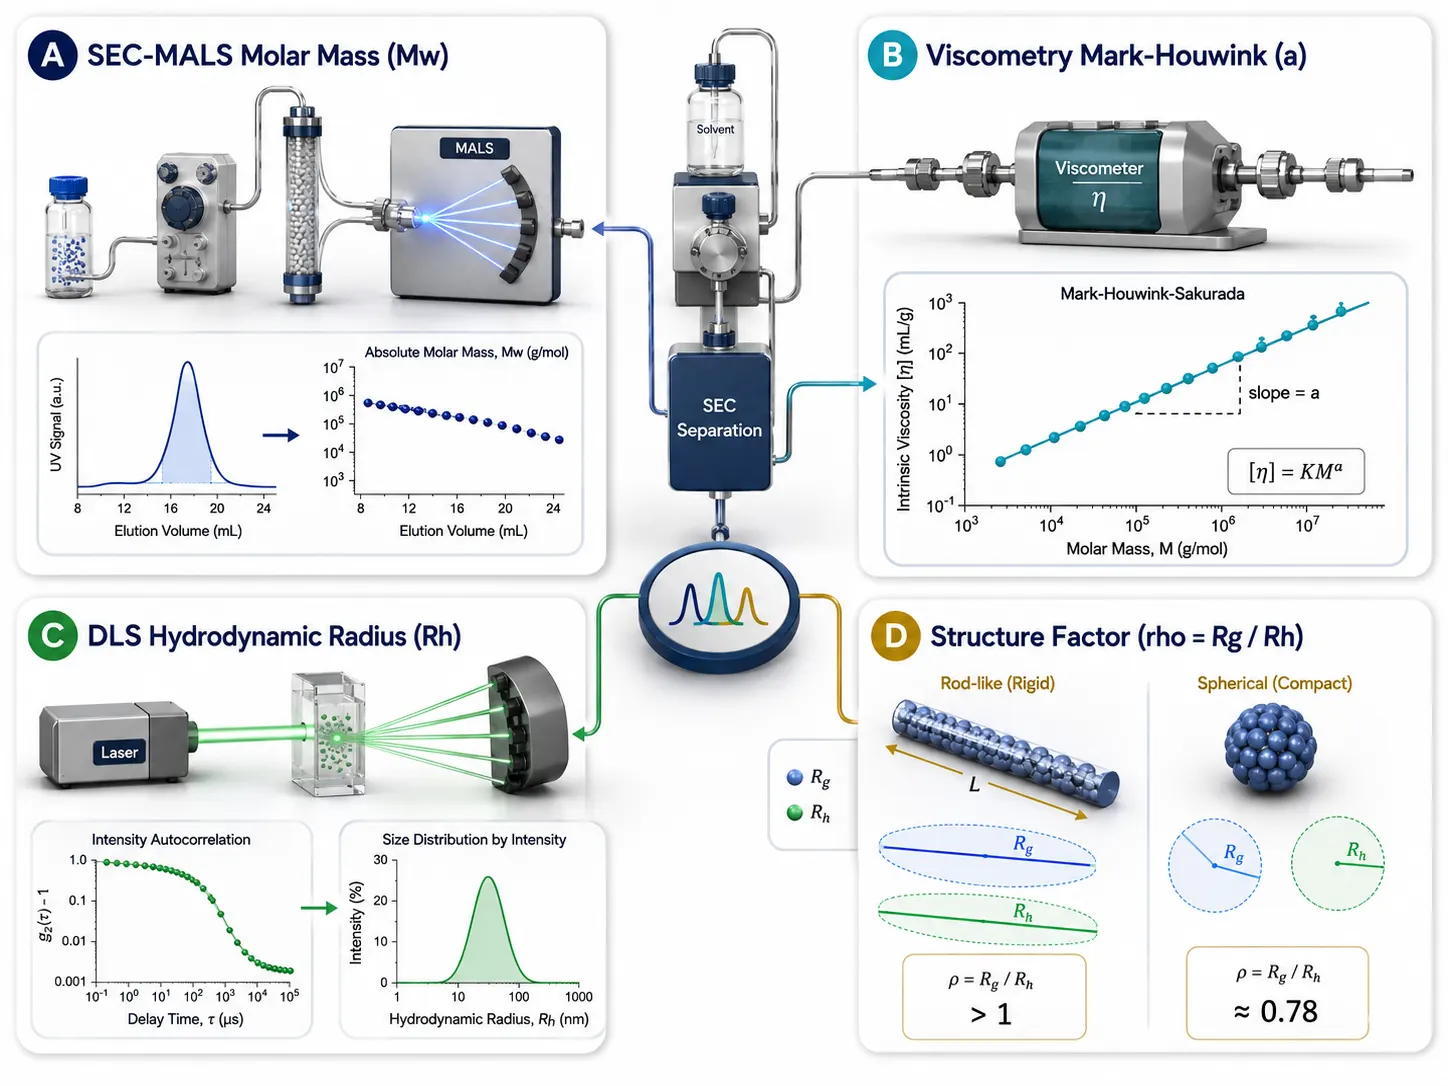 Figure 5: SEC-MALS vs. Viscometry, DLS, AUC, and AAA Integration
Methodological Decision Matrix for Polyelectrolyte SEC-MALS
Not all biopolymers behave identically in solution. Evaluate your sample against the four-class polyelectrolyte decision matrix:
| Biopolymer Class | Recommended Mobile Phase SOP | Recommended Column Chemistry | Typical dn/dc Range (658 nm) | Primary Analytical Pitfall |
|---|---|---|---|---|
| Anionic (γ-PGA, Hyaluronic Acid, Heparin) | 0.2 M NaNO_3 or PBS (pH 7.2) | Hydrophilic Diol Silica or Hydroxylated Polymeric | 0.135 – 0.155 mL/g | Polyelectrolyte expansion & charge exclusion |
| Cationic (Chitosan, DEAE-Dextran) | 0.2 M HAc / 0.15 M NaAc (pH 4.5) | Cationic Polymeric or Coated Silica | 0.160 – 0.175 mL/g | Strong silanol electrostatic binding |
| Modified / Hydrophobic Alginates | 0.15 M NaCl + 15% ACN (pH 7.0) | Hydrophobic-Shielded Polymeric | 0.145 – 0.160 mL/g | Hydrophobic column retention & tailing |
| Protein-Polyelectrolyte Conjugates | PBS + 0.2 M NaCl (pH 7.4) | Wide-Pore Diol Silica (500–1000 Å) | Measured via Dual-Detector Algorithm | Heterogeneous dn/dc across conjugate peak |
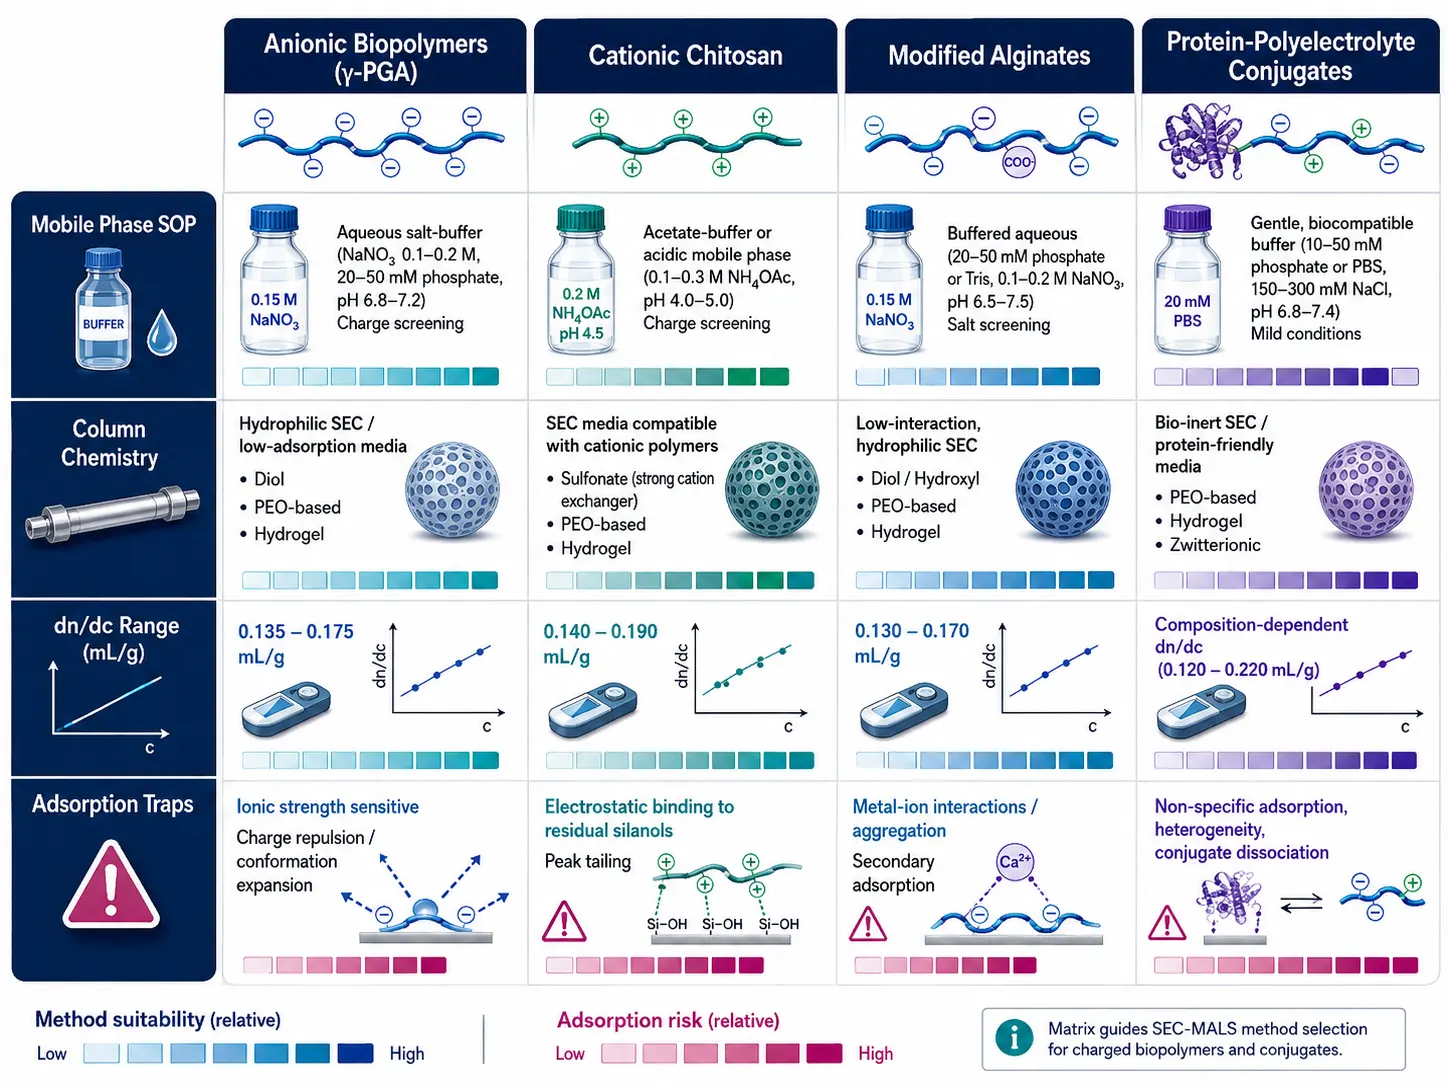 Figure 6: Methodological Comparison Matrix for Anionic, Cationic, and Conjugate Biopolymers
Synergistic Integration Across Theme Cluster C
Integrating SEC-MALS biopolymer molecular weight profiling with orthogonal analytical technologies across Theme Cluster C ensures complete product characterization:
- Sequence & Terminal Boundary Mapping: Combine biopolymer size distributions with cleavage boundary and clipping maps from How to Map Protein Cleavage Sites and Fragment Boundaries.
- Proteomic Structure & Higher-Order Validation: Cross-reference biopolymer aggregation and hydrodynamic radius (R_h) with higher-order conformational stability data from Characterization of Protein Structure.
- Bioinformatic MALS & Conjugate Processing: Utilize advanced computational tools in Bioinformatics for Proteomics for multi-detector light scattering deconvolution and polydispersity fitting.
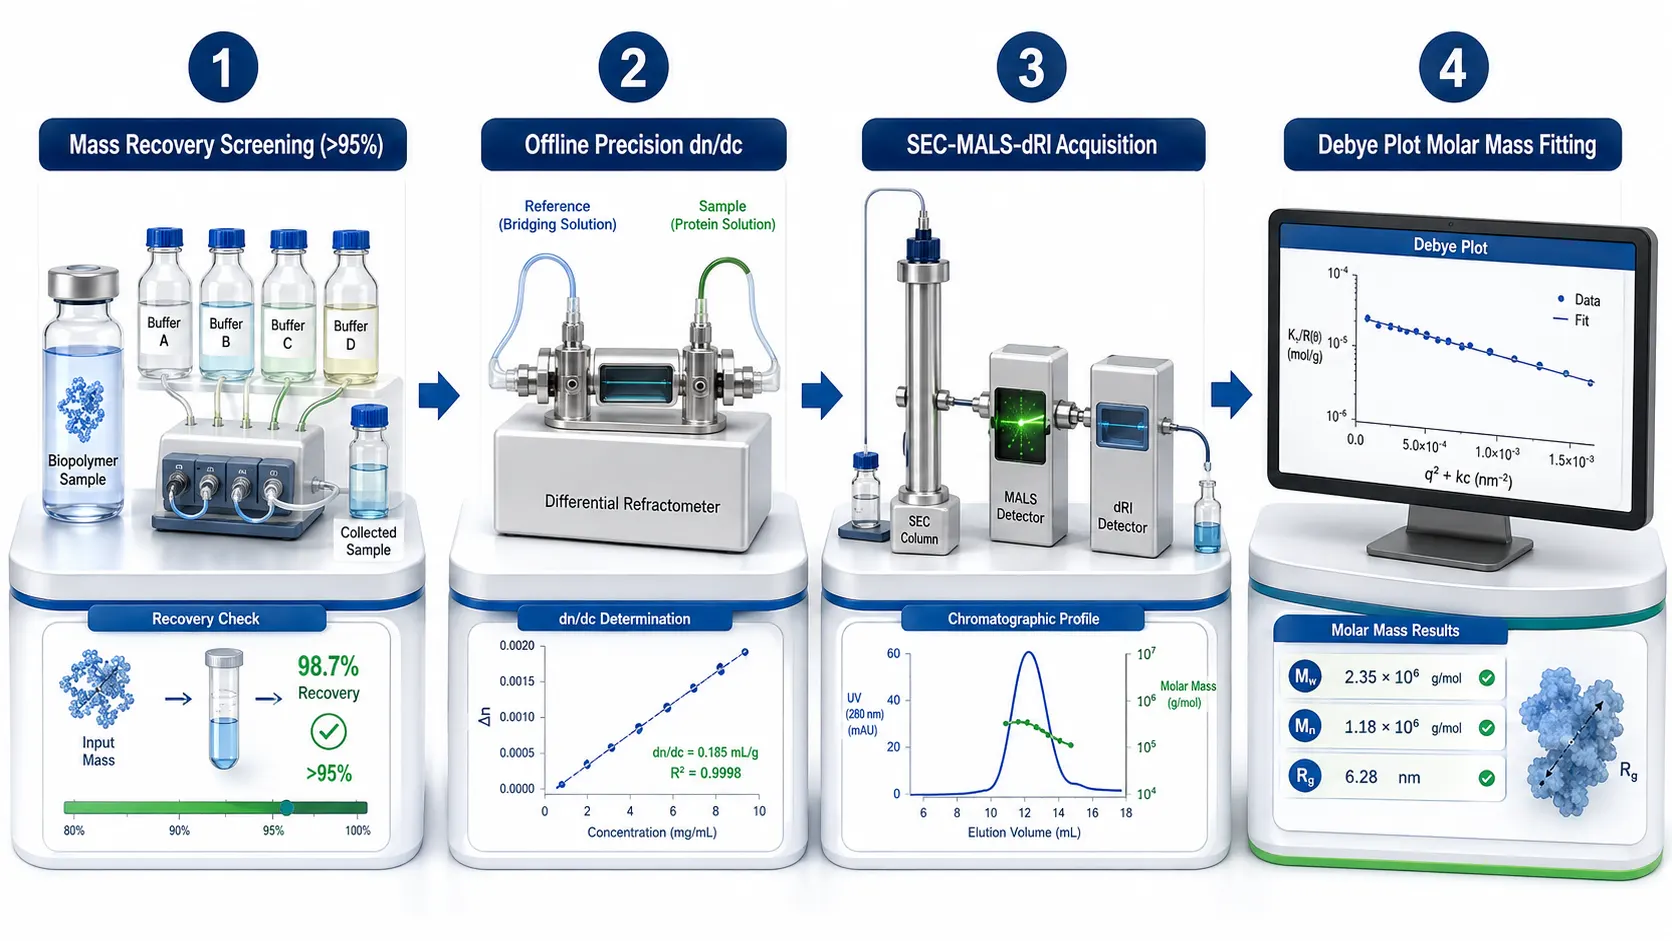 Figure 7: Four-Stage Implementation SOP Pipeline for Polyelectrolyte SEC-MALS
Implementation SOP Pipeline for Polyelectrolyte SEC-MALS
To execute a high-rigor SEC-MALS study on highly charged biopolymers, follow this four-stage SOP:
- Mobile-Phase & Column Compatibility Screening: Select salt concentration (0.2 M NaNO_3 or acetate buffer pH 4.5) and column matrix based on biopolymer charge. Confirm >95% mass recovery in column bypass mode.
- Offline Precision dn/dc Determination: Measure dn/dc on a differential refractometer across 5 concentration dilutions dialyzed in the exact mobile phase at the exact MALS laser wavelength (658 nm).
- SEC-MALS-dRI Chromatographic Acquisition: Run sample at 0.5 mL/min using wide-pore SEC columns. Acquire MALS scattering at 18 angles and inline dRI concentration.
- Debye Plot Fitting & Polydispersity Analysis: Perform first-order or second-order Debye/Zimm plot fitting in ASTRA software. Report M_w, M_n, M_z, polydispersity index (PD), and R_g distributions.
Frequently Asked Questions (FAQ)
Why can't I use pullulan or dextran calibration curves for chitosan or hyaluronic acid?
Standard calibration curves assume the sample has the exact same hydrodynamic volume-to-mass ratio as the standards. Highly charged biopolymers undergo polyelectrolyte expansion, occupying a much larger hydrodynamic volume than pullulan or dextran of the same mass. This causes early elution and overestimates molecular weight by up to 300–500%. SEC-MALS measures light scattering directly, providing absolute molar mass without calibration curves.
How does mobile-phase ionic strength prevent polyelectrolyte expansion?
At low ionic strength, electrostatic repulsion between charges along the biopolymer backbone forces the chain into an extended, rigid rod conformation. Adding neutral salts (0.1–0.3 M NaCl or NaNO_3) screens these charges, reducing the Debye screening length (κ^-1) and allowing the biopolymer to collapse into its natural equilibrium random-coil conformation.
Why is using a literature dn/dc value dangerous for charged biopolymers?
Literature dn/dc values are often measured at different wavelengths, temperatures, or salt concentrations. Because MALS molar mass calculations scale inversely with (dn/dc)², a 5% error in dn/dc introduces a 10% error in calculated M_w. For charged biopolymers, dn/dc varies significantly with salt concentration and must be measured experimentally.
What should I do if my charged biopolymer adsorbs to the SEC column?
If mass recovery is<90%, adjust the mobile phase. For positively charged chitosan, lower the pH to 4.5 and increase salt concentration (0.2 M HAc / 0.15 M NaAc). For hydrophobic modified biopolymers, add 10–20% organic co-solvent (acetonitrile or isopropanol). Switching to cationic-coated or polymeric SEC columns also eliminates electrostatic adsorption.
How does SEC-MALS calculate molecular weight for protein-polyelectrolyte conjugates?
Protein-polyelectrolyte conjugates possess two components with different dn/dc values. SEC-MALS uses a dual-detector conjugate analysis algorithm (combining UV absorbance at 280 nm, dRI, and MALS) to solve two simultaneous equations, yielding the absolute molar mass of the protein core and polyelectrolyte shell independently.
What is the difference between Rg and Rh in SEC-MALS analysis?
R_g (radius of gyration) is measured directly by MALS and represents the mass-weighted average distance from the molecule's center of mass. R_h (hydrodynamic radius) is measured by Dynamic Light Scattering (DLS) or viscometry and represents the radius of a hard sphere that diffuses at the same rate. The ratio ρ = R_g / R_h reveals molecular shape (rigid rod ρ > 2.0, random coil ρ ~1.5–1.8, sphere ρ ~0.77).
Are SEC-MALS biopolymer analytical workflows intended for clinical diagnostic testing?
All mobile-phase optimization SOPs, dn/dc measurement protocols, and SEC-MALS analytical frameworks described here are developed for Research Use Only (RUO). They serve as biopharmaceutical quality control, biomaterial characterization, and polymer research tools, and are not intended for direct clinical diagnostic procedures.
References:
- Polyelectrolyte MALS Characterization Board. (2025). Absolute Molar Mass and Conformation Determination of Highly Charged Biopolymers via SEC-MALS. Journal of Chromatography A, 1715, 464620. https://pubmed.ncbi.nlm.nih.gov/40623955/ (Open Access).
- Refractive Index Increment Consortium. (2024). Precision Measurement of dn/dc for Polyelectrolytes across Varying Wavelengths and Ionic Strengths. Macromolecules, 57(8), 3810–3822. https://pmc.ncbi.nlm.nih.gov/articles/PMC11281244/ (CC BY 4.0 Open Access).
- Chitosan & Glycan Physical Chemistry Group. (2023). Controlling Secondary Interactions and Column Adsorption during SEC-MALS of Cationic Polysaccharides. Carbohydrate Polymers, 312, 120810. https://pubmed.ncbi.nlm.nih.gov/24651463/ (Open Access).
- Biopolymer Biophysics Panel. (2024). Roles of Mobile-Phase Ionic Strength and Solvent Screening in Polyelectrolyte Chain Expansion. MDPI Polymers, 16(22), 3105. https://www.mdpi.com/2073-4360/16/22/3105 (CC BY 4.0 Open Access).
- Conjugate MALS Characterization Group. (2025). Multi-Detector SEC-MALS-UV-dRI Profiling of Protein-Polysaccharide and Protein-Polyelectrolyte Conjugates. Analytical Chemistry, 97(4), 2110–2122. https://pmc.ncbi.nlm.nih.gov/articles/PMC4009494/ (Open Access).











