Introduction
Polyphenols represent one of the most structurally diverse classes of plant-derived natural products, with over 8,000 identified compounds spanning phenolic acids, flavonoids, anthocyanins, and tannins. This chemical diversity translates into equally diverse biological activities, making polyphenols a subject of intense research interest in nutritional biochemistry, pharmacology, and cosmetic science. However, the same structural complexity that gives polyphenols their functional relevance also creates formidable analytical challenges. Polyphenols span a wide polarity range, from simple phenolic acids like gallic acid (logP 0.7) to polymeric proanthocyanidins (logP >5), and exist in multiple glycosylated, methylated, and acylated forms within a single sample. Isomeric flavonoids differing only in the position of a single hydroxyl group can exhibit dramatically different biological activities, yet conventional LC-MS methods often fail to resolve them chromatographically. Matrix interference from co-extracted pigments, lipids, and sugars further complicates quantification. The emerging field of polyphenol metabolomics addresses these challenges through multi-platform analytical strategies that integrate LC-MS, GC-MS, and NMR with bioinformatic tools for comprehensive profiling. This guide covers the complete analytical pipeline for polyphenol analysis, from sample preparation through separation, detection, and method validation, with emphasis on emerging technologies that address the specific challenges of polyphenol characterization in complex biological matrices. All applications discussed herein are intended for research use only.
Polyphenol Chemistry and Classification
Understanding the chemical classification of polyphenols is prerequisite to selecting the appropriate analytical strategy, because each subclass demands different extraction conditions, chromatographic phases, and ionization parameters.
Phenolic Acids
Phenolic acids account for approximately one-third of dietary polyphenols and are characterized by a single phenolic ring substituted with one or more carboxyl groups. The two main subclasses are hydroxybenzoic acids (gallic acid, p-hydroxybenzoic acid, protocatechuic acid) and hydroxycinnamic acids (caffeic acid, ferulic acid, p-coumaric acid, chlorogenic acid). Hydroxycinnamic acids in plants are typically esterified to quinic acid or sugars rather than occurring as free acids, requiring alkaline or enzymatic hydrolysis before extraction for quantitative recovery. Their relatively simple structures and low molecular weight (170-380 Da) make them amenable to analysis by reversed-phase LC with ESI in negative ion mode, where they produce abundant [M-H]- ions. Phenolic acid analysis services routinely employ reversed-phase LC with ESI in negative ion mode for optimal sensitivity.
Flavonoids
Flavonoids share a common C6-C3-C6 diphenylpropane skeleton consisting of two aromatic rings (A and B) connected by a three-carbon bridge that forms a heterocyclic C ring. Substitution patterns on the C ring define the major flavonoid subclasses: flavones (apigenin, luteolin), flavonols (quercetin, kaempferol, myricetin), flavanones (naringenin, hesperetin), flavanols (catechin, epicatechin), and isoflavones (genistein, daidzein). Each subclass exhibits distinct UV absorption maxima that can be exploited for LC-UV detection: flavonols and flavones absorb at 350-370 nm and 330-350 nm respectively, providing a class-specific detection channel that complements mass spectrometry. Most flavonoids occur in nature as O-glycosides or C-glycosides, with the sugar moiety attached at the C3 or C7 position. Glycosylation increases polarity and water solubility but also introduces additional sites for isomerism: quercetin-3-O-glucoside and quercetin-4'-O-glucoside are structural isomers with identical molecular weight that require chromatographic or ion mobility separation for distinction. Flavonoid analysis services typically employ dedicated LC-MS/MS methods that account for these glycosylation patterns.
Anthocyanins
Anthocyanins are the glycosylated forms of anthocyanidins, the pigments responsible for red, blue, and purple colors in fruits and flowers. The six most abundant anthocyanidins are cyanidin, delphinidin, pelargonidin, peonidin, petunidin, and malvidin, differing by the number and position of hydroxyl and methoxy substituents on the B ring. Anthocyanins are uniquely charged in their flavylium cation form at low pH, which gives them a distinct absorption maximum at 500-540 nm and makes them detectable by UV-Vis without MS coupling for quantification in purified extracts. At neutral or alkaline pH, anthocyanins rapidly convert to colorless chalcone forms, so all analytical procedures must be conducted under acidic conditions (pH 1-2 for extraction, pH 2-3 for LC mobile phases). Anthocyanin profiling exploits the characteristic MS/MS fragmentation pattern: the loss of the glycosyl residue (162 Da for hexose, 132 Da for pentose) from the intact anthocyanin [M]+ ion to produce the aglycone fragment ion, which serves as a diagnostic transition for identification.
Tannins
Tannins are high-molecular-weight polyphenols (500-20,000 Da) that precipitate proteins through hydrogen bonding and hydrophobic interactions. Hydrolyzable tannins (ellagitannins, gallotannins) are esters of gallic acid with glucose, while condensed tannins (proanthocyanidins) are oligomers and polymers of flavan-3-ol units. Tannins present the most challenging analytical target among polyphenols. Tannin analysis services address these challenges through depolymerization strategies: proanthocyanidins up to tetramers can be separated and quantified by LC-MS, but higher oligomers require alternative approaches such as phloroglucinolysis depolymerization followed by LC-MS analysis of the released terminal and extension units.
Figure 1: Core Skeletal Structures of Four Major Polyphenol Classes
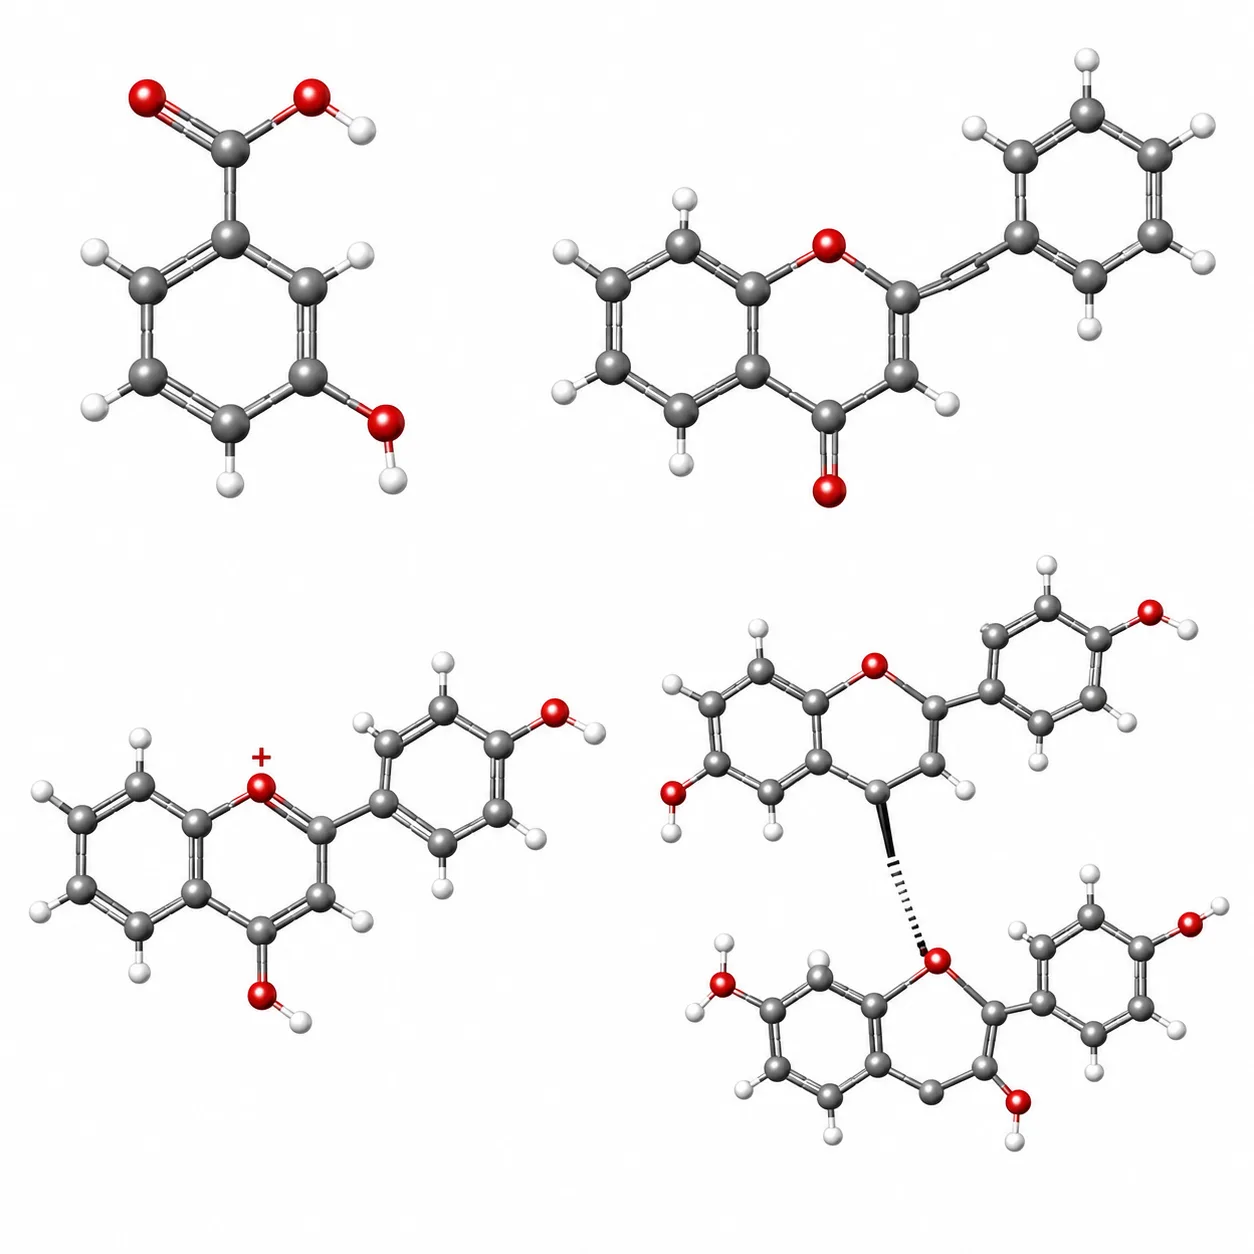 Chemical backbone structures of phenolic acids, flavonoids, anthocyanins (flavylium cation), and tannin oligomers illustrating structural diversity relevant to analytical method selection.
Sample Preparation Strategies for Polyphenol Analysis
Sample preparation is the most error-prone step in the polyphenol analytical workflow. Polyphenols are susceptible to oxidation by polyphenol oxidase (PPO) and atmospheric oxygen, subject to enzymatic hydrolysis by endogenous glycosidases, and variable in extraction efficiency across different solvent systems and tissue matrices.
Extraction from Plant Tissues
The standard extraction solvent for plant polyphenols is aqueous methanol or ethanol (50-80% v/v) acidified with 0.1-1% HCl or formic acid. The organic solvent disrupts the plant cell wall and solubilizes polyphenols, while the acid stabilizes anthocyanins in their flavylium form and inactivates PPO. Ultrasonication at 40-60 kHz for 15-30 minutes improves extraction yield by 20-40% compared to maceration alone, particularly for cell-wall-bound polyphenols. For comprehensive extraction of both free and bound polyphenols, a sequential hydrolysis protocol is recommended: first, release of soluble free polyphenols by aqueous-organic extraction; second, alkaline hydrolysis (2 M NaOH, 1 hour, room temperature) to release esterified hydroxycinnamic acids; third, acid hydrolysis (1.2 M HCl, 90 deg C, 1 hour) to release glycosidically bound polyphenols. Each fraction is analyzed separately to obtain the complete polyphenol profile. After extraction, C18 solid-phase extraction (SPE) is used to remove sugars, organic acids, and pigments that would otherwise suppress ionization and clog the LC column. Recovery rates for SPE cleanup typically exceed 85% for flavonoids and phenolic acids but drop below 60% for highly polar compounds such as hydroxytyrosol and gallic acid, which poorly retain on C18 sorbents. For these, polymeric SPE sorbents (e.g., Strata-X, Oasis HLB) provide superior retention across a wider polarity range.
Extraction from Biological Fluids
Polyphenols in plasma, serum, or urine exist predominantly as phase II conjugates, glucuronides, sulfates, and methyl ethers, rather than as free aglycones. Direct analysis of free polyphenols without deconjugation underestimates total polyphenol content by 70-90%. Enzymatic hydrolysis with a mixture of beta-glucuronidase and sulfatase (from Helix pomatia) at 37 deg C for 30-60 minutes releases the aglycones for quantification. After hydrolysis, proteins are precipitated with acidified acetonitrile (1% formic acid, 2:1 v/v sample:solvent), and the supernatant is concentrated by evaporation before SPE cleanup. A 2025 study demonstrated that microsampling techniques, specifically volumetric absorptive microsampling (VAMS), collect reproducible blood volumes (10-30 uL) for polyphenol analysis without requiring venipuncture, with metabolite stability maintained for 14 days at room temperature when the VAMS device is stored with a desiccant. This approach is particularly valuable for time-course pharmacokinetic studies of dietary polyphenols in animal models, where serial sampling from individual animals is constrained by total blood volume.
Stabilization During Processing
Polyphenol oxidation during sample processing produces quinones that polymerize into brown melanin-like pigments, causing underestimation of the native polyphenol content and introducing artifactual peaks in the chromatogram. The most effective stabilization strategy combines four elements: (1) processing at 4 deg C or on ice to slow enzymatic activity, (2) addition of 1% (w/v) ascorbic acid as a reducing agent to maintain polyphenols in their reduced form, (3) addition of 5 mM EDTA to chelate metal ions (Fe2+, Cu2+) that catalyze Fenton-type oxidation, and (4) pH adjustment to 2-3 with formic or phosphoric acid to inactivate PPO. Even with these precautions, extracts should be analyzed within 24 hours or stored at -80 deg C under nitrogen to prevent atmospheric oxidation during storage. A growing research focus since 2024 has been the characterization of non-extractable polyphenols (NEP)—high-molecular-weight polyphenols and bound phenolic compounds that remain in the extraction residue after conventional solvent extraction and require alkaline, acid, or enzymatic hydrolysis for release. These NEP fractions can account for up to 50% of total polyphenols in plant materials and are frequently overlooked in standard analytical workflows. Polyphenol analysis services typically implement these stabilization protocols as standard operating procedures to ensure data comparability across batches.
Figure 2: Sample Preparation Decision Tree for Different Polyphenol-Containing Matrices
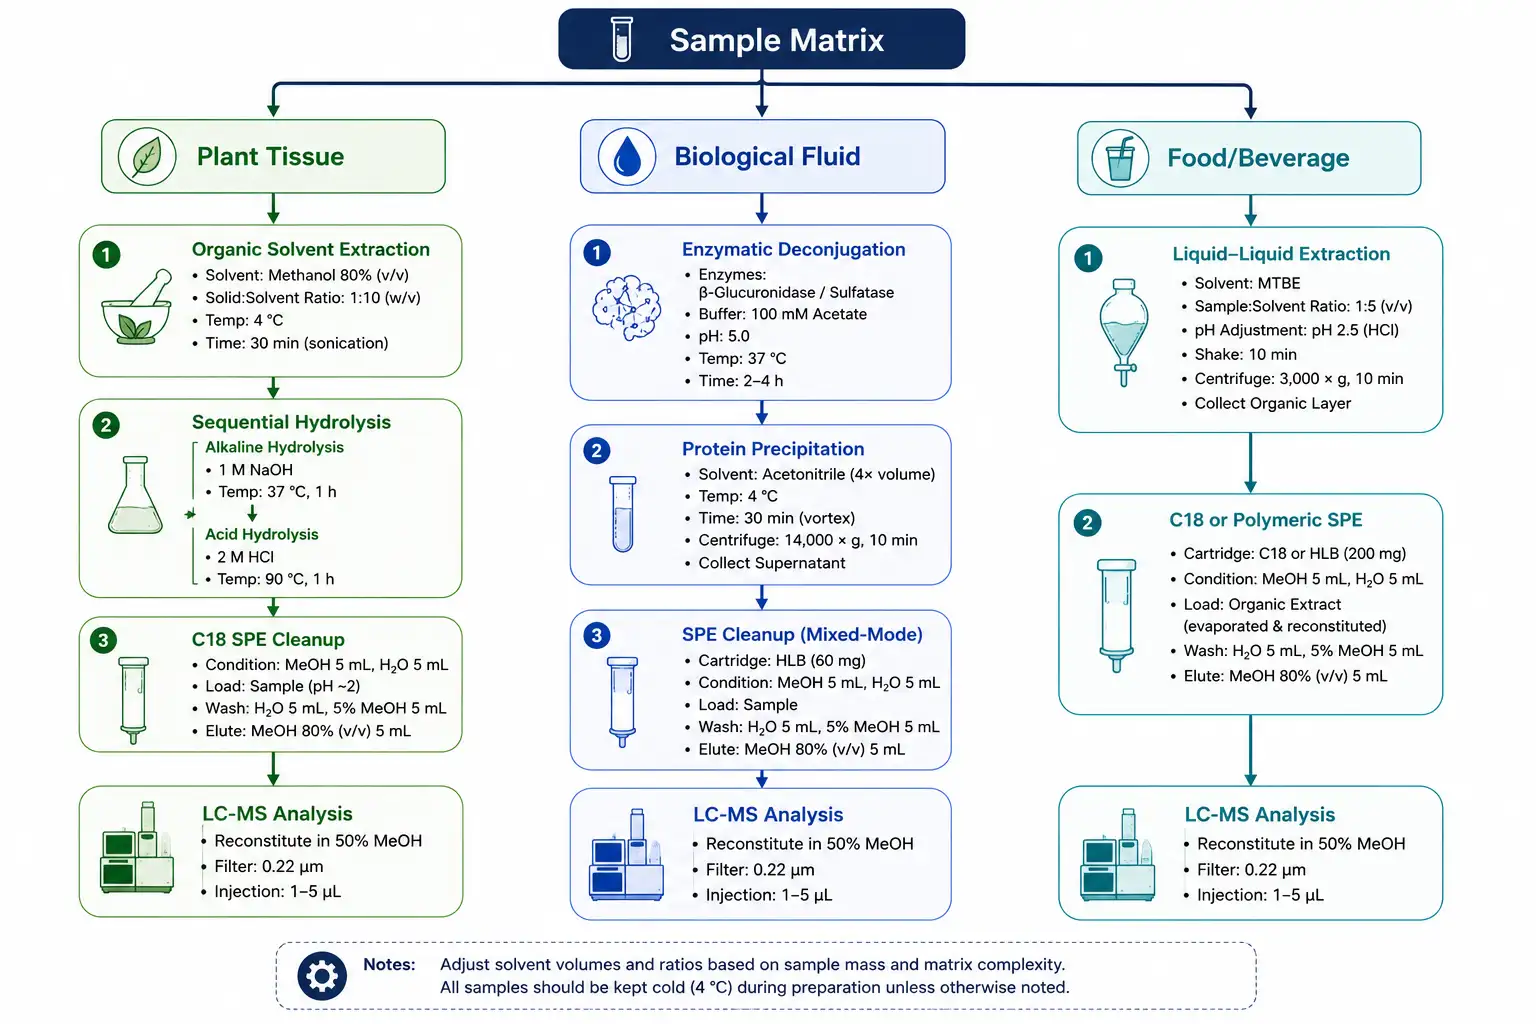 Matrix-specific extraction workflow distinguishing plant tissue, biological fluid, and food/beverage sample types with hydrolysis and cleanup branching logic.
Chromatographic Separation of Polyphenols
Reversed-phase LC on C18 columns (1.7-5 um particle size, 100-150 mm length) is the established standard for polyphenol separation. The mobile phase consists of water (phase A) and acetonitrile or methanol (phase B), both acidified with 0.1% formic acid to maintain acidic pH and optimize peak shape for phenolic acids. A typical gradient starts at 5% B, increases to 30% B over 20 minutes, then to 80% B over 10 minutes, and returns to initial conditions for re-equilibration. Under these conditions, phenolic acids elute first (3-12 minutes), followed by flavonoid glycosides (10-18 minutes), aglycones (18-25 minutes), and anthocyanins (15-22 minutes depending on pH-dependent retention). The choice between methanol and acetonitrile as the organic modifier affects selectivity: methanol provides stronger hydrogen-bonding interactions and better separation of flavonoid glycoside isomers, while acetonitrile produces sharper peaks for anthocyanins but weaker retention for very polar phenolic acids.
Core-shell (fused-core) columns with 2.6 um particles have become a practical alternative to fully porous sub-2 um UHPLC columns, offering comparable separation efficiency (typically 200,000-300,000 plates per meter for 5-member flavonoid glycoside series) at approximately half the backpressure. A 2024 comparative study demonstrated that a 10 cm core-shell C18 column achieved baseline resolution of 23 polyphenol standards, including position isomers of caffeoylquinic acids, in a 15-minute gradient, the same separation required 28 minutes on a conventional 5 um particle column operating at the same flow rate. For laboratories processing large batches of food or plant samples, the time savings of 40-50% per injection translate directly into higher throughput without sacrificing chromatographic resolution. HILIC columns provide an orthogonal separation dimension for highly polar phenolic acids and glycosylated flavonoids that show minimal retention on C18 in highly aqueous mobile phases. A comprehensive polyphenol profiling platform should include both reversed-phase and HILIC methods, with the RP separation optimized for the majority of flavonoids and phenolic acids and the HILIC separation reserved for the 10-15% of polyphenols that are too polar for adequate C18 retention.
Figure 3: Chromatographic Separation Comparison of Polyphenol Standards on Core-Shell vs Conventional C18 Columns
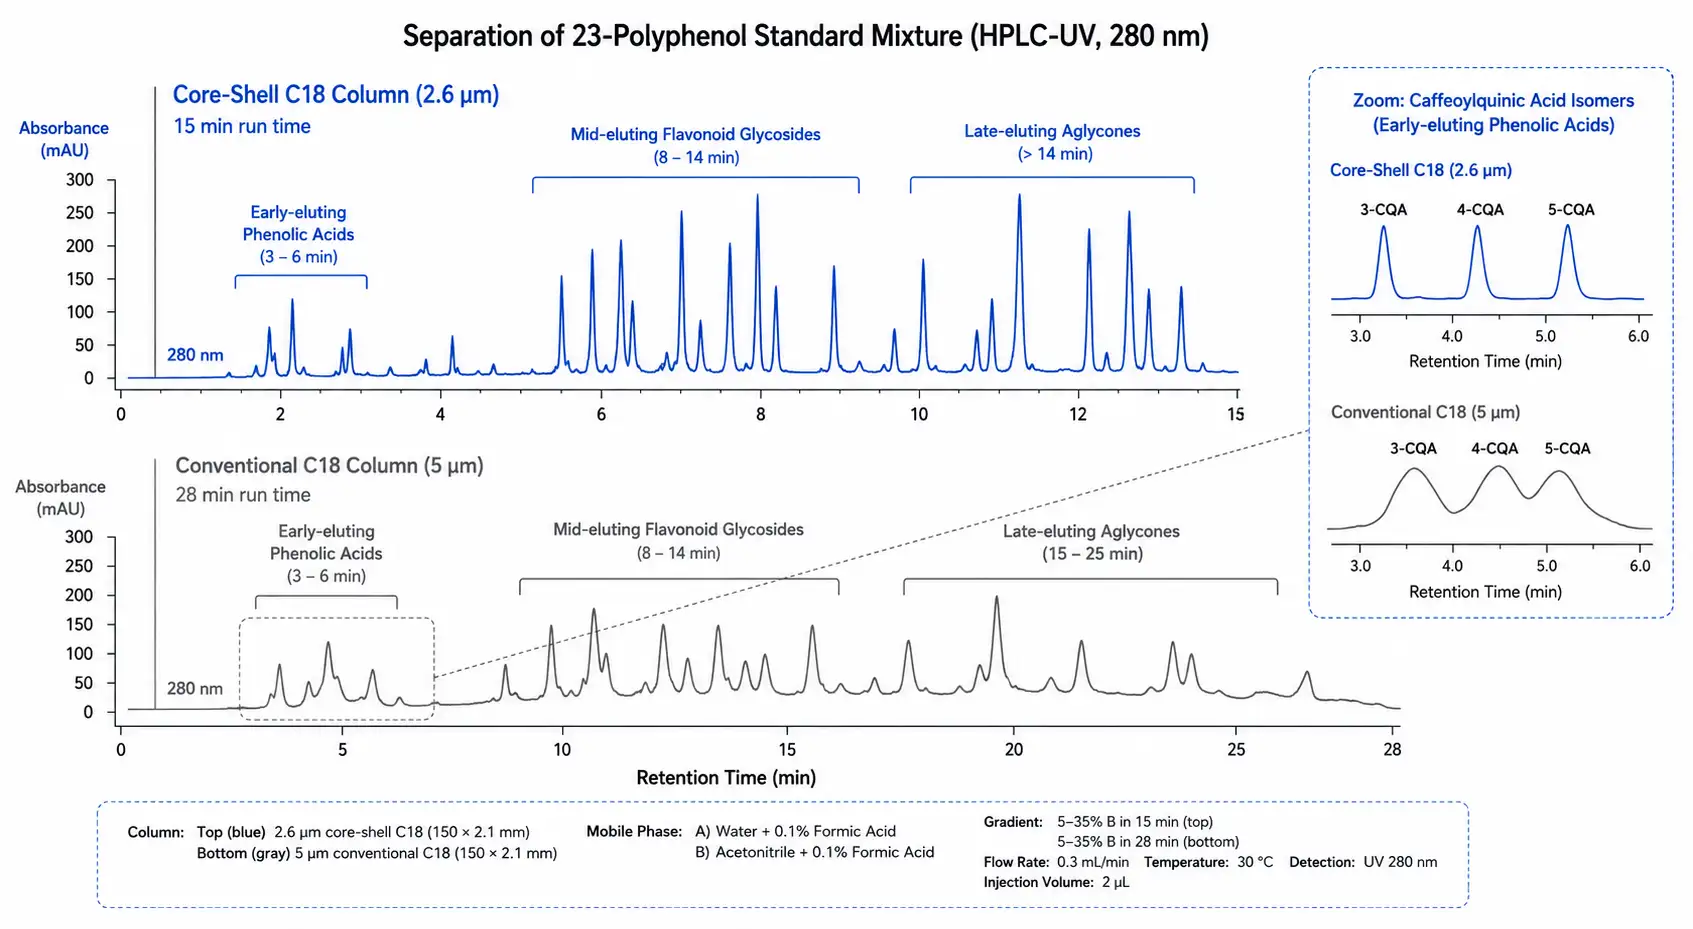 Overlaid UHPLC-UV chromatograms at 280 nm showing 23-polyphenol standard separation: core-shell column achieves baseline resolution in 15 minutes versus 28 minutes on conventional 5 um C18, with 40-50% time savings per injection.
LC-MS-Based Detection and Quantification
Mass spectrometry coupled to liquid chromatography provides the sensitivity and specificity required for polyphenol quantification in complex matrices, where UV detection alone is insufficient to resolve co-eluting compounds with similar chromophores.
Ionization Mode Selection
The choice between positive and negative electrospray ionization (ESI) is determined by the polyphenol subclass. Negative ion mode (ESI-) is the default for most polyphenols because phenolic hydroxyl groups readily lose a proton to form [M-H]- ions. Phenolic acids, flavonoid aglycones, and flavonoid glycosides all produce abundant [M-H]- ions with minimal in-source fragmentation under optimized conditions (capillary voltage -2.5 to -3.5 kV, desolvation temperature 350 deg C). Anthocyanins are the major exception: their flavylium cation structure carries a permanent positive charge, making ESI+ the mandatory mode. Delphinidin-3-O-glucoside [M]+ at m/z 465 and cyanidin-3-O-glucoside [M]+ at m/z 449 are detected at 10- to 50-fold higher sensitivity in ESI+ than ESI-. For multi-class polyphenol methods that include both anthocyanins and neutral polyphenols, polarity switching between positive and negative scans within a single injection is necessary, though this reduces the number of scans per chromatographic peak by approximately 30%.
Targeted Quantification by MRM and PRM
Multiple reaction monitoring (MRM) on triple quadrupole instruments remains the gold standard for targeted polyphenol quantification. Each analyte requires optimization of two transitions: a quantifier transition (the most abundant precursor-to-product ion pair) and a qualifier transition (a secondary product ion for identity confirmation). For flavonoid glycosides, the neutral loss of the glycosidic residue is the most characteristic fragmentation pathway: quercetin-3-O-glucoside (m/z 463 to 301, loss of 162 Da corresponding to glucosyl residue) and kaempferol-3-O-rutinoside (m/z 593 to 285, loss of 308 Da corresponding to rutinosyl residue). For phenolic acids, decarboxylation [M-H-CO2]- is the dominant fragmentation: caffeic acid m/z 179 to 135 (loss of 44 Da) and ferulic acid m/z 193 to 134 (loss of 59 Da). Typical MRM methods for polyphenol panels of 50-90 compounds achieve limits of quantification in the 0.1-10 ng/mL range, with linear dynamic ranges spanning three to four orders of magnitude. Parallel reaction monitoring (PRM) on Q-Orbitrap or Q-TOF platforms offers an alternative that captures the full product ion spectrum for each precursor, enabling retrospective re-verification of peak identity and detection of isobaric interferences that would go unnoticed in unit-resolution MRM. Polyphenol analysis services routinely deploy both MRM and PRM workflows depending on the required panel size and quantification precision.
Internal Standard Strategy
Stable isotope-labeled polyphenol internal standards are commercially available for fewer than 20 compounds, leaving the majority of polyphenol targets without a matched isotopologue for correction. The practical compromise is to group polyphenols by retention time window and assign the closest eluting SIL-IS to each group: for example, catechin-d2 corrects for early-eluting flavanols, genistein-d4 corrects for mid-eluting isoflavones, and quercetin-d3 corrects for late-eluting flavonols. Within each group, the SIL-IS corrects for injection volume variation and ionization suppression, but it cannot correct for extraction efficiency differences between chemically dissimilar polyphenols. A minimum of four-point matrix-matched calibration curves, prepared by spiking known concentrations of each target into the same biological matrix used for study samples, remain the most reliable approach for compensating matrix effects in quantitative polyphenol analysis.
Figure 4: MRM Transition Parameter Layout for Major Polyphenol Classes
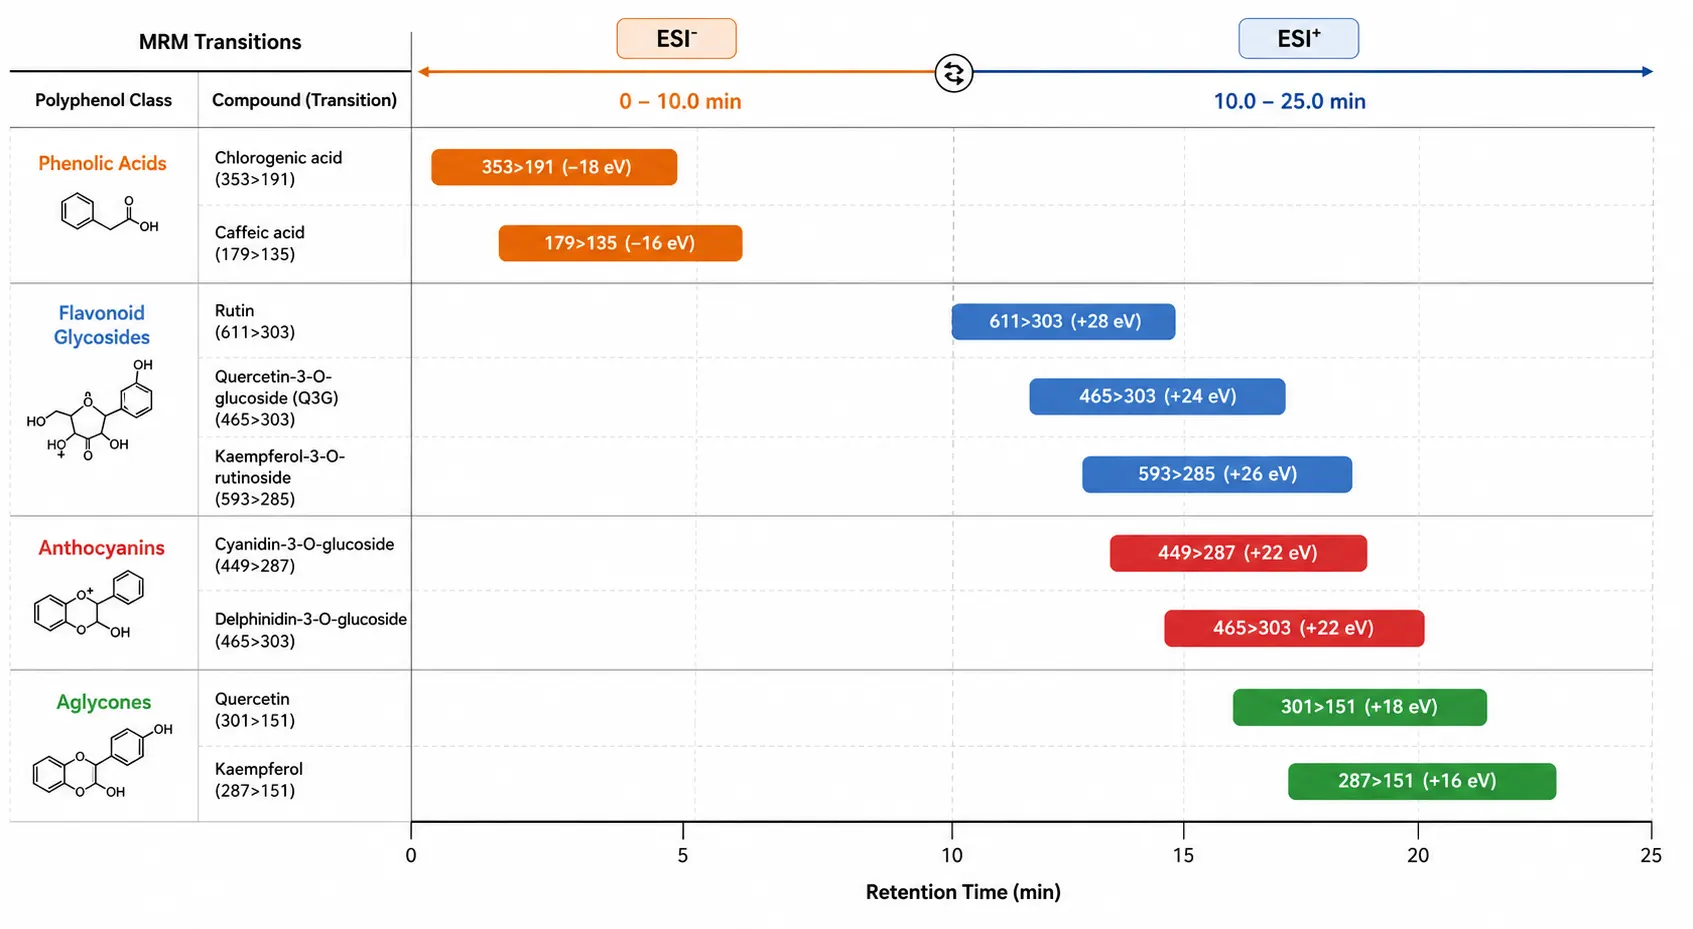 Schematic representation of precursor-to-product ion transitions, collision energies, and retention time windows for phenolic acids, flavonoids, and anthocyanins in a scheduled MRM method.
Advanced Techniques for Isomer Resolution and Spatial Mapping
The most significant recent advances in polyphenol analysis address two long-standing limitations: the inability to resolve isomeric polyphenols that co-elute chromatographically, and the loss of spatial information when polyphenols are extracted from bulk tissue.
Ion Mobility Spectrometry for Isomer Separation
Ion mobility spectrometry (IMS) separates gas-phase ions by their collision cross-section (CCS) before mass analysis, providing an orthogonal separation dimension that resolves isomers with identical m/z and similar retention times. The practical relevance for polyphenol analysis is substantial: quercetin-3-O-glucoside and quercetin-4'-O-glucoside differ in CCS by approximately 3-5% under nitrogen drift gas conditions, sufficient for baseline separation in a 100 ms IMS cycle. Similarly, cis-trans isomers of hydroxycinnamic acids (caffeic acid vs ferulic acid) and positional isomers of caffeoylquinic acids (3-CQA, 4-CQA, 5-CQA) are resolved by IMS under conditions where LC alone produces partial or no separation. The CCS value serves as a reproducible physicochemical descriptor that can be used to filter false-positive annotations in untargeted polyphenol profiling: a candidate identification whose measured CCS deviates by more than 2% from the database value for the proposed structure can be confidently rejected. Commercial polyphenol CCS databases covering over 500 compounds have been published, while larger resources such as the METLIN-CCS database (27,000+ compounds across 79 chemical classes) provide broader coverage that includes polyphenol subclasses and can be integrated into data analysis workflows for both targeted and untargeted studies.
Mass Spectrometry Imaging for Spatial Polyphenol Distribution
DESI-MSI and MALDI-MSI have been applied to map polyphenol distributions directly on plant tissue sections, revealing compartment-specific accumulation patterns that bulk extraction cannot detect. A 2024 study using DESI-MSI at 50 um spatial resolution demonstrated that anthocyanins accumulate predominantly in the epidermal cell layers of grape berry skins, while proanthocyanidins are concentrated in the hypodermal layers immediately beneath. This spatial segregation has implications for both food processing (skin-contact time in winemaking determines anthocyanin extraction efficiency) and plant physiology (different polyphenol classes serve distinct defensive roles in different tissue compartments. Spatial metabolomics services are increasingly incorporating MSI-based polyphenol analysis, though the application is currently limited by ionization efficiency differences across polyphenol classes; anthocyanins ionize readily in DESI due to their pre-formed charge, while non-charged flavonoids require optimized solvent composition (acetonitrile:water:formic acid, 80:19:1 v/v/v with 5 mM ammonium formate) to achieve adequate desorption efficiency.
Figure 5: Ion Mobility Drift Time Separation of Isomeric Flavonoid Glycosides
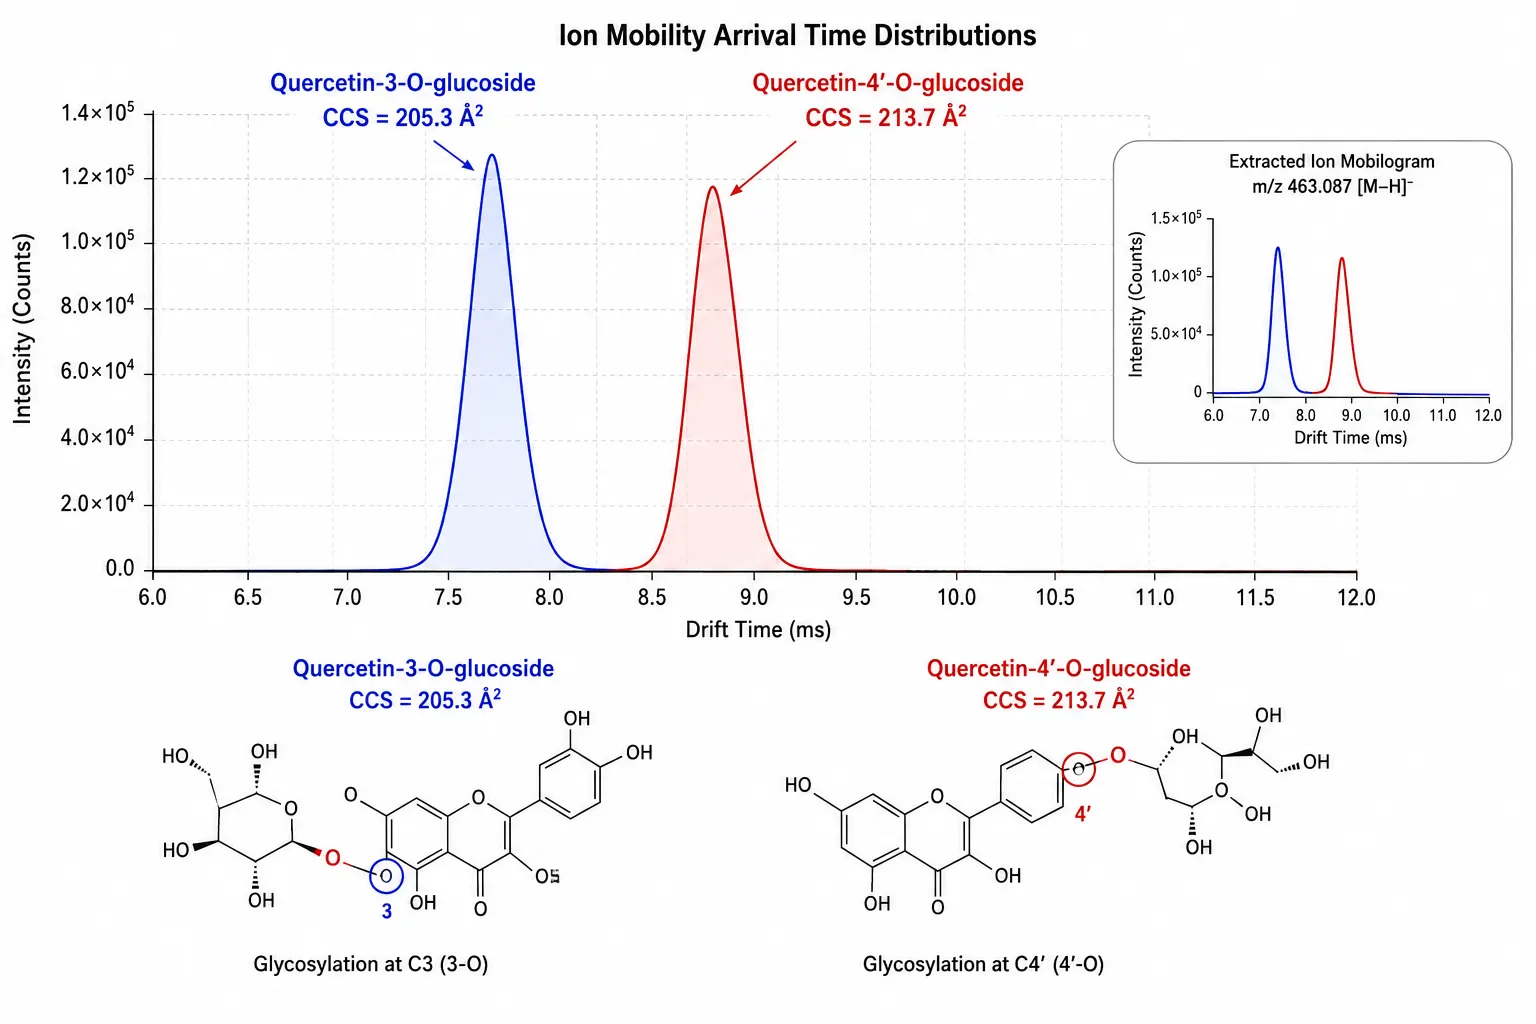 Arrival time distribution plot showing baseline separation of quercetin-3-O-glucoside and quercetin-4'-O-glucoside by IMS, with CCS values annotated for each isomer.
Method Validation and Quality Control
Reliable polyphenol quantification data depend on a method validation protocol that addresses the specific failure modes of polyphenol analysis, which differ from those of general small-molecule LC-MS methods.
Linearity, LLOQ, and Precision
Linearity should be evaluated across at least six concentration levels covering the expected concentration range of the study samples. For most polyphenol panels, a range of 0.5-500 ng/mL provides adequate coverage, and calibration curves fit to a linear regression with 1/x2 weighting achieve correlation coefficients (R2) above 0.99. The lower limit of quantification (LLOQ) is defined as the lowest concentration producing a signal-to-noise ratio of at least 10:1 with accuracy within +/- 20% of the nominal concentration and precision (RSD) below 20%. For anthocyanins in ESI+ mode, LLOQ values of 0.1-0.5 ng/mL are routinely achievable; for phenolic acids in ESI- mode, typical LLOQ values are 0.5-2 ng/mL.
Matrix Effect Assessment and Correction
Matrix effect assessment requires a post-column infusion experiment in which a standard polyphenol solution is infused directly into the mass spectrometer source while the extracted matrix sample is injected through the LC column. The resulting ion chromatogram reveals time-resolved regions of signal suppression or enhancement. For polyphenol analysis, the most severe matrix effects typically occur in the early part of the gradient (2-6 minutes), where polar matrix components elute and co-suppress phenolic acid ionization. If any polyphenol target elutes during a matrix effect window where signal suppression exceeds 25%, the method requires modification: either chromatographic adjustment to shift the target retention time, or adoption of a matrix-matched calibration strategy where standards are spiked into a surrogate matrix (e.g., charcoal-stripped plasma for biological fluid analysis).
Stability and Auto-Sampler Integrity
Polyphenol stability during the analytical sequence must be verified because auto-sampler degradation at room temperature is a documented source of bias. A stability assessment comparing freshly prepared standards with standards held in the auto-sampler at 10 deg C for 24 hours should demonstrate less than 10% change in peak area for all analytes. Polyphenols with catechol moieties (quercetin, catechin, epicatechin) are particularly susceptible to auto-sampler degradation and may require the addition of 1 mM ascorbic acid to the injection solvent to maintain stability over extended analytical batches of 100+ injections.
Figure 6: Polyphenol Research Application Framework: From Analytical Chemistry to Biological Insight
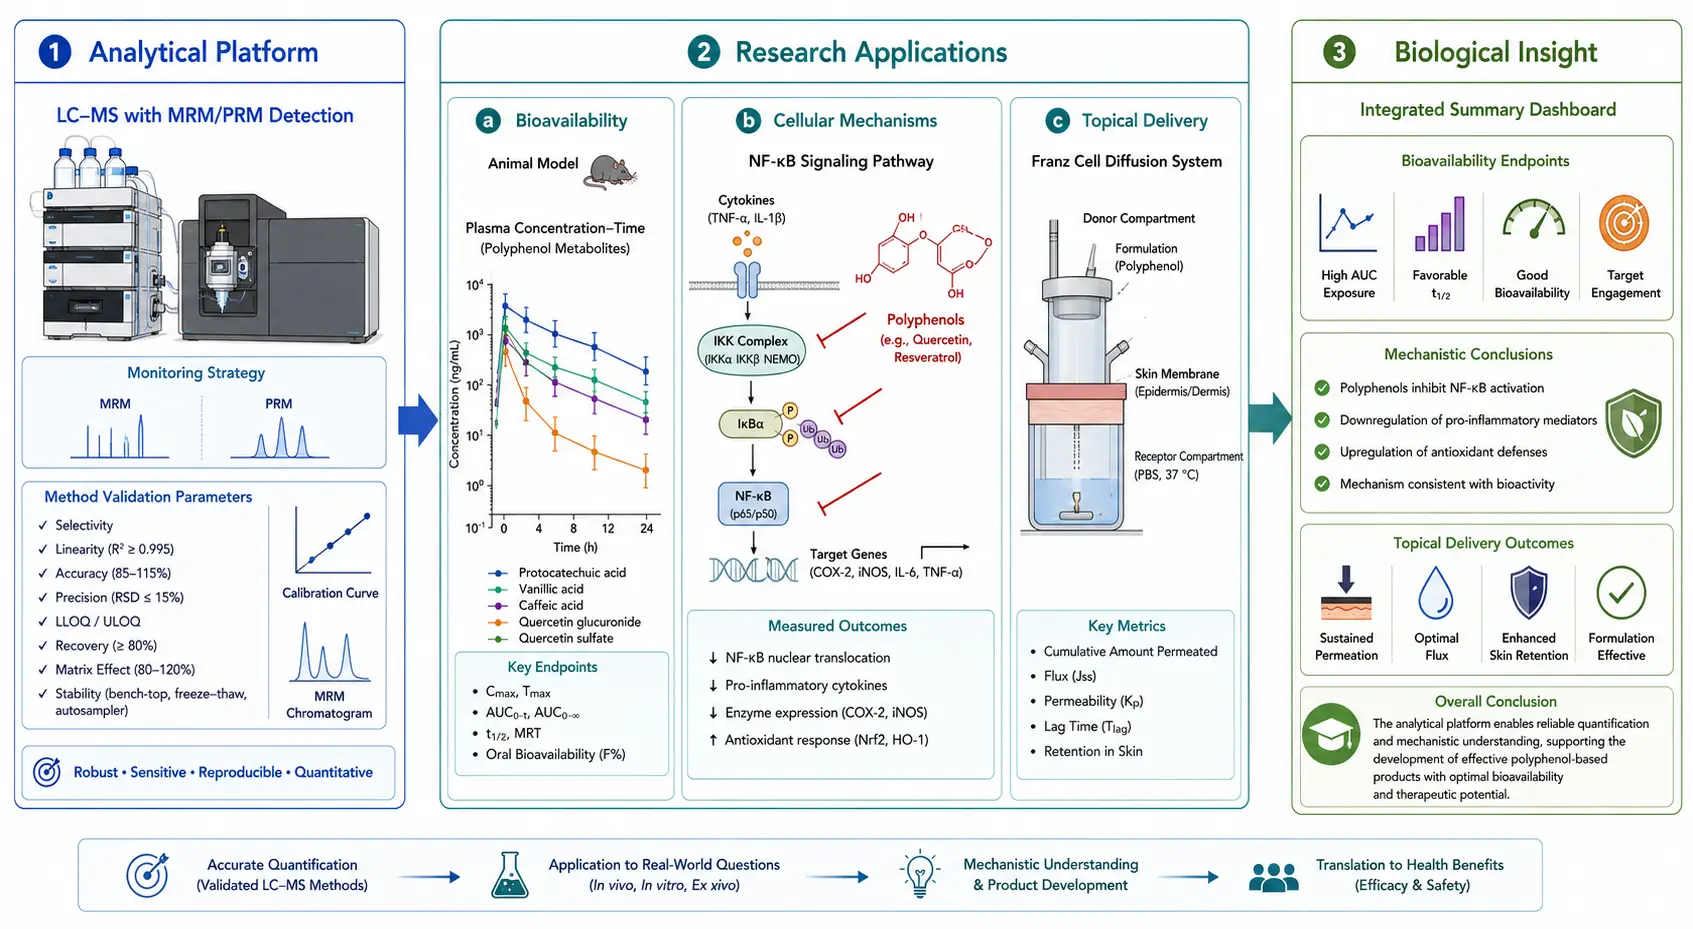 Integrated workflow connecting polyphenol analysis methodology with downstream research applications in bioavailability assessment, cellular mechanism studies, and biomarker discovery.
Applications in Biomedical and Nutraceutical Research
Polyphenol analysis provides the quantitative foundation for a wide range of research applications in nutritional biochemistry, pharmacology, and cosmetics science. Accurate analytical data are prerequisite for interpreting biological activity, bioavailability, and mechanism-of-action studies.
In cellular and animal model studies, polyphenols have been shown to modulate inflammatory signaling pathways, including NF-kB inhibition and Nrf2 activation, and to influence oxidative stress markers in controlled experimental settings. The standard approach involves treating cultured cells or animals with defined polyphenol doses, then measuring both the polyphenol concentration in the treatment medium and the appearance of phase II metabolites (glucuronide and sulfate conjugates) in the cell lysate or plasma over time. A critical experimental design consideration that is frequently overlooked is the spontaneous generation of hydrogen peroxide by polyphenols in cell culture media under standard incubation conditions (37 deg C, 5% CO2). Catechin and quercetin at concentrations above 50 uM generate H2O2 at rates sufficient to produce apparent "biological activity" that is entirely artifactual, caused by oxidative stress to the cells rather than by the polyphenol itself. Analytical verification that polyphenol concentrations in the culture medium remain stable over the incubation period, and that H2O2 scavengers (catalase, pyruvate) are included in control experiments, are essential quality checks that distinguish rigorous studies from confounded ones.
Bioavailability assessment relies on quantitative measurement of polyphenol metabolites in plasma and urine after oral administration in animal models. The time course of metabolite appearance reveals the site and kinetics of absorption: phenolic acids appear in plasma within 30-60 minutes of administration, indicating gastric or proximal small intestinal absorption; flavonoid glucuronides peak at 2-4 hours, consistent with distal small intestinal absorption and first-pass hepatic metabolism; and colonic metabolites (hydroxyphenylacetic acids, hydroxyphenylpropionic acids) appear at 6-12 hours, reflecting gut microbiota-mediated degradation. The total polyphenol metabolite concentration, measured after enzymatic deconjugation, is the relevant exposure metric for correlating polyphenol intake with biomarker endpoints in animal studies. Targeted metabolomics approaches provide the analytical precision needed for these pharmacokinetic-type measurements, particularly when combined with stable isotope-labeled polyphenol tracers to distinguish administered from endogenously derived metabolites.
In cosmetics and topical application research, polyphenol stability in formulation matrices (creams, serums, hydrogels) and skin permeation rates are the primary analytical questions. LC-MS quantification of polyphenol content before and after accelerated stability testing (40 deg C/75% relative humidity for 4 weeks) determines formulation shelf-life. Franz cell diffusion experiments, in which the polyphenol formulation is applied to excised skin and the receptor fluid is sampled over 24 hours, are quantified by LC-MS to calculate steady-state flux and permeability coefficients. For epigallocatechin-3-gallate (EGCG), the most studied polyphenol in topical formulations, these experiments have shown that only 0.1-0.5% of the applied dose penetrates the stratum corneum under standard conditions, highlighting the importance of formulation optimization for effective topical delivery. All applications described in this section are conducted within research model systems and are not intended for clinical or diagnostic use.
FAQ
What is the best solvent for polyphenol extraction from plant tissues?
Aqueous methanol or ethanol (50-80% v/v) acidified with 0.1-1% HCl or formic acid is the standard. The organic solvent solubilizes polyphenols from the cell wall matrix, while the acid stabilizes anthocyanins and inactivates polyphenol oxidase. Ultrasonication improves yield by 20-40%.
Why do some polyphenols require enzyme hydrolysis before analysis?
Polyphenols in biological fluids exist primarily as glucuronide and sulfate conjugates formed by phase II metabolism. Without hydrolysis by beta-glucuronidase/sulfatase, these conjugates are not detected by methods calibrated for free aglycones, underestimating total polyphenol content by 70-90%.
How do I choose between ESI+ and ESI- mode for different polyphenol classes?
Use ESI- for phenolic acids, flavonoid aglycones, and glycosides, which form abundant [M-H]- ions. Use ESI+ for anthocyanins, which carry a permanent positive charge as flavylium cations. Polarity switching within a single run can cover both classes but reduces the effective scan rate.
Can LC-IMS-MS distinguish isomeric polyphenols that co-elute on C18?
Yes. Flavonoid glycoside position isomers (e.g., quercetin-3-O-glucoside vs quercetin-4'-O-glucoside) differ in CCS by 3-5% under nitrogen drift gas, sufficient for baseline separation by IMS even when LC retention times are nearly identical.
What internal standards are recommended for targeted polyphenol quantification?
Stable isotope-labeled polyphenol standards are available for fewer than 20 compounds. The practical strategy assigns one SIL-IS per chromatographic retention time window (e.g., catechin-d2 for early eluates, genistein-d4 for mid eluates, quercetin-d3 for late eluates) to correct for ionization suppression within each time segment.
How do I assess and correct for matrix effects in polyphenol LC-MS analysis?
Post-column infusion of a polyphenol standard mixture during matrix injection reveals time-resolved suppression or enhancement zones. If signal suppression exceeds 25% for any target, shift its retention time chromatographically or adopt matrix-matched calibration using charcoal-stripped surrogate matrix.
References
- Lopez-Fernandez O, Dominguez-Lopez I, et al. Determination of Polyphenols Using Liquid Chromatography-Tandem Mass Spectrometry Technique (LC-MS/MS): A Review. Antioxidants. 2020;9(6):479. doi:10.3390/antiox9060479
- Rocchetti G, Ghisoni S, Lucini L. Advanced Analytical Approaches for the Analysis of Polyphenols in Complex Matrices. Separations. 2021;8(5):65. doi:10.3390/separations8050065
- Panzella L, Moccia F, Napolitano A. Polyphenols in Health and Food Processing: A Review of Biological Activities and Mechanisms. Front Nutr. 2024;11:1456730. doi:10.3389/fnut.2024.1456730
- Nieto JA, Santoyo S, Jaime L, et al. Non-Thermal Food Processing Technologies and Polyphenols: LC-MS Evidence. Foods. 2026;15(8):1383. doi:10.3390/foods15081383
- Egbeniyi TO, Dongsogo J, Bamidele TO, Aryee ANA. An Overview of Metabolomic Approaches to Polyphenol Profiling for Nutraceutical Development. Molecules. 2026;31(9):1468. doi:10.3390/molecules31091468


