

Every protein interaction mapping project begins with the same question: which method will actually capture the biology I care about? For researchers entering the interactomics space, the choice between conventional affinity purification-mass spectrometry (AP-MS) and proximity labeling (PL) — two approaches that address fundamentally different slices of the interactome — shapes every downstream decision, from construct design to data interpretation. AP-MS enriches stable protein complexes that survive cell lysis and stringent washing; PL captures a broader, time-resolved snapshot of the molecular neighborhood, including the transient and membrane-associated contacts that AP-MS routinely misses. Neither method is universally superior. The right choice depends on the biological question, the biochemical properties of the bait, the required temporal resolution, and the acceptable trade-off between specificity and breadth. This article provides a side-by-side technical comparison of the two paradigms across sensitivity, specificity, timeline, cost, and application context — with a practical decision framework to help you select and combine methods for maximum interactome coverage.
Two Paradigms for Interaction Discovery
Affinity Purification-Mass Spectrometry (AP-MS)
Conventional pull-down AP-MS operates on a bait-prey enrichment principle. A tagged bait protein is expressed in the chosen cell system, cells are lysed under native conditions, and the bait — along with any physically associated proteins — is captured on tag-specific affinity resin. After washing away unbound material, co-purified proteins are identified by LC-MS/MS. The core assumption is that proteins that remain associated through lysis, binding, and washing represent genuine interaction partners.
AP-MS has been the workhorse of interactome mapping for over two decades. Its strengths are well documented: high biochemical specificity for stable complex members, mature statistical frameworks (SAINT/SAINTexpress, CompPASS, MiST), and a well-characterized contaminant background via the CRAPome database. The method is supported by extensive commercial reagent availability — anti-FLAG M2 magnetic beads, Strep-Tactin resins, GFP-nanobody matrices — making it accessible to laboratories without dedicated protein chemistry expertise. For systematic interactome mapping, IP-MS protein interactomics solutions provide end-to-end workflows from bait design to network annotation.
Proximity Labeling (PL)
Proximity labeling inverts the AP-MS logic: instead of pulling down complexes post-lysis, PL covalently tags neighboring proteins in living cells before lysis occurs. The bait protein is fused to an engineered biotin ligase (BioID, TurboID, miniTurbo) or peroxidase (APEX2) that generates reactive biotin species. These reactive species diffuse outward and covalently attach biotin to lysine or tyrosine residues on proteins within a ~1-10 nm labeling radius. Because the biotin tag is covalent, it survives harsh denaturing lysis conditions (SDS, urea, RIPA buffer) that would dissociate non-covalent complexes in AP-MS. Biotinylated proteins are then enriched on streptavidin beads under denaturing conditions and identified by LC-MS/MS.
This pre-lysis covalent capture is the defining advantage of PL: it preserves interactions that exist at the moment of labeling, regardless of their biochemical stability. Transient enzyme-substrate contacts, weak regulatory interactions, membrane protein complexes, and insoluble scaffolding assemblies — all invisible to conventional pull-down — become detectable. For researchers interested in these challenging target classes, Creative Proteomics provides both BioID-MS and TurboID service options tailored to specific bait properties and labeling kinetics requirements.
Conventional Pull-Down (AP-MS): Strengths and Limitations
Strengths — High Specificity and Direct Evidence
AP-MS provides the most direct biochemical evidence of physical interaction: protein A and protein B are found in the same tube after affinity enrichment because they were part of the same complex in the cell lysate. When combined with quantitative MS strategies — label-free quantification (LFQ), TMT multiplexing, or SILAC metabolic labeling — AP-MS delivers precise fold-change measurements between bait and control conditions, enabling rigorous statistical discrimination of true interactors from background. The SAINT probabilistic framework, for instance, models spectral count distributions across bait and control replicates to assign a Bayesian false discovery rate (BFDR) to each candidate interactor, with BFDR ≤0.05 as a widely accepted threshold for high-confidence calls.
AP-MS also excels at defining complex stoichiometry. Because spectral counts or iBAQ intensities scale roughly with protein abundance within a purified complex, AP-MS data can distinguish core subunits (consistently high abundance across replicates) from peripheral or sub-stoichiometric interactors. This information is lost in PL, where labeling efficiency depends on the accessibility of surface lysine residues rather than complex stoichiometry.
For well-behaved cytoplasmic baits with known interaction partners, AP-MS remains the simplest, fastest, and most economical route to an interactome dataset. One confluent 10 cm dish of HEK293T cells (2-5 mg total protein) per replicate typically suffices. The full experimental timeline from transfection to MS data is approximately one week.
Weaknesses — The Lysis Problem and the Wash Trade-off
The central limitation of AP-MS is that every interaction must survive cell lysis and the subsequent wash steps. Lysis disrupts cellular compartmentalization, dilutes protein concentrations by orders of magnitude, and exposes complexes to non-physiological buffer conditions. Weak and transient interactions — enzyme-substrate contacts, signaling complexes, regulatory interactions with Kd values in the micromolar range — frequently dissociate during this transition and are lost.
The wash stringency trade-off compounds this problem. Reducing wash steps and lowering salt concentrations preserves weak interactions but increases non-specific background. Increasing stringency removes contaminants but strips genuine low-affinity interactors. There is no perfect wash condition that simultaneously maximizes sensitivity and specificity; each bait requires empirical optimization, and some interactors will inevitably be sacrificed at whichever stringency is chosen.
Membrane proteins present an additional challenge. Integral membrane proteins and membrane-associated complexes require detergents for solubilization, but detergents that effectively extract membrane proteins (Triton X-100, SDS) frequently disrupt the very protein-protein interactions the experiment aims to detect. Milder detergents (digitonin, DDM) preserve interactions better but solubilize membrane proteins less efficiently. For multi-pass transmembrane proteins and insoluble scaffolds, AP-MS often yields sparse interactomes dominated by known abundant contaminants rather than biologically meaningful partners.
Finally, AP-MS is constrained to the interactome of the cell population at harvest time. It cannot capture dynamic changes in the interaction landscape — a kinase's shifting substrate repertoire following growth factor stimulation, a transcription factor's differential co-regulator recruitment upon drug treatment — unless paired with rapid cross-linking or time-course sampling.
Proximity Labeling: The Evolution from BioID to TurboID
The BirA* Family — From Days to Minutes
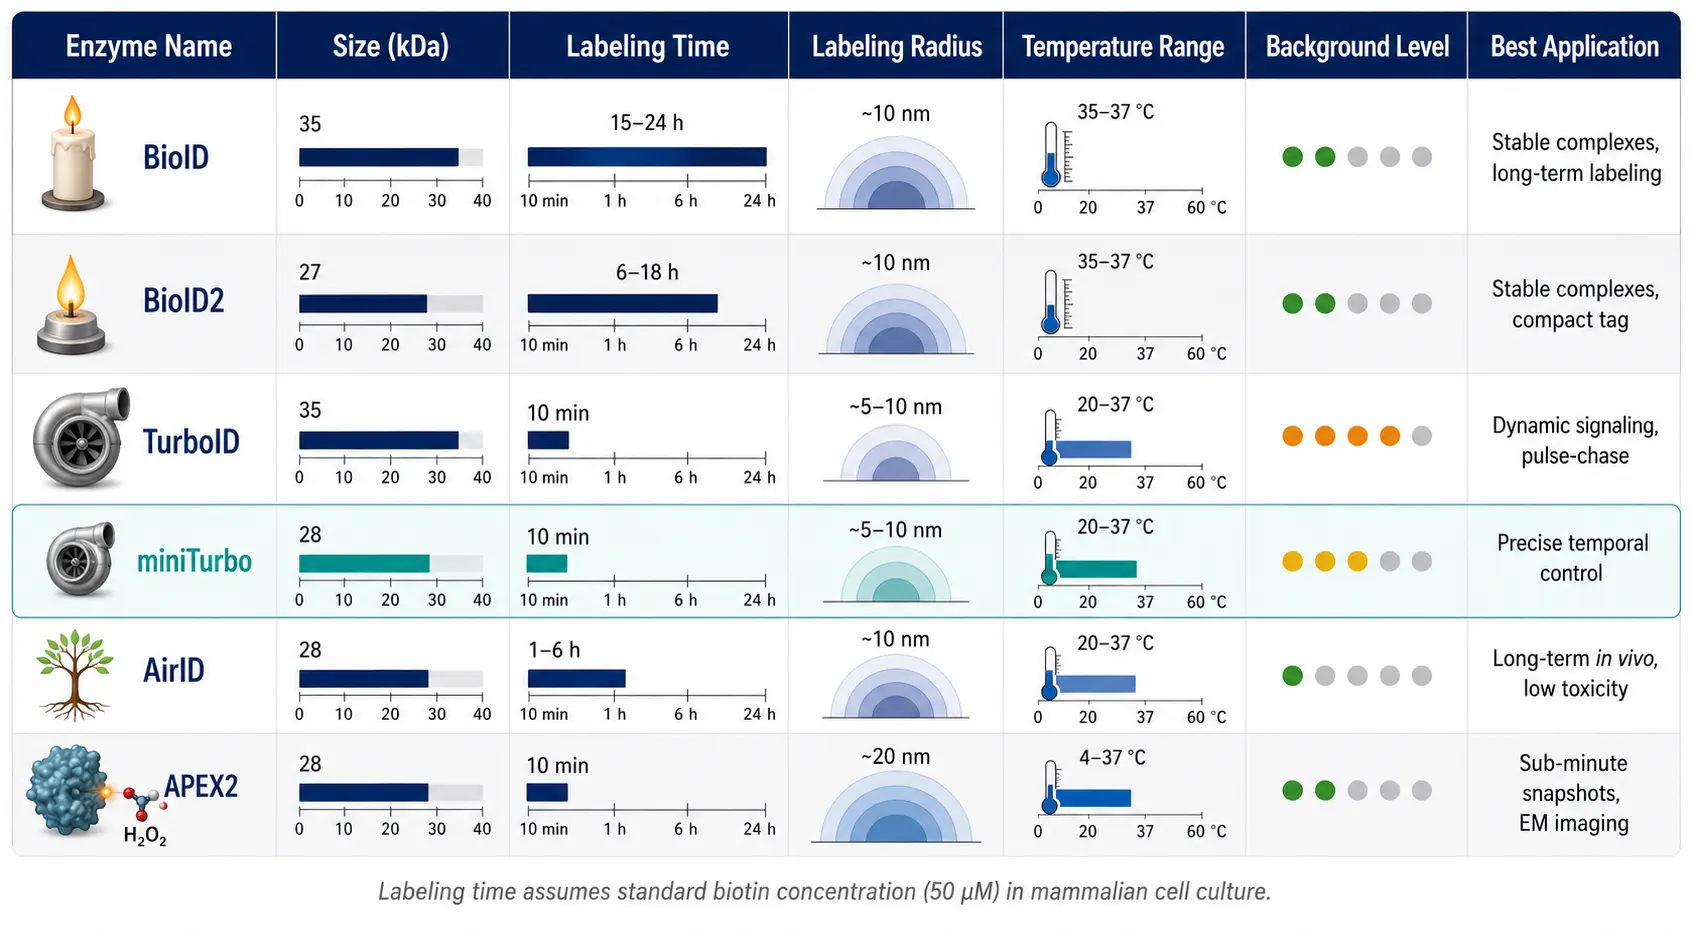
The proximity labeling revolution began in 2012 with BioID, an R118G mutant of the E. coli BirA biotin ligase. This single point mutation releases the activated biotinoyl-5'-AMP intermediate from the enzyme active site before it can react with the natural substrate, allowing it to diffuse outward and covalently modify lysine residues on any protein within a ~10 nm radius. The original BioID was transformative in concept but frustrating in practice: it required 15-24 hours of labeling to accumulate sufficient biotinylation signal, making it unsuitable for dynamic processes and restricting its use to cell lines that could tolerate prolonged biotin supplementation.
BioID2 (2015), derived from the thermophilic Aquifex aeolicus BirA, offered a smaller footprint (27 kDa vs 35 kDa) and slightly improved kinetics, but remained fundamentally a slow, cumulative labeler.
The game-changer arrived in 2018 with TurboID and miniTurbo, engineered from BirA through yeast display-based directed evolution. TurboID achieves ~100-fold faster labeling than BioID — 10 minutes of TurboID labeling produces comparable biotinylation to 18-24 hours of BioID. This dramatic acceleration unlocked entirely new experimental designs: pulse-chase labeling of dynamic signaling complexes, acute pharmacological manipulation followed by rapid interactome capture, and in vivo labeling in organisms where prolonged biotin exposure is toxic or impractical.
A critical distinction between TurboID and miniTurbo is background labeling. TurboID's extreme catalytic efficiency comes with a cost: it can utilize endogenous biotin present in cell culture media and serum, producing constitutive low-level labeling even before exogenous biotin is added. miniTurbo, with slightly lower catalytic activity, exhibits substantially reduced endogenous background and is preferred when precise temporal control — a sharp on/off boundary at the moment of biotin addition — is experimentally important. For experiments where background must be minimized, TurboID service includes protocol optimization to suppress endogenous biotin labeling through serum starvation or biotin-depleted media strategies.
Beyond BirA — APEX2, AirID, and Emerging Enzymes
APEX2, an engineered soybean ascorbate peroxidase, represents a fundamentally different catalytic mechanism. Rather than activating biotin, APEX2 oxidizes biotin-phenol to short-lived biotin-phenoxyl radicals (<1 ms half-life) upon addition of hydrogen peroxide. This provides sub-minute temporal resolution — the fastest of any PL enzyme — making APEX2 uniquely suited for capturing rapid signaling events. The trade-off is H2O2 cytotoxicity, which limits in vivo applications and can induce oxidative stress artifacts.
AirID, computationally reconstructed from ancestral BirA sequences, offers a middle-ground profile: faster than BioID (1-3 hours labeling) with lower background than TurboID. It is gaining traction for long-term in vivo experiments where sustained TurboID overexpression causes toxicity.
BmTyr, a bacterial tyrosinase introduced in 2024, generates reactive quinone species that label surface-exposed tyrosine residues in ≤10 minutes — comparable to TurboID in speed but with a distinct residue specificity that provides complementary coverage when combined with BirA-family enzymes.

Strengths — Transient, Membrane, and In Vivo Coverage
The covalent nature of PL biotinylation confers three transformative advantages over conventional pull-down.
Transient interaction capture. Enzyme-substrate pairs that associate for milliseconds to seconds — kinase-substrate contacts, ubiquitin ligase-target interactions, chaperone-client recognition — are captured and preserved by the covalent biotin tag. Lysis can be performed under fully denaturing conditions (2% SDS, 8 M urea) without losing biotinylated interactors, eliminating the dissociation problem that plagues AP-MS.
Membrane protein compatibility. Because labeling occurs in intact cells, membrane protein complexes are biotinylated in their native lipid environment. Subsequent solubilization — with whatever harsh detergents are required — does not disrupt already-formed biotin linkages. PL has become the method of choice for GPCR interactomes, ion channel auxiliary subunit mapping, and receptor tyrosine kinase signaling networks.
In vivo applicability. TurboID and miniTurbo function across a broad temperature range (20-37°C), enabling interactome mapping in model organisms where traditional AP-MS is challenging — Drosophila, C. elegans, zebrafish, Arabidopsis, and even intact mouse brain. Transgenic organisms expressing bait-TurboID fusions enable tissue-specific and developmental stage-specific interactome capture that would be impossible with post-lysis methods.
Weaknesses — Radius Ambiguity, Background, and Labeling Bias
PL's strengths come with inherent trade-offs that must be accounted for in experimental design and data interpretation.
Labeling radius ambiguity. The reactive biotin species diffuses from the enzyme active site, and its effective labeling radius is influenced by biotin concentration, labeling duration, and the local protein density of the subcellular compartment. A protein can be biotinylated because it physically interacts with the bait, because it resides in the same crowded subcellular neighborhood, or because it transiently passed within labeling distance. These "bystander" proteins are a distinct category of false positive unique to PL. Free enzyme controls — expressing the biotin ligase without a bait fusion — are essential but imperfect, as the free enzyme samples different subcellular localizations than the bait-fused enzyme.
Endogenous biotinylation background. Mammalian cells contain endogenous biotin-dependent carboxylases (acetyl-CoA carboxylase, pyruvate carboxylase, propionyl-CoA carboxylase, methylcrotonyl-CoA carboxylase) that are naturally biotinylated. These proteins appear in every streptavidin pull-down regardless of the PL enzyme and must be subtracted computationally. TurboID's constitutive background from endogenous biotin in culture media adds a second layer of non-specific signal. Both can be managed through proper control design — parallel processing of bait-expressing and control (free enzyme or untransfected) samples — and quantitative ratiometric analysis rather than binary hit calling.
Lysine accessibility bias. BirA-family enzymes biotinylate lysine residues, but not all lysines are equally accessible on folded protein surfaces. A genuine interactor with few solvent-exposed lysines in the labeling zone may escape biotinylation and be missed, creating false negatives. Peroxidase-based enzymes (APEX2, APEX-Seq) label tyrosine, tryptophan, cysteine, and histidine residues, providing complementary amino acid coverage.
Tag size. The BirA enzyme (35 kDa for TurboID) is substantially larger than epitope tags used in AP-MS (FLAG ~1 kDa). This can sterically perturb bait protein function, localization, or interaction interfaces. N-terminal vs C-terminal fusion placement must be empirically tested, and functional validation of the bait-TurboID fusion — localization, known activity, lack of toxicity — is mandatory before collecting large-scale PL datasets.
Head-to-Head Comparison Across Key Parameters
Sensitivity and Coverage
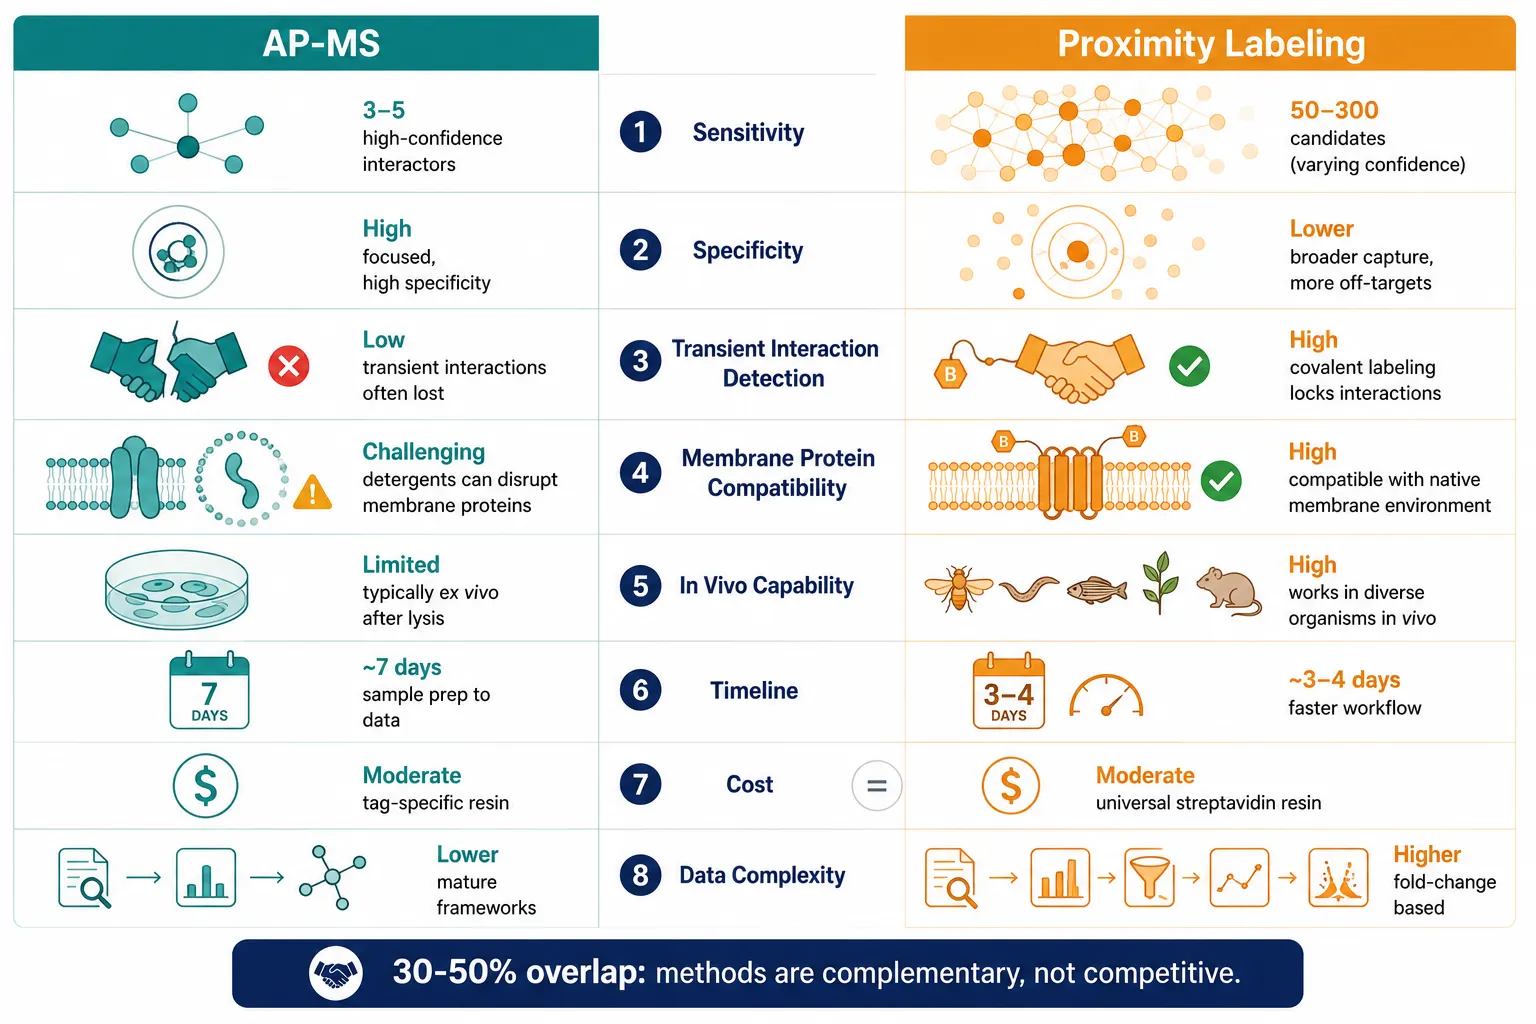
In direct comparative studies where the same bait was analyzed by both AP-MS and PL, the two methods produce substantially non-overlapping hit lists. AP-MS identifies a focused set of high-confidence stable complex members; PL identifies a broader set that includes the stable core plus numerous transient, weak, and proximal interactors. A typical overlap between the two datasets is 30-50%, with each method contributing unique interactors that the other misses entirely.
AP-MS sensitivity is limited by interaction stability and wash stringency. PL sensitivity is limited by the labeling radius, biotinylation kinetics, and lysine accessibility. Neither method captures the complete interactome of any bait protein. For maximum coverage, the methods are best deployed together rather than competitively.
Timeline and Throughput
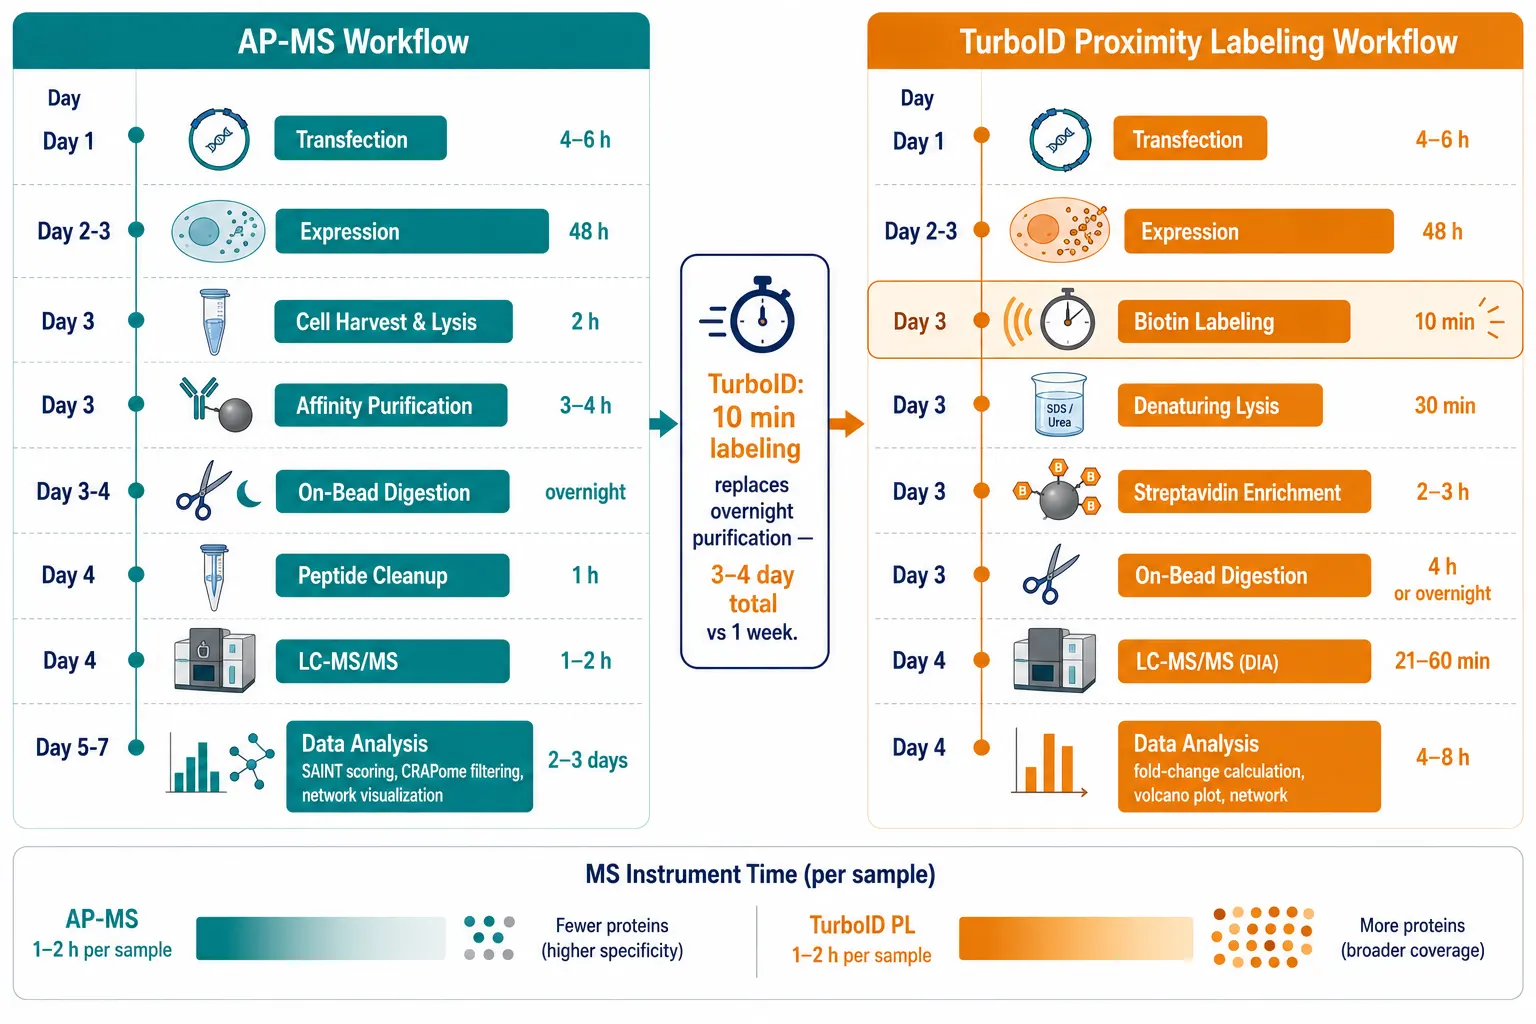
A standard AP-MS experiment — transfection, expression (48 h), lysis, affinity purification (3-4 h), on-bead digestion (overnight), and a 1-2 h LC-MS/MS run — can be completed in approximately one week for a single bait-control pair. With magnetic bead-based automation, throughput can reach 96 samples per batch.
PL adds a labeling step (10 min to 24 h, depending on the enzyme) but streamlines the purification: streptavidin-denaturing lysis followed by streptavidin enrichment is faster than tag-specific affinity purification with its multiple wash steps. Automated PL workflows published in 2024 process up to 96 samples in parallel on the Agilent Bravo platform, with LC gradients as short as 21 minutes per sample using DIA acquisition. The total timeline from labeling to data for a TurboID experiment can be as short as 3-4 days.
Cost Comparison
AP-MS requires bait-specific affinity resin (anti-FLAG magnetic beads: ~$300-500/mL; Strep-Tactin resin: ~$200-400/mL), which is consumed per experiment but can be re-used for the same bait across replicates. PL requires streptavidin resin (~$200-400/mL), which is universal — the same reagent works for any bait fusion — but is consumed at higher volumes per sample due to the larger number of biotinylated proteins captured. The enzyme construct itself (cloning, expression vector) represents a one-time cost for AP-MS but a per-experiment cost for PL, as the bait-ligase fusion must be generated and validated.
Reagent costs for a single bait-control pair are comparable between the methods at the scale of a typical laboratory experiment (~$200-500 in consumables). The larger cost differentiator is MS instrument time: PL samples are typically more complex (more proteins per sample) and may require longer gradients or fractionation for deep coverage.
Data Complexity and Interpretation Burden
AP-MS data analysis follows well-established pipelines: database search (MaxQuant, Proteome Discoverer, Spectronaut) to label-free quantification to SAINT/SAINTexpress scoring to CRAPome filtering to network visualization (Cytoscape). The contaminant background is well-characterized, and the statistical frameworks are mature.
PL data analysis adds complexity. The CRAPome, designed for AP-MS, does not directly apply to PL because the background profile of streptavidin pull-downs (endogenous carboxylases, ribosomal proteins, highly abundant metabolic enzymes) differs from that of affinity tag purifications. A dedicated PL background database — analogous to CRAPome for AP-MS — is under development but not yet mature. Hit calling in PL typically relies on fold-change over control (bait-TurboID vs free TurboID, or +biotin vs -biotin) rather than probabilistic frameworks. SAINT and SAINTexpress can be applied to PL spectral count data but were developed for and validated on AP-MS datasets; their statistical behavior with PL data has not been rigorously characterized.
For researchers without dedicated bioinformatics support, bioinformatics for proteomics provides PL-specific data analysis including background subtraction, fold-change-based hit calling, and network visualization.
Decision Framework — Choosing Between AP-MS and Proximity Labeling
Use AP-MS When...
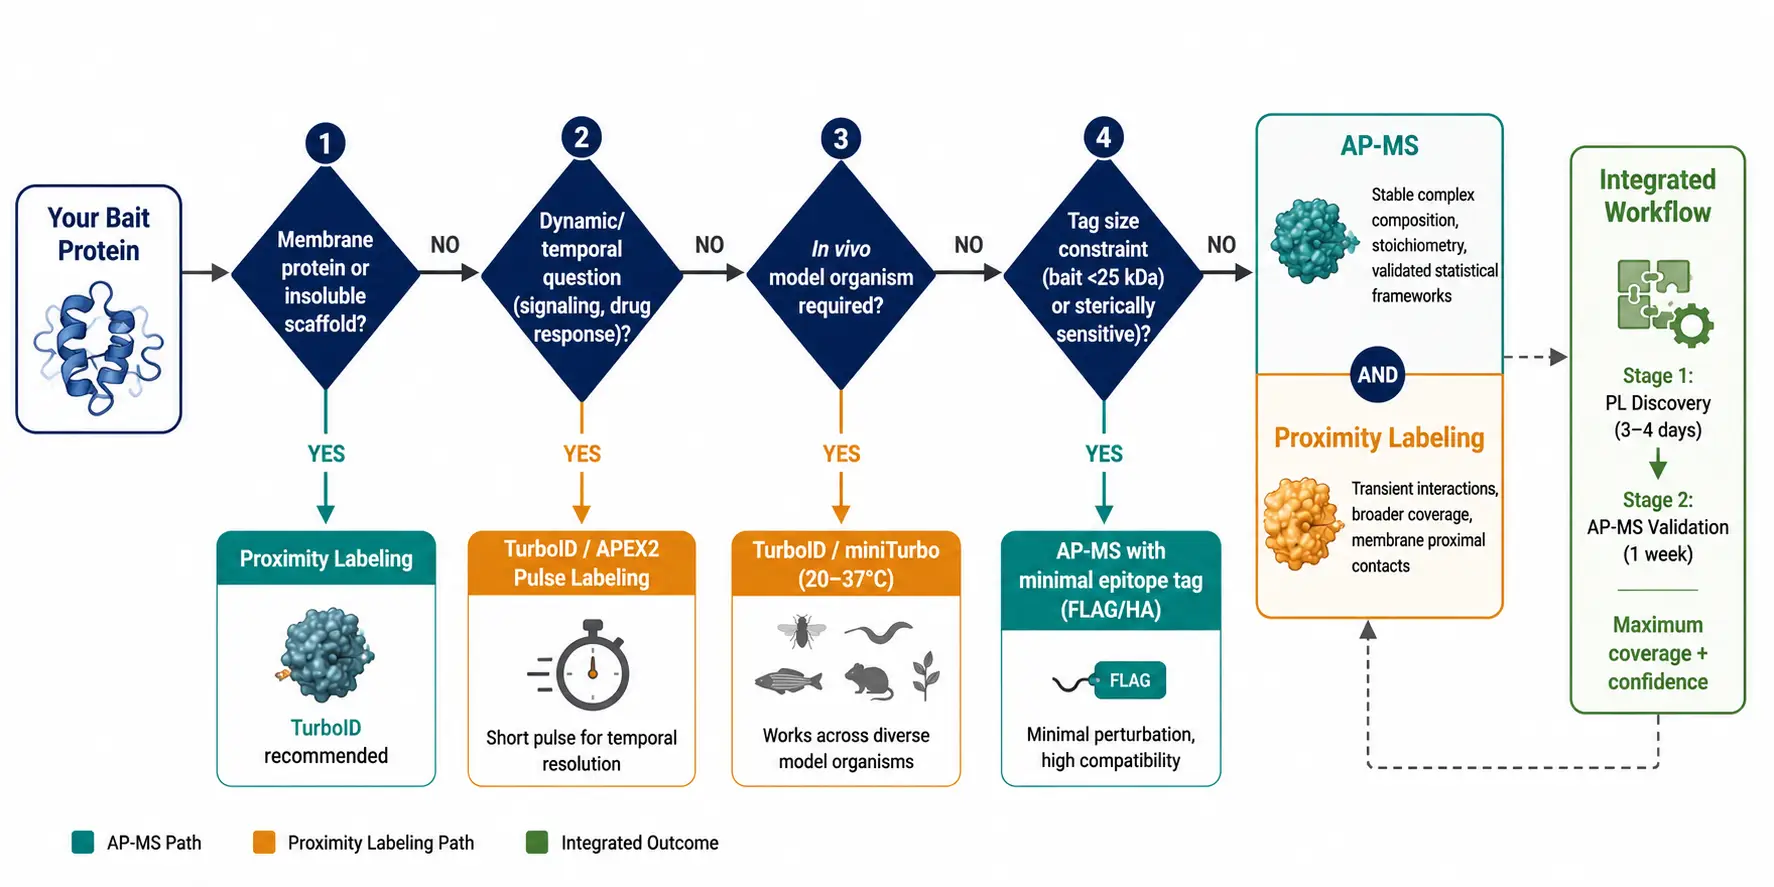
Your bait is a cytoplasmic or nuclear protein with known stable interaction partners, and you need high-confidence complex composition with minimal false positives. AP-MS is the right choice when specificity and biochemical rigor take priority over breadth: defining the subunit composition of a characterized complex, validating candidate interactions from a prior screen, or comparing complex composition between conditions with precise quantitative ratios.
AP-MS is also preferred when the tagged bait construct cannot tolerate a large fusion partner. The ~1 kDa FLAG tag is sterically negligible for most proteins; the 35 kDa TurboID is not. For small proteins, proteins with tight structural constraints, or proteins where even modest overexpression causes toxicity, AP-MS with a minimal epitope tag is the safer starting point.
Use Proximity Labeling When...
Your bait is a membrane protein, an insoluble scaffold, or a component of a large supramolecular assembly that resists native solubilization. PL is the method of choice for GPCRs, ion channels, receptor tyrosine kinases, nuclear pore components, centrosomal proteins, and extracellular matrix assemblies.
Your biological question involves dynamics: how does the interaction landscape change upon stimulation, drug treatment, cell cycle progression, or differentiation? TurboID's 10-minute labeling window enables pulse-chase experimental designs impossible with AP-MS.
Your experimental system requires in vivo labeling: Drosophila, C. elegans, zebrafish, mouse brain, or plant tissue. PL is the only viable option for these model systems; AP-MS from tissue lysates is technically feasible but plagued by post-lysis artifacts.
Use Both When...
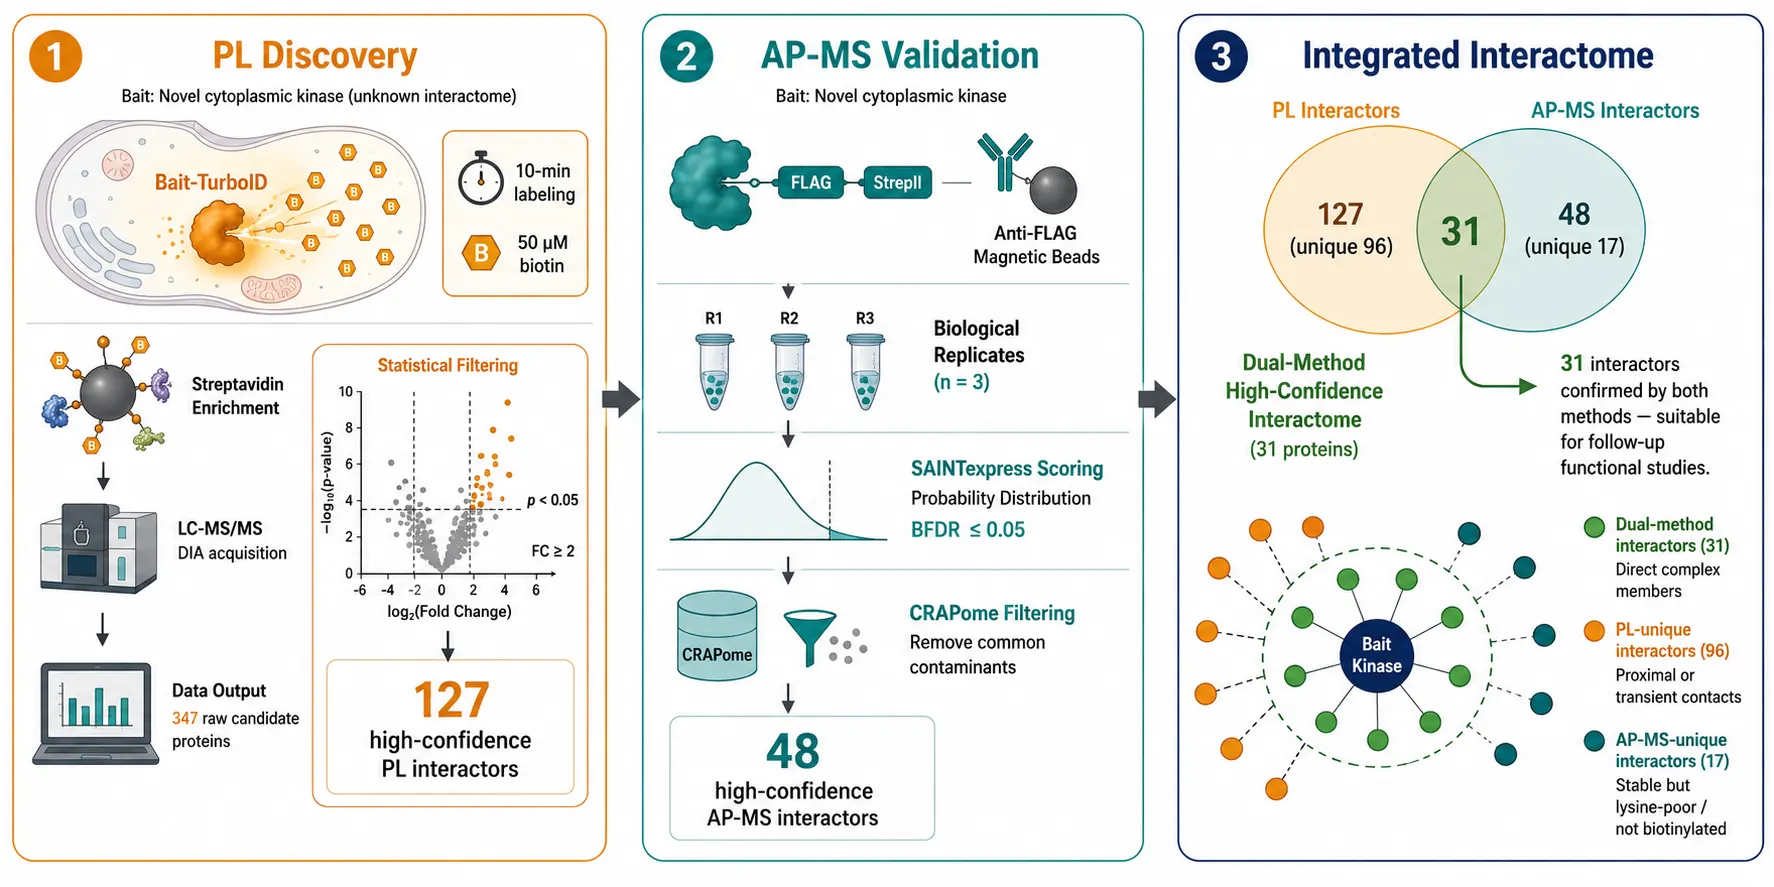
The most comprehensive interactome studies published in 2024-2025 increasingly deploy both methods on the same bait. A typical dual-method strategy uses PL for discovery — casting a wide net to capture the full interaction neighborhood including transient and membrane-proximal contacts — followed by AP-MS for validation and architectural dissection of the stable core complex. For critical projects such as drug target deconvolution or disease mechanism studies, the dual-method approach provides orthogonal evidence of interaction that strengthens confidence in both datasets. When the two methods converge on the same interactors, those hits carry substantially higher confidence than either method alone. When they diverge, the differences are biologically informative rather than simply noise: PL-unique hits suggest proximity-based or transient contacts; AP-MS-unique hits suggest stable interactions with limited surface lysine accessibility.
For teams evaluating this integrated approach, IP-MS protein interactomics solutions offer combined PL plus AP-MS workflows with unified data analysis and cross-method interaction scoring.
Complementary Workflows — PL for Discovery, AP-MS for Validation
A practical integrated strategy for a new bait protein proceeds in three stages. Stage one — PL discovery — expresses the bait as a TurboID or miniTurbo fusion, performs a pilot experiment with 10-minute biotin labeling, and identifies the broad interaction neighborhood. This stage requires 3-4 days and produces 100-500 candidate interactors after background subtraction.
Stage two — AP-MS validation — transfers the validated bait construct into an AP-MS expression system with a FLAG-StrepII tandem tag. The high-confidence stable interactors from the PL dataset are confirmed by AP-MS, which additionally provides stoichiometric information and distinguishes direct complex members from neighborhood proteins that were biotinylated in trans. This stage requires approximately one week for a single bait-control pair.
Stage three — dynamic interrogation — applies the method best suited to the specific biological perturbation. For rapid signaling events (seconds to minutes), APEX2 or TurboID pulse labeling captures the acute interactome response. For sustained changes (hours to days), comparative AP-MS with TMT multiplexing provides precise quantification across multiple time points or treatment conditions. TMT-based proteomics supports multiplexed experimental designs for cross-condition interactome comparisons.
This staged approach maximizes information return per unit of experimental effort. The PL stage rapidly surveys the interaction landscape, flagging the most biologically interesting candidates for deeper investigation. The AP-MS stage then provides the biochemical detail and statistical rigor needed for publication and follow-up functional studies.
Data Analysis for Proximity Labeling Proteomics
Background Subtraction and Control Design
The most critical analytical decision in PL proteomics is control selection. Three control strategies, in order of increasing rigor, are commonly used.
The no-biotin control processes bait-TurboID-expressing cells without exogenous biotin. This subtracts endogenous biotinylation background (endogenous carboxylases, TurboID constitutive activity) but does NOT account for bait-specific non-specific biotinylation.
The free enzyme control expresses the biotin ligase (TurboID, miniTurbo, or BirA*) without a bait fusion, ideally targeted to the same subcellular compartment as the bait fusion via a localization signal. This subtracts both endogenous biotinylation and ligase-specific promiscuous labeling, but the free enzyme may sample a different local proteome than the bait-fused enzyme.
The unrelated bait control fuses TurboID to a protein not expected to interact with the bait's pathway (e.g., GFP-TurboID for a nuclear bait). This provides the closest match to the bait's labeling environment but requires an additional construct and validation.
For publication-grade PL data, the combination of a free enzyme control and biological triplicates with quantitative ratiometric analysis (fold-change bait/control ≥ 2) is the current community standard. Bioinformatics for proteomics supports PL-specific hit calling with multiple control strategies and integrated CRAPome-aware filtering.
Quantitative Strategies — LFQ, SILAC, and TMT
Label-free quantification (LFQ) using spectral counting or MS1 intensity (MaxQuant iBAQ, Spectronaut) is the simplest and most widely used approach for PL data. LFQ works well for binary comparisons (bait vs control) but suffers from missing values across replicates, particularly for low-abundance interactors near the detection limit. Data-independent acquisition (DIA) mitigates this problem and is increasingly preferred for PL-LFQ; DIA quantitative proteomics provides a robust acquisition framework for PL interactome studies.
SILAC metabolic labeling provides the highest quantitative accuracy for two- or three-condition comparisons by mixing heavy and light labeled samples at the cell level, before any processing steps. This eliminates all downstream handling variability. However, SILAC requires cells to be cultured in specialized media and is incompatible with tissue or in vivo samples. SILAC-based proteomics analysis is available for applications demanding the highest quantitative precision.
TMT multiplexing enables simultaneous quantification of up to 18 samples — ideal for PL experiments comparing multiple conditions, time points, or drug doses. TMT eliminates run-to-run variability and provides precise relative quantification, but adds reagent cost and an additional sample processing step. TMT-based proteomics offers multiplexed quantification workflows for PL experimental designs.
Hit Calling and Network Visualization
Unlike AP-MS, which benefits from mature statistical frameworks (SAINT, CompPASS, MiST), PL hit calling remains primarily fold-change-based. The standard workflow quantifies protein abundance (spectral counts or MS1 intensity) in bait and control samples, calculates fold-change, and applies dual thresholds: fold-change ≥ 2 (or ≥ 3 for stringent calling) AND presence in ≥ 2 of 3 biological replicates. Proteins meeting both criteria are designated high-confidence interactors.
Volcano plots — log2(fold-change) vs -log10(p-value) from a two-sample t-test across replicates — provide a visual framework for hit prioritization that combines effect size and statistical significance. Proteins in the upper-right quadrant (high fold-change, low p-value) represent the highest-confidence candidates.
For network visualization and functional enrichment, the same tools used in AP-MS apply: Cytoscape for network rendering, STRING for interaction database integration, and clusterProfiler or DAVID for GO term and pathway enrichment. The critical difference is interpretation: PL networks represent proximity neighborhoods rather than direct physical contacts. A PL-derived interaction between protein A (bait) and protein B may be direct, mediated by a bridging protein C, or simply reflect co-localization within a crowded subcellular compartment. This distinction must be explicitly communicated when reporting PL-derived interaction networks.
FAQ
Q: Can I use proximity labeling if my protein of interest is very small (under 15 kDa)?
A: Steric perturbation is a legitimate concern. The TurboID enzyme is 35 kDa — fusing it to a 10 kDa bait creates a chimeric protein where the tag dominates. Test both N- and C-terminal fusions, validate localization and function, and consider using miniTurbo (28 kDa) with a flexible linker. If functional validation fails, AP-MS with a minimal FLAG tag may be the safer alternative.
Q: How do I know whether a PL hit is a direct interactor or a bystander?
A: A single PL experiment cannot distinguish direct from proximal. Orthogonal validation is required: co-IP/western blot for direct binding, cross-linking MS for residue-level proximity evidence, or AlphaFold-Multimer structural prediction to assess whether a direct interaction interface is sterically plausible. Hits confirmed by both PL and AP-MS are more likely to be direct complex members.
Q: Does the biotin supplement in standard cell culture media interfere with PL experiments?
A: Yes. Standard DMEM and RPMI contain biotin at concentrations (~1-10 μM in supplemented media with serum) sufficient to support low-level TurboID labeling before exogenous biotin is added. For maximum temporal control, use biotin-depleted serum or serum-free media during the pre-labeling period, then add exogenous biotin (50 μM for TurboID, 50 μM for BioID) to initiate labeling.
Q: How many biological replicates do I need for a PL experiment?
A: Three biological replicates per condition is the current standard for label-free PL experiments, matching AP-MS norms. For TMT-multiplexed experiments, two replicates may suffice due to the elimination of run-to-run variability, but three is still preferred for capturing biological variation in complex assembly and cell state.
Q: Can PL replace Co-IP for validating individual interactions?
A: No. PL (like AP-MS) is a discovery method — its strength is breadth, not binary validation. For confirming a specific candidate interaction, reciprocal co-IP/western blot remains the gold standard. PL can be used to map the full neighborhood of a validated interaction partner, but it is not a substitute for direct binding assays.
Q: Is APEX2 or TurboID better for studying subcellular organelle proteomes?
A: It depends on the organelle and the experimental goal. APEX2 provides the highest spatial precision (~20 nm radius) and has been extensively validated for mitochondrial matrix, mitochondrial intermembrane space, ER lumen, and ER membrane proteomes. TurboID provides higher labeling efficiency (more proteins identified) with a slightly broader radius. For well-characterized organelles, APEX2 offers cleaner spatial resolution. For discovering novel organelle-proximal networks, TurboID's broader coverage may be advantageous.
Q: How do I handle endogenous biotinylated proteins in my PL dataset?
A: Endogenous biotin-dependent carboxylases (acetyl-CoA carboxylase, pyruvate carboxylase, propionyl-CoA carboxylase, methylcrotonyl-CoA carboxylase) appear in every streptavidin pull-down and must be computationally removed from candidate interactor lists. These proteins are well documented and can be filtered by accession number. More broadly, any protein detected at comparable abundance in both bait and free enzyme control samples should be treated as background rather than a candidate interactor, regardless of its absolute spectral count.
*For research use only.
References:
- Rahmati S, Emili A. Proximity Labeling: Precise Proteomics Technology for Mapping Receptor Protein Neighborhoods at the Cancer Cell Surface. Cancers. 2025;17(2):179. doi: 10.3390/cancers17020179 (CC BY 4.0)
- Rich JA, Gurung S, Coates-Park S, et al. Protocol to study secretome interactions using extracellular proximity labeling. STAR Protocols. 2024;5(4):103509. doi: 10.1016/j.xpro.2024.103509 (CC BY 4.0)
- Pfannenstein J, Tyryshkin M, Gulden ME, Doud EH, Mosley AL, Reese JC. Characterization of BioID tagging systems in budding yeast and exploring the interactome of the Ccr4-Not complex. G3: Genes|Genomes|Genetics. 2024;14(11):jkae221. doi: 10.1093/g3journal/jkae221 (CC BY 4.0)
- Lin Y-C, Rahmat M, Shyh-Chang N, et al. Construction of a proximity labeling vector to identify protein-protein interactions in human stem cells. PLoS One. 2025;20(5):e0324779. doi: 10.1371/journal.pone.0324779 (CC BY 4.0)
- Pirayeshfard L, Luo S, Githaka JM, et al. Comparing the BAD protein interactomes in 2D and 3D cell culture using proximity labeling. Journal of Proteome Research. 2024;23(8):3433-3443. doi: 10.1021/acs.jproteome.4c00111 (CC BY 4.0)
















