

Proteins rarely function alone. From signal transduction cascades to transcriptional regulatory complexes, virtually every biological process depends on physical interactions between proteins. Identifying these interaction partners — the "interactome" of a given bait protein — is fundamental to understanding gene function, disease mechanisms, and drug target biology. Among the available methods, Affinity Purification coupled with Mass Spectrometry (AP-MS) has emerged as the most broadly adopted approach for unbiased, proteome-wide interaction mapping. Unlike yeast two-hybrid (Y2H) assays that detect binary interactions in an artificial nuclear context, AP-MS captures native co-complex associations directly from the physiological environment of the cell or tissue of interest. This article walks through the complete AP-MS pipeline, from bait design and affinity tag selection through purification optimization and MS acquisition strategy to statistical scoring and biological interpretation — with practical decision frameworks for researchers planning their first or next interactome experiment.
What Is AP-MS?
AP-MS combines two established techniques — affinity purification of a tagged protein and high-resolution mass spectrometry — to identify the set of proteins that physically associate with a bait protein of interest. The core principle is straightforward: a bait protein is expressed with an engineered affinity tag (such as FLAG, HA, StrepII, or GFP), captured from cell lysate along with its interacting partners using tag-specific resin or beads, and the co-purified proteins are identified and quantified by LC-MS/MS.
The technique detects stable protein complexes — those that survive the lysis and wash steps of the purification — and can achieve proteome-wide coverage when coupled with a modern high-resolution mass spectrometer. A single AP-MS experiment can identify dozens to hundreds of candidate interactors, though the challenge lies in distinguishing bona fide interactions from non-specific background binders. This is where rigorous control design, quantitative MS strategies, and statistical scoring become essential.
The AP-MS workflow is distinct from proximity labeling methods such as BioID or TurboID, which use an engineered biotin ligase fused to the bait to biotinylate neighboring proteins in living cells. While proximity labeling excels at capturing transient and weak interactions that may not survive cell lysis, AP-MS offers higher specificity for stable co-complex members and avoids the potential for labeling-induced artifacts. The choice between these methods depends on the biological question: AP-MS for stable complex characterization, proximity labeling for transient or proximity-based interaction mapping. For laboratories evaluating which interaction mapping strategy best suits their biological question, both AP-MS and proximity labeling approaches can be tailored to specific bait classes and throughput requirements — and selecting the right starting conditions often benefits from pre-existing protocol optimization frameworks.
From Bait to Network: The AP-MS Workflow
A complete AP-MS experiment proceeds through six interconnected stages, where decisions made upstream cascade through every subsequent step.

The workflow begins with bait design — selecting an affinity tag and determining whether to express the tagged bait exogenously (transient or stable transfection) or endogenously (CRISPR-mediated knock-in). The tagged bait is expressed in the chosen cell line, and cells are lysed under native conditions optimized for the bait's subcellular localization. The lysate is incubated with tag-specific affinity resin; magnetic beads or agarose/sepharose are both common choices. After washing to remove non-specifically bound proteins, the retained protein complexes are eluted — either competitively (e.g., 3xFLAG peptide elution), by pH shift, or bypassed entirely by on-bead proteolytic digestion. Digested peptides are analyzed by LC-MS/MS, yielding raw spectra that are searched against a protein sequence database. The resulting protein identifications and quantitative data are then processed through statistical scoring algorithms (SAINT, MiST, CompPASS) to assign confidence scores, with CRAPome-informed filtering to subtract common contaminants. High-confidence interactors are visualized as interaction networks and subjected to functional enrichment analysis. For researchers planning systematic interactome studies, IP-MS protein interactomics solutions provide end-to-end support from bait design to network annotation.
Bait Design: The Foundation of a Successful AP-MS Experiment
Bait design is the single most consequential decision in an AP-MS experiment. A poorly designed bait can produce uninterpretable data regardless of downstream optimization. Three critical parameters must be addressed.
Expression Strategy
Exogenous overexpression — typically via transient transfection in HEK293T cells — is the simplest and most common approach. It provides high bait expression, maximizing complex recovery, but risks overexpression artifacts: non-physiological protein concentrations can drive spurious interactions or saturate endogenous complex assembly machinery. Stable, inducible expression systems (Flp-In T-REx, Tet-on) mitigate some of these concerns by enabling titration to near-endogenous levels. The gold standard is CRISPR-mediated endogenous tagging, where the affinity tag is knocked into the native genomic locus, preserving endogenous regulatory control. This approach eliminates overexpression artifacts but requires successful gene editing, verification of bi-allelic tagging, and confirmation that the tag does not disrupt protein function or localization.
Tag Placement
Both N-terminal and C-terminal fusions should be evaluated, as either can sterically interfere with interaction interfaces. For proteins with known domain architecture, position the tag away from structured interaction domains. A flexible linker (e.g., Gly-Gly-Ser-Gly-Gly) between the tag and bait reduces steric hindrance. When the functional domains are uncharacterized, testing both N- and C-terminal constructs against a known interaction partner provides empirical validation.
Functional Validation
Before proceeding to large-scale AP-MS, confirm that the tagged bait: (a) expresses at the expected molecular weight by western blot, (b) localizes correctly by immunofluorescence, (c) retains a known functional activity or interaction, and (d) does not induce a dominant-negative phenotype. A bait that fails functional validation should be redesigned before investing in MS analysis. For labs new to AP-MS, co-immunoprecipitation/mass spectrometry (co-IP/MS) can validate bait-prey interactions before committing to full-scale interactome mapping.
Affinity Tag Selection: Matching Tag Properties to Experimental Goals
Affinity tag choice shapes purification stringency, background levels, yield, and compatibility with downstream MS. The selection should be guided by the experimental priority — specificity, yield, or physiological relevance.
Single Epitope Tags
FLAG (DYKDDDDK) remains the workhorse for mammalian AP-MS due to its small size (~1 kDa), high-affinity monoclonal antibodies (M2 clone), and mild competitive elution with 3xFLAG peptide. HA (YPYDVPDYA) and c-Myc are alternatives with well-validated reagents but generally higher background. StrepII (WSHPQFEK) and Twin-Strep tags offer exceptionally high affinity for Strep-Tactin resin with biotin-based competitive elution and low background, making them increasingly popular for AP-MS. GFP and its derivatives serve dual purposes — enabling fluorescence-based localization and serving as an affinity handle via GFP-nanobody resins — though the larger tag size (~27 kDa) may perturb function in some contexts.
Tandem Affinity Purification (TAP) Tags
Sequential dual-tag purification (e.g., FLAG-HA, ProtA-CBP) provides the highest specificity by applying two orthogonal purification steps. The first capture enriches the bait and its interactors along with moderate background; the second capture on a different affinity matrix, after cleavage or elution, removes contaminants that co-purified nonspecifically on the first resin. This approach is ideal when minimizing false positives is paramount, such as when validating novel interaction partners for follow-up studies. However, TAP protocols are longer, lower-yield, and may lose weak or transient interactors during the additional wash steps. Creative Proteomics provides dedicated tandem affinity purification (TAP)-MS services optimized for high-specificity interactome studies.
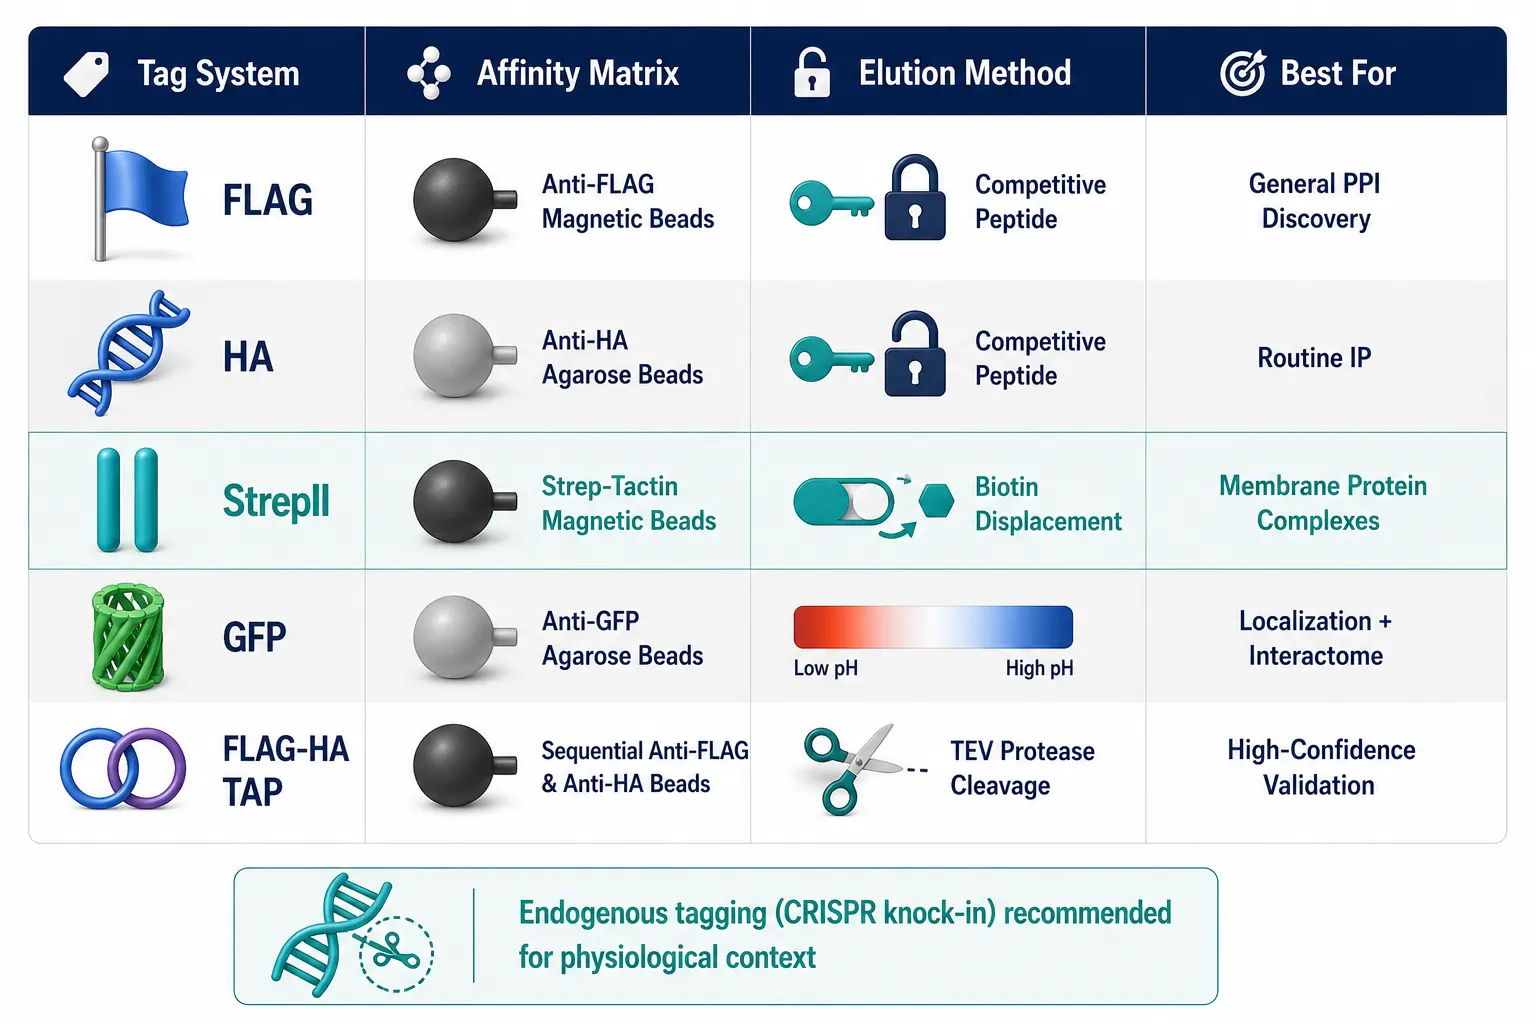
The decision matrix should consider: (a) the required specificity — high for novel interaction discovery, moderate for confirming known complexes; (b) the bait protein's properties — membrane proteins benefit from StrepII tags with mild detergent-compatible elution; (c) the experimental scale — single-tag protocols scale better for high-throughput studies; and (d) the budget — anti-FLAG resin is more expensive than Strep-Tactin or GFP-nanobody matrices at preparative scale.
Optimizing Affinity Purification: Lysis, Beads, and Wash Conditions
Purification conditions bridge the gap between what exists in the cell and what is ultimately detected by the mass spectrometer. Suboptimal lysis or wash conditions are among the most common sources of AP-MS failure.
Lysis Buffer Composition
The lysis buffer must solubilize the bait protein while preserving native interactions. Detergent choice is critical: NP-40 (0.1-0.5%) is suitable for cytoplasmic and many nuclear complexes; Triton X-100 is a harsher alternative. For membrane proteins, digitonin, DDM (n-dodecyl-beta-D-maltoside), or CHAPS are required but may disrupt weaker protein-protein interactions. Ionic strength should be physiological (150 mM NaCl or KCl) to maintain complex integrity; higher salt (300-500 mM) can reduce non-specific electrostatic interactions at the cost of potentially stripping genuine partners. Always include protease and phosphatase inhibitors, and consider benzonase treatment to digest nucleic acids that can mediate protein-protein bridging artifacts.
Bead Selection
Magnetic beads (e.g., anti-FLAG M2 magnetic beads, Strep-Tactin magnetic beads) offer faster protocols, less non-specific binding due to reduced surface area, and compatibility with magnetic separation platforms for high-throughput processing. Agarose or sepharose beads provide higher binding capacity at lower cost but introduce more background proteins from the porous matrix. For most AP-MS applications with mammalian cell inputs (1-5 mg total protein), magnetic beads are preferred, using approximately 20-50 uL of bead slurry per 1 mg of lysate. Pre-clearing the lysate by incubation with blank beads before the specific capture step reduces background but adds time and may deplete low-abundance interactors.
On-Bead Digestion
Performing tryptic digestion directly on the affinity resin — rather than eluting proteins first — minimizes sample loss and simplifies the workflow. After the final wash, beads are resuspended in 50-100 mM ammonium bicarbonate (or similar MS-compatible buffer) containing sequencing-grade trypsin at an enzyme-to-substrate ratio of approximately 1:20 to 1:50 (w/w). Proteins are reduced with 5-10 mM dithiothreitol (DTT, 30 min at 56 degrees C) and alkylated with 15-20 mM iodoacetamide (IAA, 30 min in the dark at room temperature) before overnight digestion at 37 degrees C, or for 4 hours with elevated temperature and agitation. Digestion is terminated by acidification with formic acid to pH < 3, and peptides are desalted via C18 StageTip or solid-phase extraction before LC-MS/MS analysis. On-bead digestion typically yields cleaner peptide preparations than in-solution digestion of eluted complexes because detergent carryover is reduced. Protein sample preparation support covering lysis optimization, tag-specific enrichment protocols, and digestion condition screening is available to maximize interactome coverage.
Wash Stringency
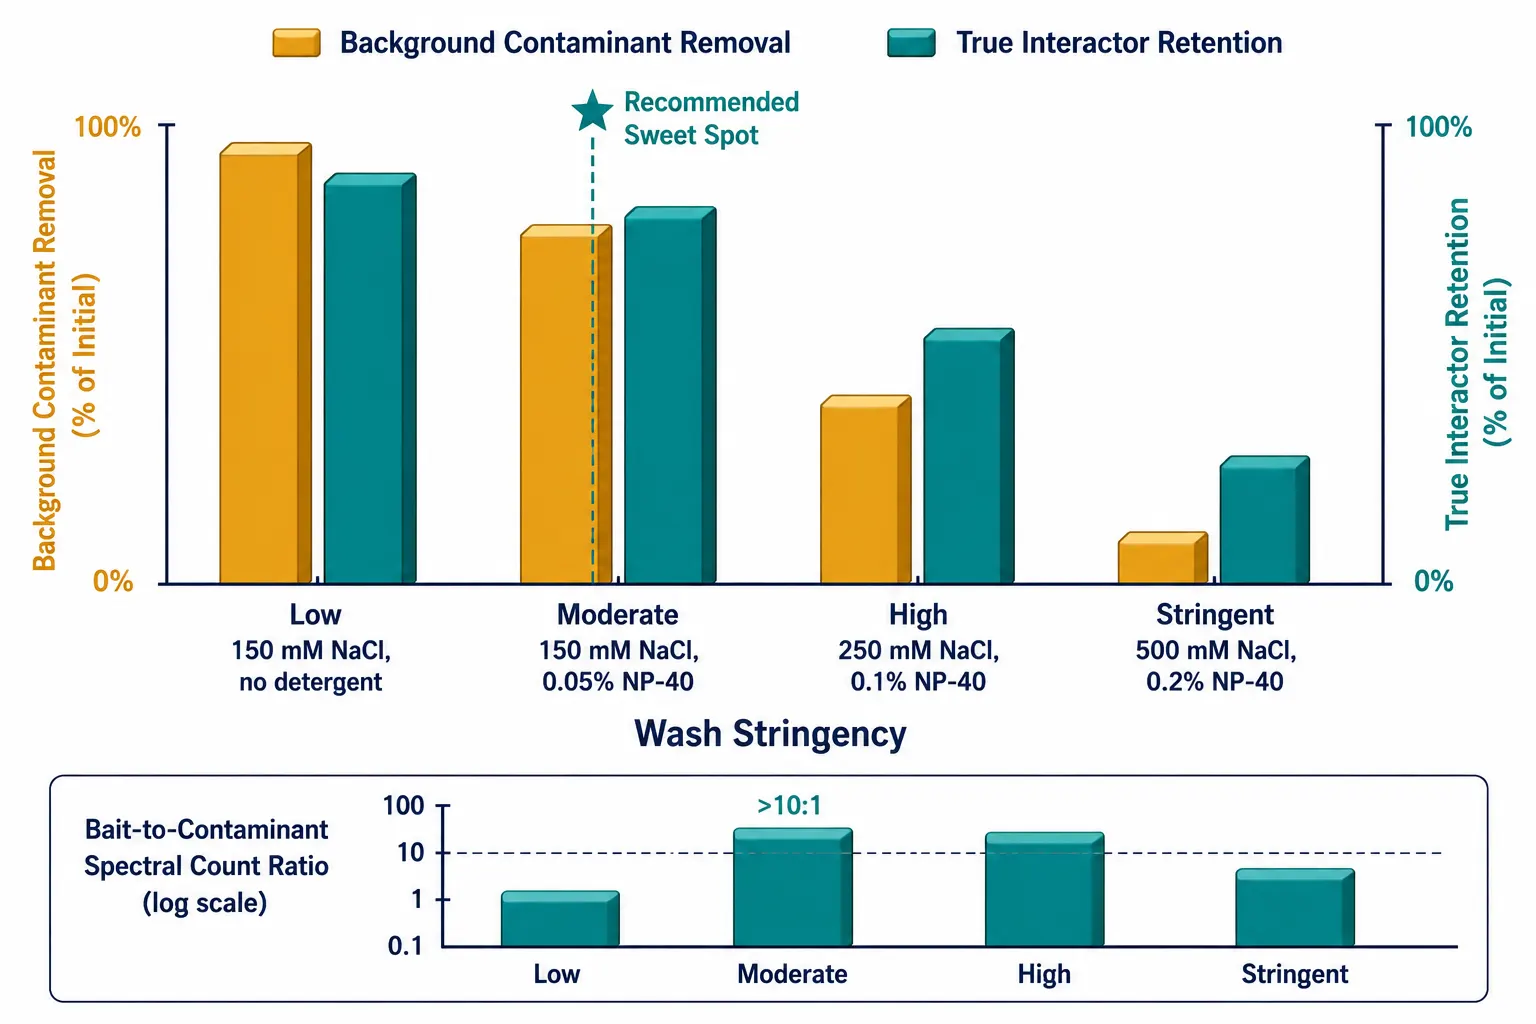
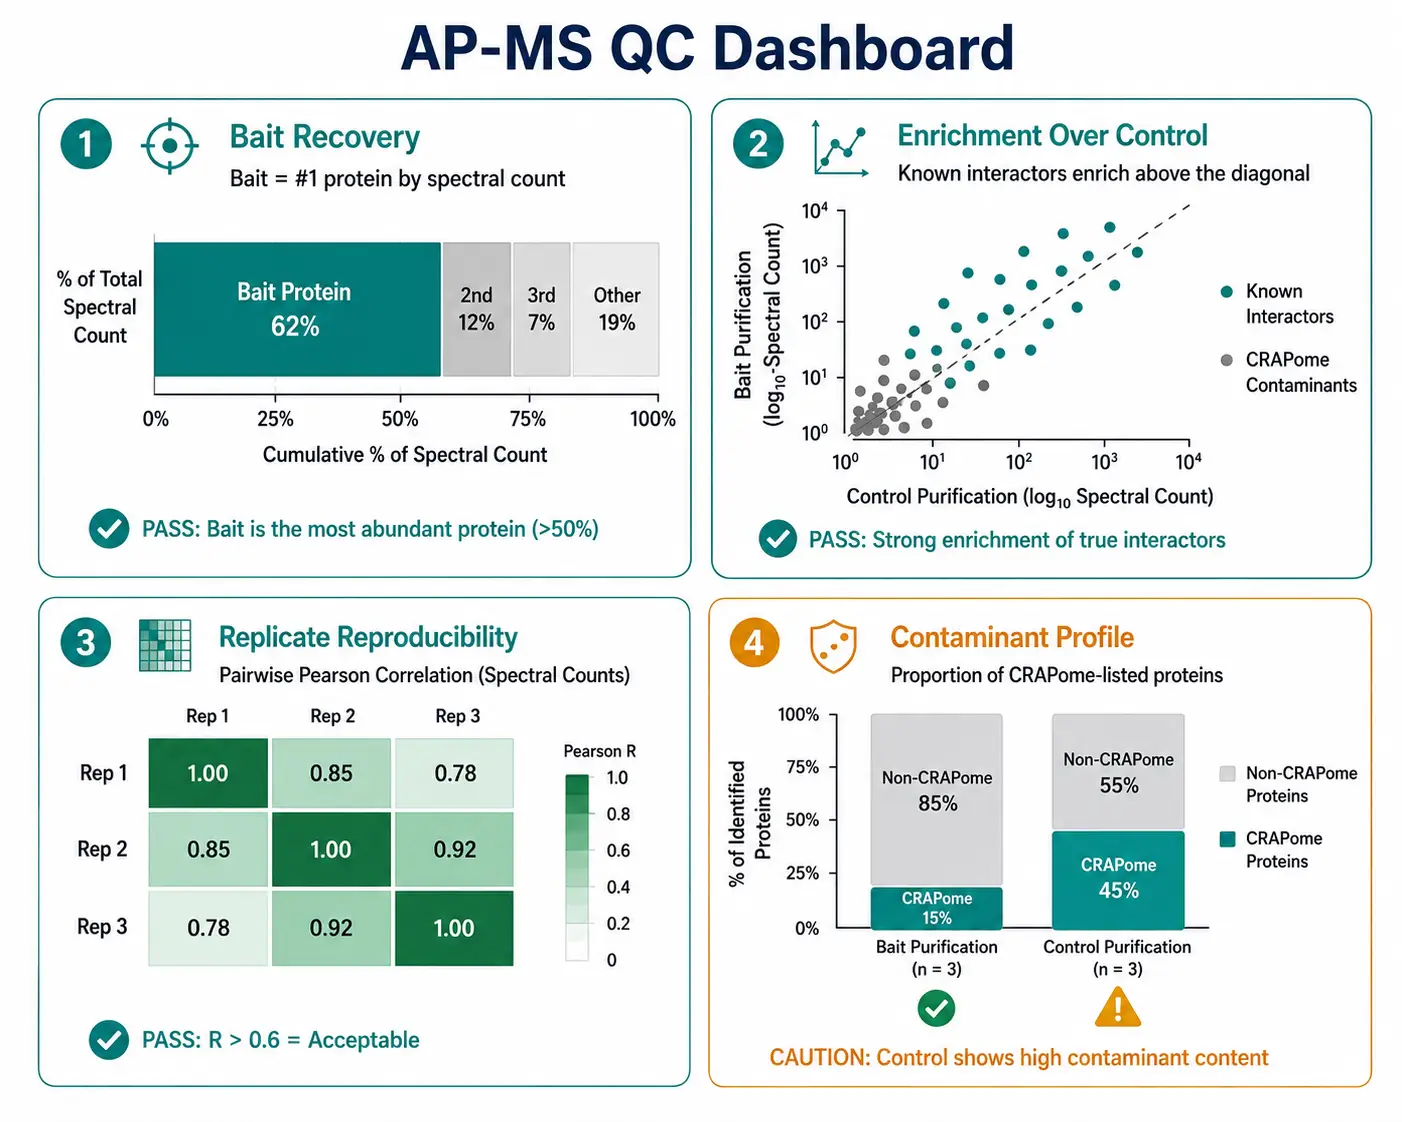
This is a critical optimization variable. Standard washes use 3-5 bead volumes of lysis buffer without detergent to remove unbound proteins while preserving complexes. Adding low concentrations of detergent (0.05-0.1% NP-40) or increasing salt (up to 250 mM) improves stringency. The optimal wash condition balances background removal against interactor retention and should be empirically determined for each bait. A useful quality metric is the ratio of bait spectral counts to the most abundant contaminant — values above 10 indicate adequate purification efficiency.
MS Acquisition Strategies: DDA, DIA, TMT, and SILAC
The choice of MS acquisition and quantification strategy directly determines the depth, quantitative precision, and statistical power of the interactome dataset.
Data-Dependent Acquisition (DDA)
DDA remains the most widely used approach for AP-MS. In DDA, the mass spectrometer sequentially selects the most abundant precursor ions for fragmentation — a strategy well-suited to AP-MS samples where the bait and a limited set of interactors dominate the ion population. DDA works well for label-free quantification (LFQ) using spectral counting or extracted ion chromatogram (XIC)-based approaches in software such as MaxQuant. However, DDA suffers from stochastic precursor selection, leading to missing values across replicates that complicate statistical analysis. For experiments comparing multiple conditions, DDA-LFQ requires more replicates (n ≥ 3 biological replicates per condition) to overcome this variability.
Data-Independent Acquisition (DIA)
DIA systematically fragments all precursors within predefined m/z windows, producing fragment-ion maps with essentially complete coverage of the detectable proteome. DIA eliminates the stochastic sampling problem of DDA, dramatically reducing missing values and improving quantitative reproducibility — a significant advantage for interactome studies where subtle differences between conditions are biologically meaningful. Recent advances in narrow-window DIA (e.g., 2-Th windows on Orbitrap Astral instruments) provide near-complete peptide coverage with chromatographic gradients as short as 7 minutes, enabling high-throughput AP-MS pipelines. DIA data can be analyzed with Spectronaut (directDIA+), DIA-NN, or MaxDIA. For researchers seeking reproducible quantification, DIA quantitative proteomics offers a robust acquisition framework for AP-MS interactome studies.
Tandem Mass Tag (TMT) Multiplexing
TMT multiplexing enables simultaneous quantification of up to 18 samples in a single LC-MS run. TMT is particularly powerful for AP-MS experiments comparing multiple conditions (e.g., bait vs empty vector, drug-treated vs untreated, wild-type vs mutant bait) because it eliminates run-to-run variability and provides precise relative quantification. However, TMT adds reagent cost and an additional sample processing step, and ion co-isolation interference at the MS2 level can compress fold-change ratios — an issue partially mitigated by SPS-MS3 methods or real-time search-guided precursor selection. Creative Proteomics offers TMT-based proteomics for multiplexed AP-MS experimental designs requiring precise cross-condition quantification.
SILAC (Stable Isotope Labeling by Amino acids in Cell culture)
SILAC provides metabolic incorporation of heavy isotope-labeled amino acids, enabling sample mixing at the protein level before any processing steps. This eliminates all downstream handling variability and is ideal for comparing two to three conditions with maximum quantitative accuracy. The limitation is that SILAC requires cells to be cultured in specialized media, making it incompatible with tissue samples and adding complexity to the experimental workflow. For most AP-MS applications, LFQ-DIA or TMT represents a more practical balance of accuracy, throughput, and flexibility. SILAC-based proteomics analysis is available for applications demanding the highest quantitative precision.
Data Analysis: SAINT, CompPASS, MiST, and CRAPome
The central computational challenge in AP-MS is distinguishing true interaction partners from the hundreds of proteins that bind non-specifically to affinity resins, antibodies, and the bait protein's unstructured regions. Statistical scoring algorithms address this by modeling the quantitative features of known contaminants versus genuine interactors.
SAINT (Significance Analysis of INTeractome)
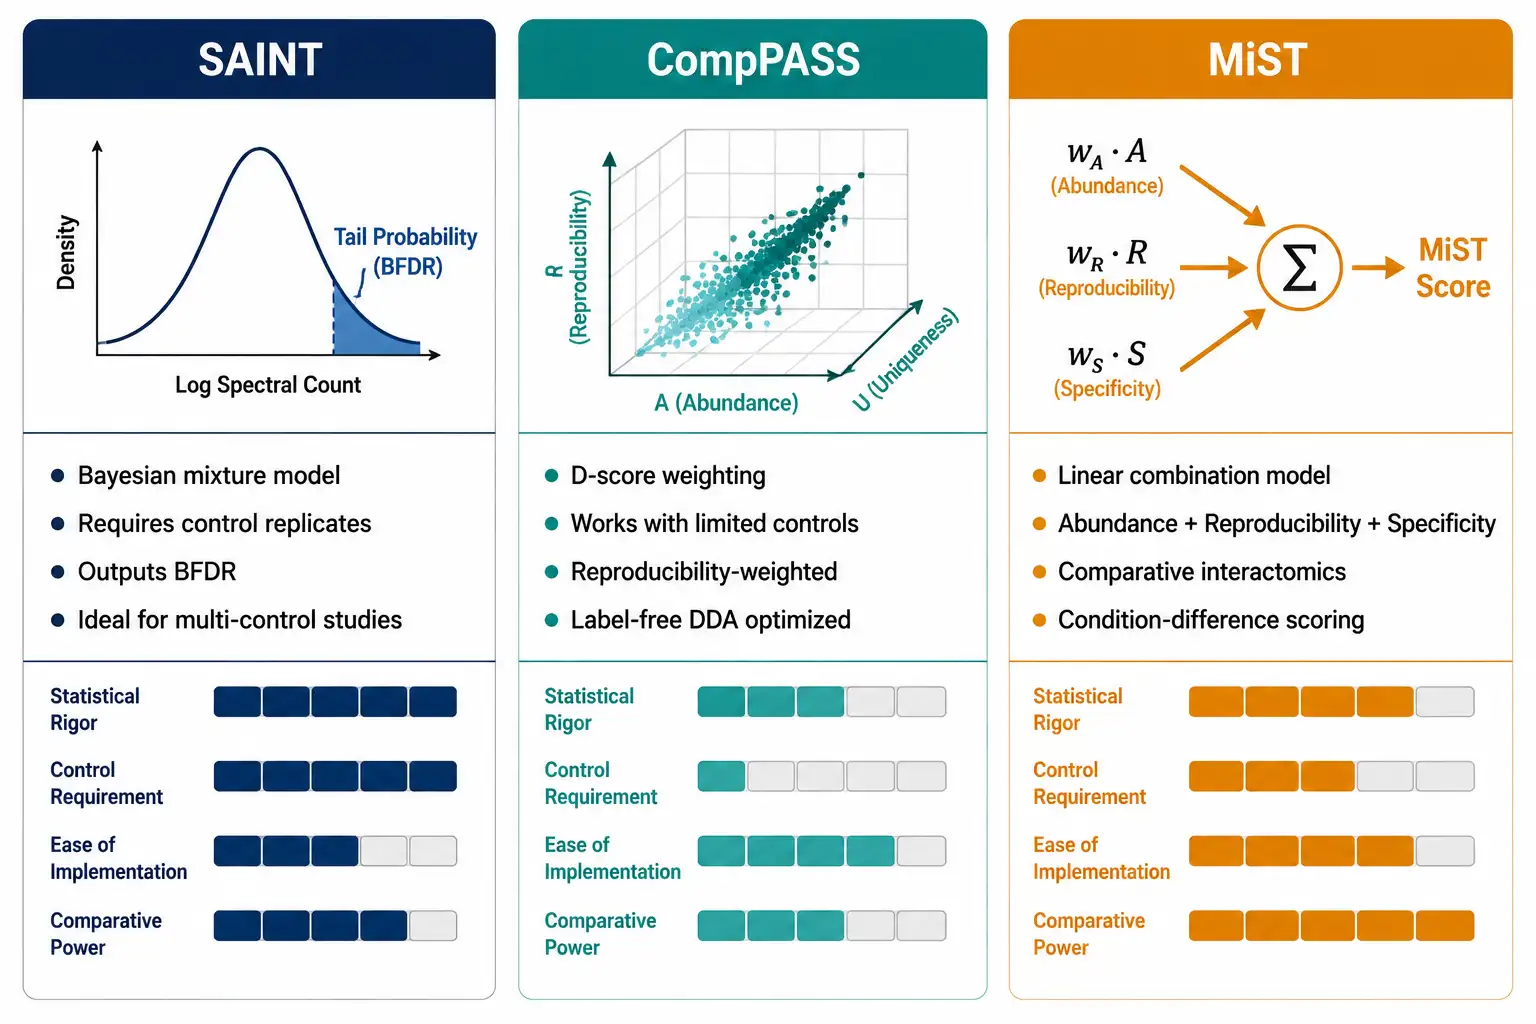
SAINT and its faster implementation SAINTexpress use a mixture model to estimate the probability that each prey protein is a bona fide interactor, given its spectral counts across bait and control purifications. SAINT requires both bait and negative control replicates and outputs a Bayesian False Discovery Rate (BFDR) for each interaction. A SAINT probability ≥ 0.7 (BFDR ≤ 0.05) is commonly used as a threshold for high-confidence interactions, though this can be adjusted based on the experimental context — exploratory studies may use a lower threshold (≥ 0.5) to maximize sensitivity for follow-up validation.
CompPASS (Comparative Proteomic Analysis Software Suite)
CompPASS uses a fundamentally different approach based on abundance, reproducibility, and uniqueness. It calculates a weighted D-score for each prey protein that incorporates the normalized spectral counts, the frequency with which a protein is observed across unrelated AP-MS experiments, and the reproducibility across biological replicates. CompPASS is well-suited for experiments where only a single or limited set of negative controls is available and works effectively with label-free DDA data.
MiST (Mass Spectrometry Interaction STatistics)
MiST combines three features — abundance (spectral counts), reproducibility (across replicates), and specificity (enrichment over controls) — into a single score using a linear combination model with optimized weights. MiST was designed specifically for comparative interactome experiments and provides a framework for prioritizing interactors that change between conditions (e.g., wild-type vs mutant bait).
The CRAPome (Contaminant Repository for Affinity Purification)
The CRAPome is an essential reference database aggregating non-specific interactions from hundreds of published AP-MS experiments across multiple cell lines, tags, and affinity matrices. Filtering candidate interactor lists against the CRAPome removes common contaminants such as ribosomal proteins, heat shock proteins, keratins, and cytoskeletal components that frequently appear as false positives. A protein detected in the bait purification but flagged as present in >20% of CRAPome entries with similar spectral abundance should be treated with caution, regardless of its statistical score. The CRAPome is most effectively used as a secondary filter applied after statistical scoring rather than as a primary discriminator.
Creative Proteomics provides bioinformatics for proteomics including SAINT/SAINTexpress, CompPASS, and MiST-based interactome scoring with integrated CRAPome filtering and network visualization.
Controls, Replicates, and Quality Metrics
The quality of AP-MS data is directly proportional to the rigor of the experimental controls. Even with optimal purification and sensitive MS detection, an experiment without proper controls is uninterpretable.
Negative Control Selection
Three control types serve different purposes. An empty vector control (cells transfected with the empty expression construct) accounts for proteins that bind non-specifically to the affinity resin and antibody. An unrelated bait control (a protein not expected to interact with the bait's pathway, such as GFP or GST) additionally accounts for proteins that interact with the tag or expression machinery. The parental cell line (untransfected cells) provides the cleanest background but does not account for tag-specific contaminants. For rigorous AP-MS, include at least the empty vector control in every experiment. For studies requiring publication-grade evidence, include both an empty vector and an unrelated bait control.
Biological Replicates
AP-MS experiments are inherently variable across biological replicates due to biological variation in protein expression, cell state, and complex assembly, compounded by technical variability in purification efficiency and MS sampling. A minimum of three biological replicates per condition is recommended for label-free DDA experiments; two may suffice for TMT or DIA experiments where missing values are rare. Within each replicate, calculate the Pearson correlation of prey spectral counts; correlations below 0.6 indicate problematic reproducibility that should be investigated before proceeding to statistical scoring.
Quality Metrics
Implement a QC dashboard for each AP-MS experiment: (a) bait recovery — the bait should be the most abundant protein in the purification by spectral count or iBAQ intensity; (b) enrichment — known interactors from the literature or databases (STRING, CORUM) should be enriched in bait vs control; (c) contaminant profile — the proportion of CRAPome-listed proteins should be lower in bait than control purifications; (d) replicate correlation — pairwise Pearson R > 0.6 between biological replicates. Experiments that fail these QC checks should trigger protocol troubleshooting before data interpretation.
AP-MS versus Complementary Methods
AP-MS occupies a specific position in the broader interaction mapping toolkit, with distinct strengths and limitations relative to alternative approaches.
Co-Immunoprecipitation (Co-IP)
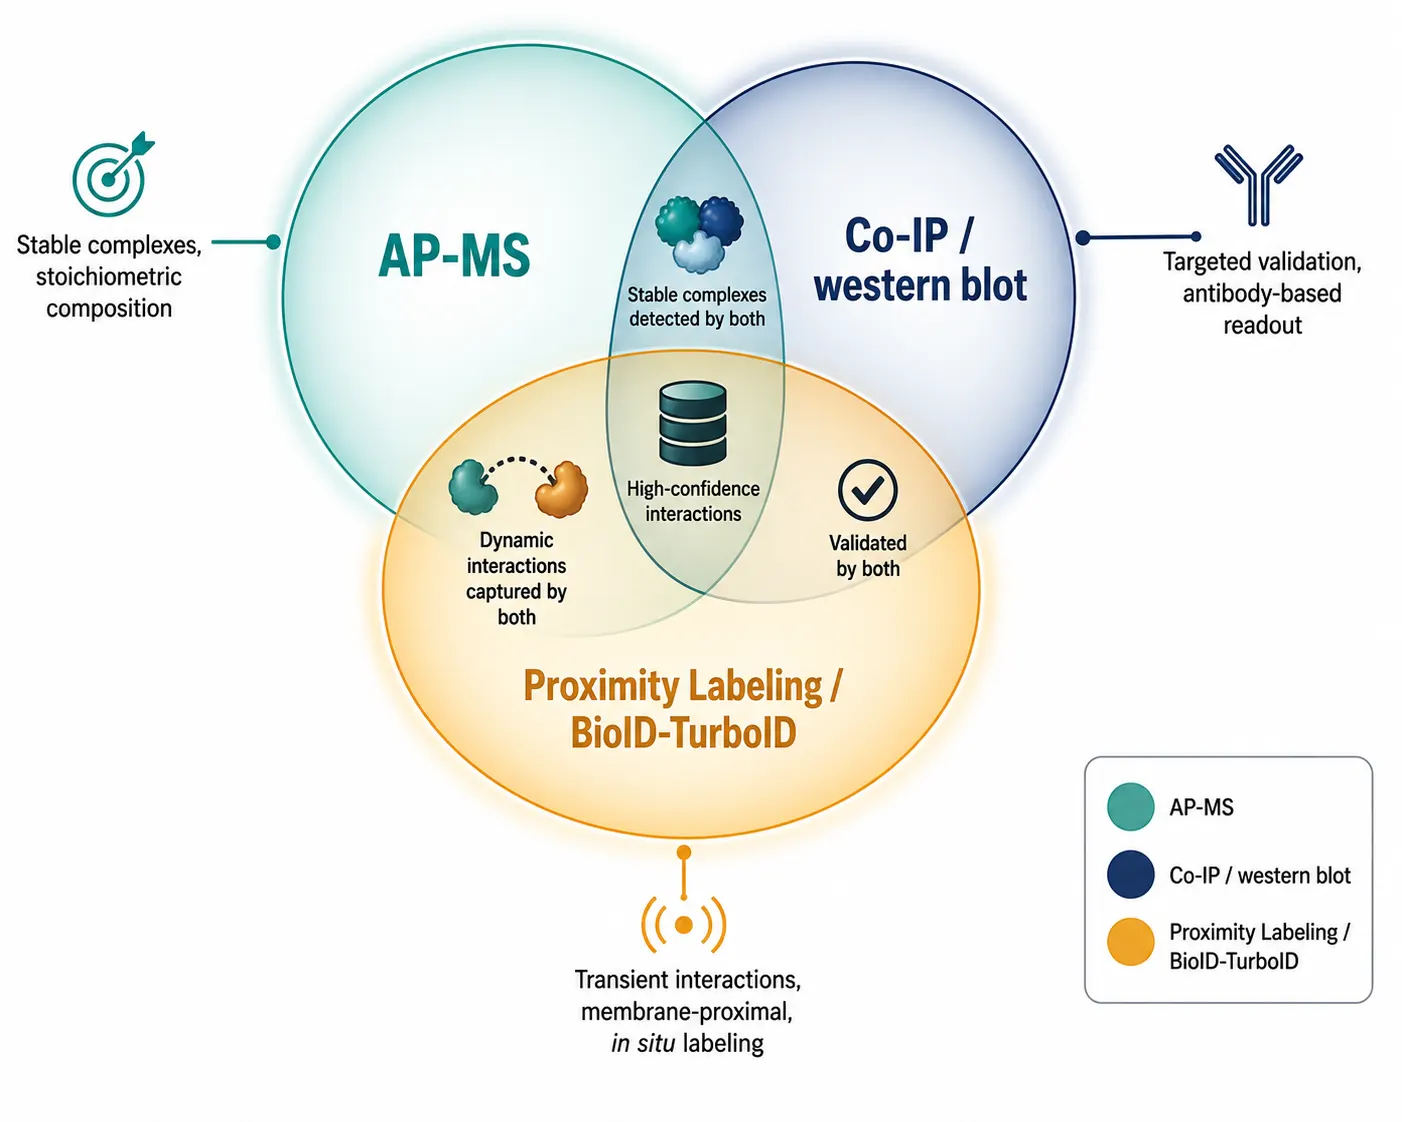
Co-IP followed by western blot shares the same biochemical principle as AP-MS but uses antibody-based detection of one or a few candidate interactors rather than unbiased MS readout. Co-IP/western blot is the standard validation method for individual AP-MS hits but cannot provide the discovery power of MS-based identification.
Yeast Two-Hybrid (Y2H)
Y2H detects direct, binary protein interactions through reconstitution of a transcription factor in yeast nuclei. Y2H is orthogonal to AP-MS: it detects direct physical contacts rather than co-complex membership and operates in an artificial cellular environment that lacks mammalian post-translational modifications and cofactors. Systematic comparisons show that AP-MS and Y2H datasets overlap only partially (~10-30%), reflecting their complementary coverage of the interactome — AP-MS captures stable complexes, while Y2H captures direct binary interactions.
Proximity Labeling (BioID, TurboID, APEX2)
Proximity labeling methods fuse an engineered biotin ligase or peroxidase to the bait, enabling covalent biotinylation of neighboring proteins within a ~10 nm labeling radius in living cells. These methods excel at capturing transient interactions, membrane-proximal protein networks, and interactions in insoluble compartments that are lost during cell lysis. However, proximity labeling introduces its own artifacts — the labeling radius can capture "bystander" proteins that are nearby but do not physically interact with the bait. AP-MS and proximity labeling are best viewed as complementary: AP-MS for high-confidence stable complex composition, proximity labeling for interaction neighborhood mapping.
Cross-Linking MS (XL-MS) and Co-Fractionation MS (CF-MS)
Beyond AP-MS and proximity labeling, two additional methods extend the interactome mapping toolkit. Cross-linking mass spectrometry (XL-MS) covalently stabilizes protein contacts before cell lysis using bifunctional chemical cross-linkers, yielding residue-level distance constraints that are invaluable for integrative structural modeling with AlphaFold-Multimer or cryo-EM density maps. Co-fractionation MS (CF-MS) takes a tag-free approach: native protein complexes are separated by size-exclusion chromatography, ion-exchange chromatography, or blue-native PAGE, and co-eluting proteins are identified by correlation-based clustering of their abundance profiles across fractions. CF-MS is particularly powerful for organisms or tissues where genetic tagging is impractical, and has been applied to generate draft interactomes for over a dozen species. These methods complement AP-MS by providing orthogonal evidence — structural proximity data (XL-MS) and native complex co-migration profiles (CF-MS) — that strengthen interaction confidence when integrated with affinity-based datasets. Creative Proteomics offers BioID-MS and TurboID for proximity labeling, alongside crosslinking protein interaction analysis for comprehensive interactome characterization.
FAQ
Q: How many candidate interactors should I expect from a typical AP-MS experiment?
A: For a well-behaved cytoplasmic bait, expect 50-300 candidate interactors before statistical filtering, narrowing to 10-50 high-confidence interactors after SAINT/CompPASS scoring (BFDR ≤ 0.05) and CRAPome filtering. The number depends on the bait's biological connectivity and the purification stringency.
Q: Can AP-MS detect post-translational modification-dependent interactions?
A: Yes. Stable modification-dependent interactions (e.g., phosphorylation-dependent binding) can be detected if the modifying enzyme is active under the lysis conditions. For dynamic modifications, phosphatase/protease inhibitors in the lysis buffer help preserve the modification state during purification.
Q: Is AP-MS possible for membrane proteins?
A: Yes, but membrane protein AP-MS requires optimization. Use detergents that solubilize the membrane without disrupting interactions (digitonin, DDM). Integral membrane proteins with multiple transmembrane domains are challenging and may be better suited to proximity labeling approaches.
Q: How does endogenous tagging compare to overexpression for AP-MS?
A: Endogenous CRISPR-mediated tagging eliminates overexpression artifacts and preserves native stoichiometry, but yields lower bait recovery and may require scaling up cell input 5-10x relative to overexpression. Both approaches are valid; the choice depends on the priority placed on physiological accuracy versus sensitivity.
Q: What distinguishes SAINT from CompPASS in practical use?
A: SAINT requires control replicates and provides a formal statistical framework (BFDR) suitable for publication. CompPASS works with limited controls and is simpler to implement but yields less statistically rigorous confidence estimates. For well-controlled experiments, SAINT is preferred; for exploratory work with limited controls, CompPASS provides a practical alternative.
Q: Can I combine AP-MS data with other interaction datasets?
A: Yes. Integrated analysis combining AP-MS, Y2H, proximity labeling, and structural data (AlphaFold-Multimer, cryo-EM) is increasingly standard. Tools like Cytoscape and STRING support multi-source network integration for comprehensive interactome models.
Q: How much starting material do I need for AP-MS?
A: For overexpression experiments in HEK293T, 1-3 confluent 10 cm dishes (~2-5 mg total protein) per replicate typically suffice. For endogenous AP-MS, 5-10x more starting material may be needed. Single-shot DIA on modern instruments can identify ~3,000-5,000 proteins from ~1 ug of peptide input, so sub-microgram-level samples are increasingly feasible.
*For research use only.
References:
- Kaushal P, Ummadi MR, Jang GM, et al. Protocol for mapping differential protein-protein interaction networks using affinity purification-mass spectrometry. STAR Protocols. 2024;5(4):103286. doi: 10.1016/j.xpro.2024.103286 (CC BY 4.0)
- Wu S, Zhang S, Liu CM, Fernie AR, Yan S. Recent advances in mass spectrometry-based protein interactome studies. Molecular & Cellular Proteomics. 2025;24(1):100887. doi: 10.1016/j.mcpro.2024.100887 (CC BY 4.0)
- Liu X, Abad L, Chatterjee L, Cristea IM, Varjosalo M. Mapping protein-protein interactions by mass spectrometry. Mass Spectrometry Reviews. 2024. doi: 10.1002/mas.21887 (CC BY)
- Bian W, Jiang H, Feng S, Chen J, Wang W, Li X. Protocol for establishing a protein-protein interaction network using tandem affinity purification followed by mass spectrometry in mammalian cells. STAR Protocols. 2022;3(3):101569. doi: 10.1016/j.xpro.2022.101569 (CC BY 4.0)
- Voisinne G, Locard-Paulet M, Froment C, et al. Mapping the SLP76 interactome in T cells lacking each of the GRB2-family adaptors reveals molecular plasticity of the TCR signaling pathway. Frontiers in Immunology. 2023;14:1139123. doi: 10.3389/fimmu.2023.1139123 (CC BY 4.0)






