Nicotinamide adenine dinucleotide is often described as a redox cofactor. That is accurate, but it is not enough for modern metabolic research. NAD+ sits at the center of fuel oxidation, redox balancing, enzymatic signaling, and stress adaptation. Its reduced form, NADH, carries reducing equivalents through core energy pathways. Its phosphorylated partner system, NADP+/NADPH, supports reductive biosynthesis and antioxidant defense. Together, these molecules define a functional redox network rather than a single metabolite class. That is why NAD analysis has moved far beyond simple pool measurement. Researchers now need methods that preserve unstable analytes, distinguish oxidized from reduced states, and resolve pathway behavior under real experimental stress.
At the chemical level, the NAD system is built around hydride transfer. NAD+ accepts a hydride during oxidation reactions, while NADH donates one during reduction reactions. The same basic logic applies to NADP+ and NADPH, but their biological role is shifted toward anabolic and protective processes. That division of labor matters analytically. A study that claims to measure "NAD metabolism" may actually be measuring several chemically distinct but tightly connected molecules with different stability profiles, different ionization behavior, and different biological meaning. Once that complexity is ignored, the dataset becomes easier to generate but much harder to trust.
The structure of these cofactors explains much of their analytical difficulty. Each NAD molecule contains an adenine nucleotide and a nicotinamide nucleotide joined through a pyrophosphate bridge. The nicotinamide ring carries the redox-active center. The ribose and phosphate-containing regions drive high polarity. In NADP+ and NADPH, the added phosphate further increases chromatographic difficulty. This is why NAD-related analytes are often hard to retain under standard reversed-phase conditions and why phosphorylated species are especially sensitive to method design. What looks like a biological measurement problem is often a chemistry problem first.
NAD+ also functions as a consumed substrate. Sirtuins use it during deacetylation. PARPs consume it during ADP-ribosylation. CD38 and related enzymes also draw from the same pool. This changes how the metabolome should be interpreted. A lower NAD+ level does not automatically mean weaker synthesis. It may reflect stronger enzymatic consumption, altered salvage capacity, greater stress load, or a change in precursor routing. A measured pool size is therefore only one layer of information. It defines abundance, but not turnover logic.
This distinction becomes critical in aging and metabolic research. Many studies describe NAD decline as though it were a direct readout of pool depletion. In practice, age-related or stress-related changes can emerge from several mechanisms at once: reduced precursor supply, altered NAMPT activity, elevated CD38, DNA damage burden, mitochondrial remodeling, or changed biosynthetic routing. Two samples may show similar NAD+ abundance while operating under very different turnover states. One pool may be stable and slowly renewed. Another may be under constant consumption pressure and only maintained through rapid replenishment. Concentration data alone cannot resolve that difference.
That is why serious NAD metabolomics starts by defining the real analytical target. In most projects, the true goal falls into one of three categories. The first is accurate quantification of a defined NAD-related metabolite set. The second is preservation of redox information, usually represented by ratios such as NAD+/NADH or NADP+/NADPH. The third is pathway interpretation, where the researcher needs to know whether the pool is being synthesized, consumed, or rerouted. These goals overlap, but they are not interchangeable. A method that is good enough for abundance screening may fail for redox-state preservation. A workflow that measures concentration well may still be blind to turnover.
This is where analytical design becomes more important than platform labels. It is easy to say that LC-MS/MS is the preferred approach. That statement is broadly true, but it hides the real issue. The method only becomes reliable when sample handling, extraction chemistry, internal standard strategy, chromatographic retention, and fragmentation logic are all designed around the actual biological question. A broad metabolite workflow may be useful for exploratory work, but it is often not enough when the study depends on true redox preservation or pathway discrimination. In those cases, structured services such as Targeted Metabolomics or Metabolomics Service become more useful when the target list and interpretation framework are defined in advance.
The challenge of analyte instability
Most failures in NAD analysis begin before the sample reaches the instrument. They begin in the first seconds after collection.
That is the real technical center of the field. NAD metabolomics is often presented as a separation problem, but the deeper problem is state preservation. Researchers want to measure the redox condition that existed inside the sample. What they often measure instead is a mixture of original biology and post-sampling drift. The error starts early, accumulates fast, and can survive all the way to the final figure.
The quenching paradox
The instability problem is not balanced across oxidation states. Reduced pyridine nucleotides such as NADH and NADPH respond differently to extraction stress than oxidized forms such as NAD+ and NADP+. In general, reduced forms are more vulnerable under acidic handling, while oxidized forms are less stable in alkaline conditions. Temperature, oxygen exposure, solvent composition, residual enzyme activity, and handling time amplify this asymmetry. The result is a practical paradox: a workflow that protects one side of the redox pair can distort the other.
This is where many shallow methods fail. They choose acid or base for convenience, then assume the measured ratio still reflects biology. That assumption is often unsafe. If extraction chemistry degrades or shifts one redox state more strongly than the other, the final NAD+/NADH ratio becomes partly method-derived. The problem is even worse for low-abundance or stress-sensitive samples, where a modest analytical loss can become a large biological misinterpretation.
A more defensible approach is to design the early workflow around the preservation of the native redox relationship. In many projects, that pushes the method toward rapid cold quenching and a neutral or near-neutral extraction mindset. The goal is not to eliminate all chemistry. That is impossible. The goal is to stop metabolism so quickly that acid-driven, base-driven, and enzyme-driven distortions have much less time to act.
Why quenching kinetics matter
Quenching should not be treated as a transfer step. It is a race against ongoing chemistry.
NAD-linked reactions sit inside fast enzyme networks. Once a culture plate leaves the incubator, once a tissue sample warms during handling, or once a pellet waits for solvent, the original redox state starts to move. That movement is often invisible, but it is still real. Dehydrogenases continue to act. ATP-linked processes continue to shift cofactor demand. Residual enzyme activity can survive longer than many workflows assume, especially when cooling is incomplete or solvent contact is delayed. The result is not just random loss. It is directional drift.
That directional drift matters most when the study makes a ratio claim. Abundance-only claims are already sensitive to handling bias, but redox-ratio claims are stricter. If both oxidized and reduced pools move during the harvest-to-quench window, the ratio may shift more sharply than either pool alone. This means that a workflow acceptable for simple abundance ranking may still be too loose for NAD+/NADH or NADP+/NADPH interpretation.
For that reason, harvest-to-quench timing should be treated as an analytical variable, not a convenience variable. The solvent should be pre-chilled before the biological endpoint is reached. The collection path should be short. The handling order should be fixed across groups. Samples should not move through the workflow in a casual sequence that places one condition consistently earlier or later than another. Otherwise, batch-order bias enters before the mass spectrometer is even turned on.
A robust NAD workflow therefore asks several practical questions at the start. How long does the sample spend between harvest and quench? Is the solvent already equilibrated at the intended temperature? Is residual enzyme activity being suppressed immediately, or only after a lag during transfer? Does the order of processing align with the order of biological groups, creating systematic bias? These are not secondary details. They decide whether the measured state still represents the original experiment.
Designing a neutral extraction strategy
A neutral extraction strategy is best understood as a design principle, not a single recipe. The aim is to preserve oxidized and reduced forms well enough that the measured redox relationship still resembles the native system. In practice, this means balancing four needs at once: rapid metabolic arrest, minimal chemical stress during early extraction, strong suppression of residual enzyme activity, and compatibility with downstream LC-MS/MS measurement.
The correct balance depends strongly on the matrix.
For cell pellets, the main risk is delay between media removal, washing, and solvent contact. The priority is speed. A workflow that adds unnecessary transfer or rinse steps can distort the pool before extraction even begins.
For tissues, the main risk is slower solvent penetration and stronger endogenous enzyme activity. The priority is to minimize the harvest window and keep the tissue cold from the first second. Matrix-specific workflows become important here, especially in tissue NAD metabolite analysis.
For plasma and serum, the main risk is pre-analytical inconsistency rather than intracellular metabolism in the strictest sense. The priority is standardized collection, processing temperature, and separation timing. Matrix-oriented handling logic belongs in plasma/serum NAD metabolite analysis.
For whole blood, the risk profile is even stricter because the sample remains metabolically active during handling. Delay, mixing inconsistency, and storage conditions can all reshape the measured signal. This is one of the clearest cases where a dedicated whole blood NAD metabolite analysis workflow is preferable to a generic panel.
For organoids, the main risk is structural heterogeneity and variable extraction penetration. The priority is reproducible sampling geometry and consistent solvent access.
For subcellular fractions, the risk is artificial redistribution during fractionation as well as prolonged handling time. The priority is to avoid turning a compartment-specific question into an artifact of the isolation workflow.
These matrix-specific differences are why a focused Coenzyme I Analysis Solution can be more useful than a broad generic assay when cofactor preservation is central to the study. When the same project also needs pathway interpretation, the extraction strategy should be aligned from the start with Metabolic Flux Analysis (MFA), not added later as a separate layer.
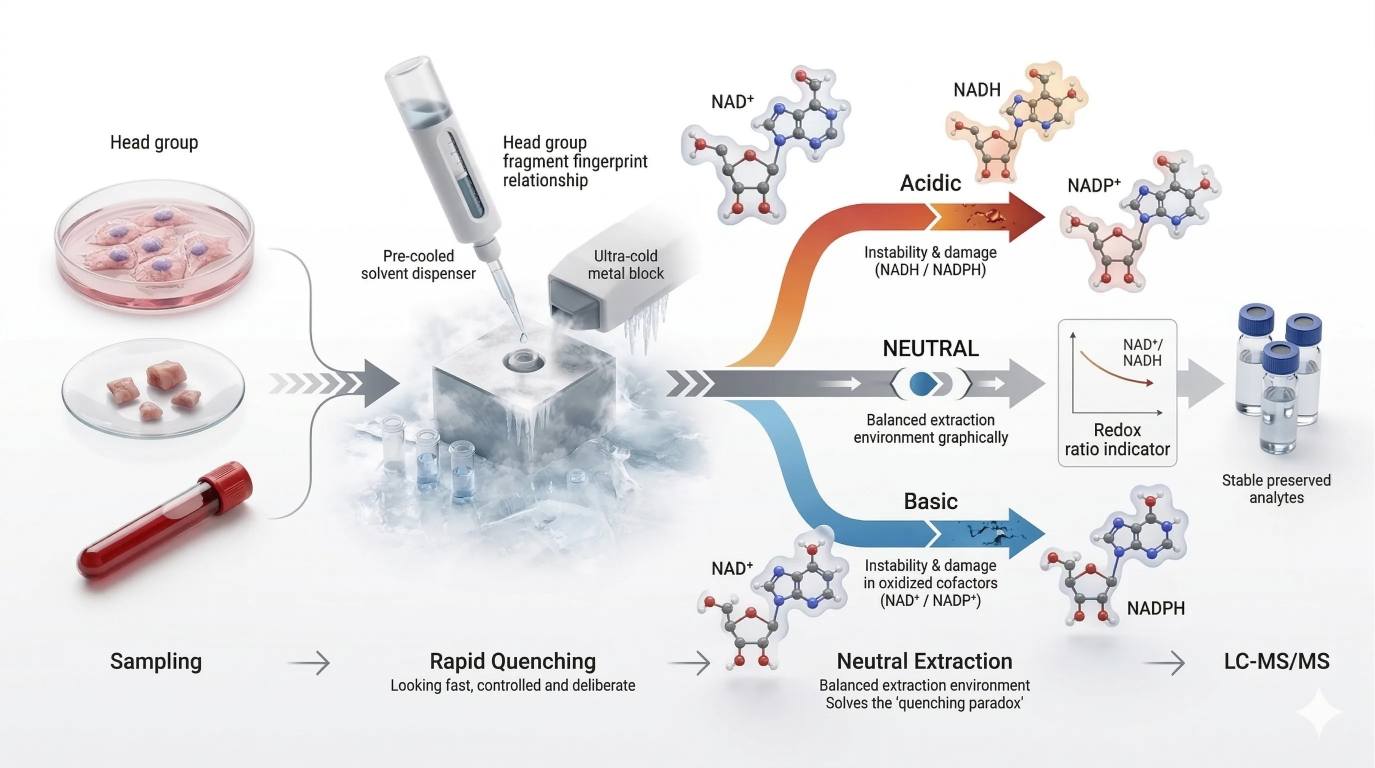 Figure 1. Redox-state freezing workflow showing three required visual elements: the harvest-to-quench time window as a critical risk interval, ultra-cold solvent contact as the point of enzyme activity suppression, and a three-branch extraction logic that contrasts acid-biased loss of reduced cofactors, base-biased loss of oxidized cofactors, and a neutral cold route designed to preserve the original redox relationship.
Post-extraction interconversion is the hidden enemy
Extraction does not end the risk window. It often starts a second one.
Many workflows assume that once metabolites enter solvent, the sample is safe. In NAD work, that assumption is often wrong. Post-extraction drift can continue during slow centrifugation, incomplete cooling, delayed transfer, repeated thawing, long autosampler residence, or poorly chosen reconstitution conditions. The extract may look finished while its redox information is still moving.
This is why "freeze the redox state" is not just a slogan. The aim is not only to release metabolites. It is to lock the oxidized and reduced pools into a state that still reflects the biology. That requires explicit control over solvent temperature at first contact, extraction duration, centrifugation temperature, storage temperature of the extract, reconstitution conditions, acceptable autosampler residence time, and freeze-thaw tolerance. If these variables are left undefined, handling order can masquerade as biology.
This problem becomes more serious in large studies. Instrumental batch effects are widely recognized, but NAD workflows can fail earlier through extraction batch effects. If one treatment group is consistently processed first and another last, the difference may enter before any chromatographic separation takes place. A well-designed method therefore treats extraction order and timing discipline as part of assay validation, not just sample logistics.
Internal standards are a core part of method design
In routine metabolomics, internal standards are often treated as a good addition. In NAD metabolomics, stable isotope internal standards are much closer to a requirement when precise targeted quantification is the goal.
The reason is straightforward. Extraction loss, matrix-induced ion suppression, transfer variability, and analyte instability do not affect every NAD-related molecule equally. A single generic surrogate cannot correct for all of those effects well enough. Stable isotope-labeled analogs behave more like the native analytes during extraction and ionization, so they provide a much stronger correction framework. When multiple labeled standards are used across the pathway, the method becomes even more defensible because each correction is chemically closer to the corresponding target analyte.
This matters most when the expected biological change is modest. If an NAD+ signal falls, the study needs to know whether the shift reflects true biology, reduced recovery, stronger suppression, or instability during handling. Without a strong internal-standard strategy, those explanations are difficult to separate. That is why internal standard planning should begin with extraction design, not after the first batch has already been run.
Where broader pathway context matters, the NAD dataset also becomes stronger when interpreted alongside TCA Cycle Analysis Service or supported by Bioinformatics for Metabolomics. The point is not to add links for their own sake. It is to make sure cofactor behavior is interpreted inside the metabolic context that actually drives it.
Advanced quantification by LC-MS/MS
Once the redox state has been preserved as well as possible, the next challenge begins: how to separate and quantify highly polar, structurally related analytes with enough selectivity to support the biological claim.
LC-MS/MS has become the leading platform for precision NAD metabolomics because it combines sensitivity, specificity, and multiplexing power. But platform choice alone is not enough. Highly polar nucleotides must be retained, resolved, ionized, fragmented, and quantified under real matrix conditions, not just in neat standards. That is where method architecture matters.
Why NAD metabolites are difficult to separate
NAD+, NADH, NADP+, NADPH, NMN, NAM, NR, NAAD, ADPR, and related molecules are highly polar. Several also carry phosphate or pyrophosphate groups. This creates three recurring problems. Retention under standard reversed-phase conditions is often weak. Peak shape can deteriorate, especially for phosphorylated analytes. Co-elution or near co-elution increases the risk of transition interference and inaccurate quantification. These are not minor instrument details. They define whether the final data can support mechanistic interpretation.
HILIC versus ion-pairing reversed-phase LC
For many NAD-focused assays, HILIC is the most practical starting point because it provides better retention for highly polar analytes than conventional reversed-phase LC. It often supports broader NAD-related panels and works well with MS-compatible solvent systems. When the target list includes multiple small polar cofactors and precursors, HILIC can provide the balance of retention and throughput that the assay needs.
Ion-pairing reversed-phase LC offers a different solution. It can improve retention of difficult phosphorylated metabolites and may solve selectivity problems that ordinary reversed-phase conditions cannot handle well. But those gains come with operational tradeoffs. Ion-pair reagents can complicate source cleanliness, reduce method portability, and increase maintenance burden, especially in multi-assay environments.
That is why the decision should follow the assay question. If broad coverage of highly polar NAD-related analytes is the priority, HILIC is often the more scalable foundation. If a narrower analyte set remains difficult under HILIC, ion-pairing or mixed-mode strategies may be justified. What matters is not platform ideology. What matters is whether the separation logic matches the chemistry of the target panel.
MRM transition design determines real specificity
Triple quadrupole LC-MS/MS remains one of the strongest tools for targeted NAD quantification because MRM provides high sensitivity and strong reproducibility. But specificity is not guaranteed by the acronym. It depends on transition design.
NAD-related molecules can fragment through different routes, including cleavage near the pyrophosphate region and cleavage around the nicotinamide-ribose portion of the molecule. If transitions are chosen only because they are intense, structurally related compounds may overlap or generate unstable quantifier behavior. The best transition is not always the largest signal. It is the signal that remains specific, stable, and reproducible across the real biological matrix.
A strong transition strategy asks practical questions. Is the precursor stable across matrices? Does the product ion carry enough structural specificity? Is the collision energy tuned for reproducible response? Could a related metabolite produce a similar fragment under the same conditions? These questions are what separate a workable research assay from a fragile method that looks fine in standards but fails in real samples.
Projects that begin with broader exploratory mapping may still benefit from LC-MS/MS Untargeted Metabolomics during discovery, followed by a locked targeted method supported by SRM & MRM when the analyte list is fixed.
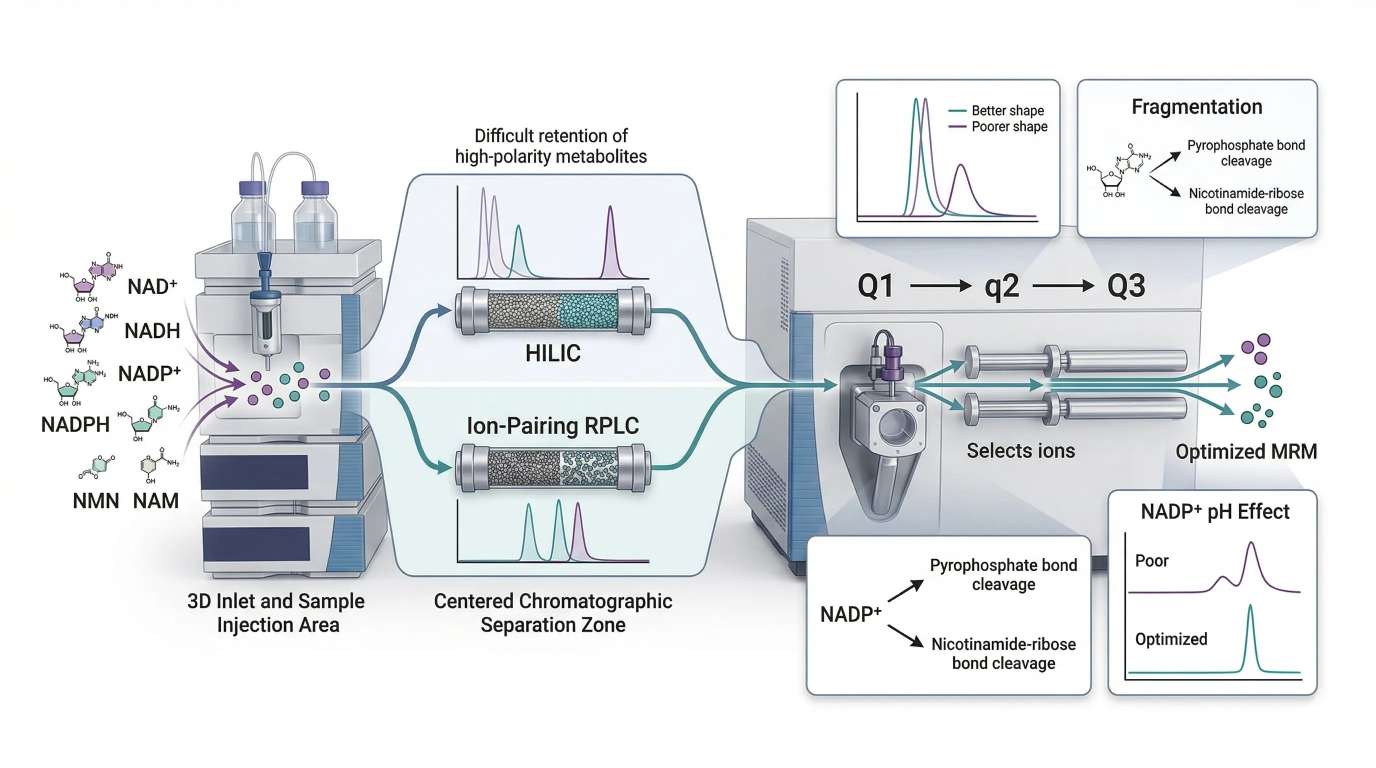 Figure 2. LC-MS/MS workflow for targeted NAD metabolite quantification, showing chromatographic separation strategy, MRM transition selection, and the effect of mobile phase conditions on signal quality, especially for phosphorylated analytes such as NADP+.
Validation checkpoints before trusting the assay
Method development is not complete when the peaks look acceptable. A defensible NAD workflow must also qualify how the assay behaves under real operating stress.
Recovery should be checked across the actual matrix, not only in solvent standards. Matrix effect should be measured because ion suppression can differ sharply between analytes and sample classes. Carryover must be tested, especially when high-abundance samples sit next to low-abundance ones. Short-term extract stability should be qualified across the expected run window, because NAD-related analytes can continue to drift after extraction. Freeze-thaw tolerance should be established rather than assumed. Autosampler residence time should also be challenged directly, since a sample that is stable for one hour may not remain reliable across a long batch.
These checkpoints matter because NAD workflows often fail gradually rather than catastrophically. The assay may still produce peaks, still generate a calibration line, and still pass superficial review while the redox-sensitive analytes are drifting underneath. A strong method therefore validates the conditions that the real study will impose, not just the conditions that look best during setup.
Metabolic flux analysis of the NAD system
Accurate NAD quantification is essential, but concentration alone is not enough. A concentration value describes the size of a pool at one moment. It does not show how quickly that pool is being filled, drained, recycled, or buffered. In aging models, nutrient stress models, mitochondrial perturbation studies, and DNA-damage settings, this distinction becomes decisive. A sample may show a stable NAD+ level while the underlying system is under heavy turnover pressure. Recent tracing protocols make this point directly: steady-state NAD+ concentration cannot, by itself, separate synthesis from consumption.
This is where flux analysis changes the value of the experiment. A flux-aware design asks a different question. It does not stop at "how much NAD+ is present?" It asks "where is this NAD+ coming from, how quickly is it turning over, and which pathway is dominating under this condition?" Those are not minor refinements. They determine whether an observed pool change reflects altered precursor routing, altered salvage efficiency, de novo pathway remodeling, or stronger downstream consumption.
Pool size and flux should therefore be treated as complementary layers. Pool size gives a structural snapshot. Flux adds movement, direction, and pathway attribution. Without that second layer, many NAD conclusions remain incomplete.
Why static abundance can mislead
A low NAD+ measurement is often read as reduced biosynthesis. That interpretation may be correct, but it is only one possibility. The same signal can also reflect higher PARP-dependent consumption, stronger CD38 activity, faster turnover during stress adaptation, or precursor diversion into neighboring metabolic routes. A normal NAD+ level can be just as misleading. It may represent a truly stable state, or it may reflect rapid compensation in which synthesis and consumption are both elevated. Tracing studies were developed to resolve exactly this ambiguity.
This matters most in perturbation studies. If a nutrient, gene edit, stressor, or pathway modulator changes total NAD+, the next question is not optional. Did the pool change because synthesis increased, because breakdown slowed, because precursor preference shifted, or because turnover timing changed? Without tracer-informed data, those explanations remain partly inferential.
A strong NAD workflow often uses both layers in sequence. First, targeted quantification defines the steady-state NAD landscape. Then isotope incorporation is added to reveal how the pool is being built and renewed. When those two layers agree, confidence rises. When they diverge, the divergence itself becomes biologically informative.
Isotopic labeling logic: separating salvage from de novo synthesis
The basic logic of NAD flux analysis is simple. Different labeled precursors enter the NAD network through different routes. If the tracer is chosen well and the time course is designed correctly, the incorporation pattern can show which branch of the pathway is carrying the load.
For the salvage pathway, labeled nicotinamide is one of the most useful tracers. It enters the salvage route, passes through NMN, and then contributes to NAD+. This makes it a strong choice when the study asks whether cells or tissues are relying more heavily on nicotinamide recycling. Recent protocols explicitly describe stable isotope-labeled nicotinamide, nicotinic acid, and tryptophan as informative NAD precursors for tracing synthesis and consumption.
For de novo synthesis, labeled tryptophan is especially informative because it enters upstream through the kynurenine-linked branch before converging on later biosynthetic steps toward NAD+. That makes it useful when the study asks whether de novo contribution changes under nutrient stress, liver remodeling, mitochondrial stress, or genetic perturbation of precursor handling. In some pathway contexts, related biosynthetic chemistry can also be interpreted together with aspartate-linked logic downstream, but the core design principle remains the same: pick the tracer that answers the pathway question, not the tracer that happens to be easiest to source.
That choice should be biological first and analytical second.
- If the question is salvage dependence, labeled nicotinamide is often the clearest starting point.
- If the question is de novo routing, labeled tryptophan usually carries more explanatory power.
- If the question is precursor utilization after supplementation, the tracer should match the supplied precursor wherever possible.
This is why a good Metabolic Flux Analysis (MFA) workflow is not just "labeled metabolomics." It is pathway logic translated into experimental form.
Time-course design matters more than many studies admit
Isotope tracing works best as a kinetic experiment. A single late time point may show strong label incorporation but conceal whether entry was rapid, slow, delayed, or biphasic. A very early time point may show weak labeling and falsely suggest inactivity. The most useful information often comes from a time course that captures initial incorporation, pool expansion, and later equilibration.
This is especially important in NAD work because precursor uptake, salvage turnover, and downstream consumption can operate on different time scales. A tracer can enter rapidly while total pool size remains almost unchanged. Or the total pool can increase only after an earlier burst of incorporation has already passed. If the sampling window misses that timing, the biology becomes easy to misread.
Time-course design should therefore be aligned with the expected biology, not with instrument convenience. If the system is being exposed to acute stress, early points matter. If the study focuses on slower adaptation, later points become more informative. In either case, the tracer window should be chosen to answer a biological timing question rather than simply to fill a batch table.
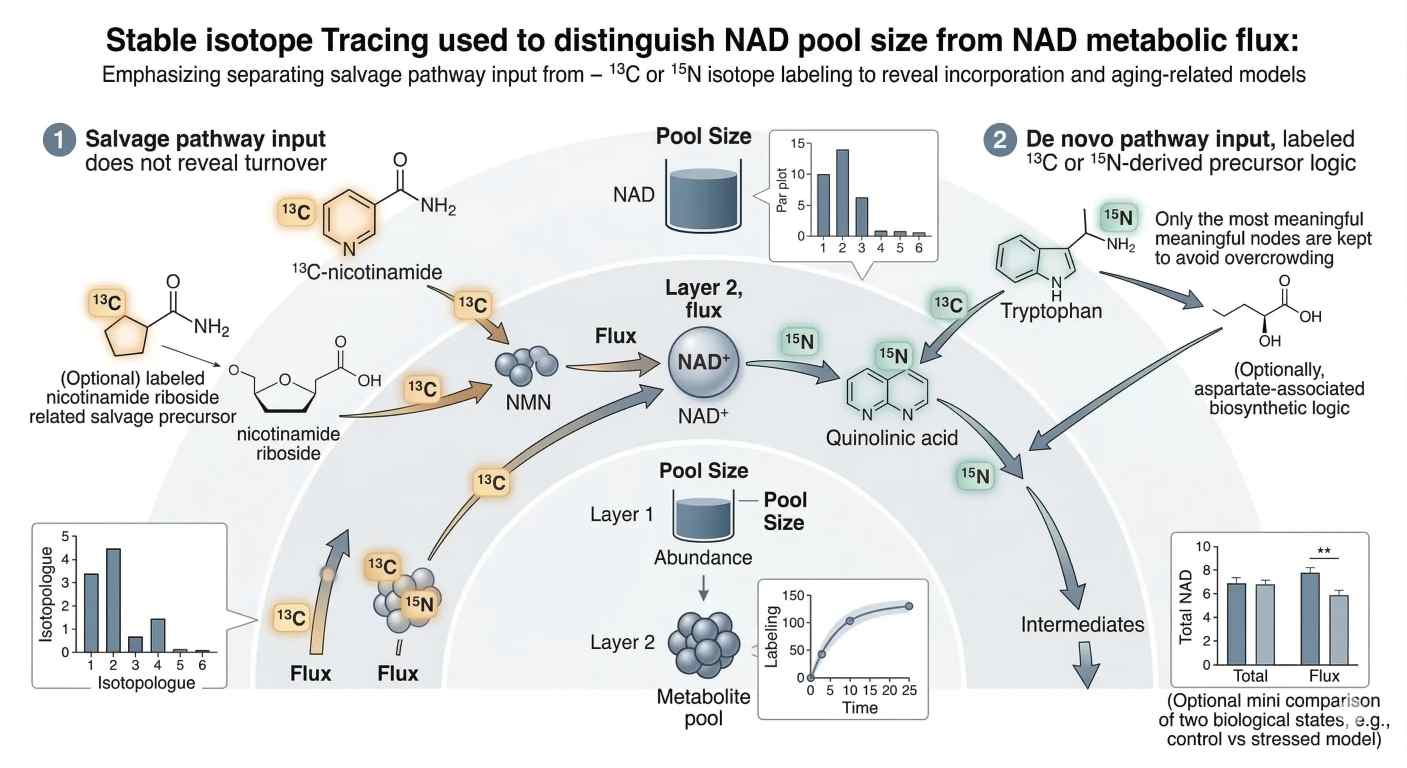 Figure 3. Stable isotope tracing workflow showing three required visual elements: labeled nicotinamide entering the salvage branch, labeled tryptophan entering the de novo branch, and a paired data layer that contrasts isotopologue incorporation over time with a separate static pool-size readout.
The third figure belongs here because the reader has now moved from static quantification into pathway dynamics. The image should make one point unmistakable: pool size and flux are related, but they are not interchangeable.
Isotopologue interpretation: where flux studies often go wrong
Flux analysis becomes powerful only when isotopologue data are interpreted carefully. The first common mistake is to treat any label incorporation as proof of pathway dominance. Incorporation shows entry, but it does not automatically show relative contribution without considering precursor enrichment, pool dilution, and sampling time.
The second common mistake is to ignore tracer purity and label scrambling. If the precursor pool is incompletely labeled, the downstream isotopologue pattern will be diluted from the start. If the biological system redistributes label through neighboring metabolic routes, the downstream pattern may no longer represent a clean one-step transfer. This does not make tracing useless. It means the interpretation has to respect how the tracer behaves inside the broader network.
The third mistake is to collapse pool size and flux into one conclusion. A rising M+ signal does not automatically mean the total NAD pool is rising. It may only mean newly synthesized molecules are entering a buffered pool. Conversely, an unchanged isotopologue pattern does not always mean flux is absent. The time window may be wrong, the precursor pool may be diluted, or the rate-limiting step may sit upstream of the measured interval. Recent tracing protocols emphasize that flux interpretation requires stable isotope precursor logic, time-course awareness, and explicit separation of synthesis and consumption.
A fourth mistake is to overlook precursor dilution in complex media or tissue environments. In cell culture, unlabeled nutrients already present in the medium can reduce effective tracer enrichment. In tissues, endogenous precursor pools can be large enough to buffer incoming label. In blood or perfusion-based systems, mixing and transport can add another dilution layer. If enrichment is not characterized or at least considered, downstream labeling can be under-read.
This is why a strong NAD flux study should not stop at labeled NAD+. It should evaluate precursor behavior, intermediate labeling when possible, and time-dependent isotopologue structure. The method becomes much more robust when tracer logic, matrix handling, and readout interpretation are designed together rather than assembled in pieces.
What a strong NAD flux workflow should actually measure
A strong flux study follows more than one node. The exact panel depends on the project, but the logic is consistent. If labeled nicotinamide appears in NMN and then in NAD+, salvage is active. If labeled tryptophan contributes downstream into later NAD biosynthetic intermediates and then into NAD+, de novo contribution is active. If label enters the pool while total abundance remains flat, turnover may be high while pool size stays buffered.
The strongest designs therefore combine three layers:
- pool measurement, to define abundance
- isotopologue measurement, to define incorporation
- contextual pathway interpretation, to explain why the pattern changed
That third layer is often the difference between a descriptive dataset and a mechanistic one. NAD metabolism does not sit alone. It intersects with central carbon metabolism, redox buffering, amino acid utilization, mitochondrial function, and stress signaling. When broader pathway context matters, the NAD dataset can be strengthened by Integrated Proteomics and Metabolomics Analysis or interpreted alongside Bioinformatics for Metabolomics when multiple states or time points are involved.
Choosing the right quantification platform
Not every NAD project needs the same platform. A rapid screening experiment, a mechanism-focused cell study, a tissue redox project, and an isotope-tracing study do not place equal demands on specificity, throughput, or pathway depth. The useful question is not which platform is best in the abstract. The useful question is which platform is defensible for the biological claim being made.
| Platform | Core strengths | Main limitations | Sensitivity / specificity | Throughput | Best-fit use case |
|---|---|---|---|---|---|
| Enzymatic colorimetric or cycling assay | Simple workflow, relatively low cost, easy adoption, useful for rapid directional screening | Narrow analyte scope, greater interference risk, limited pathway depth, weak fit for multiplex NADome questions | Moderate sensitivity, lower molecular specificity in complex matrices | High | Early screening when the goal is a broad directional change in total NAD(H) or a small set of predefined readouts |
| HPLC-UV | More chemically grounded than simple colorimetry, workable for selected targeted workflows, historically established | Lower sensitivity than LC-MS/MS, limited multiplexing, weaker performance in low-abundance or matrix-complex samples | Moderate specificity and moderate sensitivity | Moderate | Narrow targeted workflows with moderate sample complexity and modest sensitivity requirements |
| LC-MS/MS | High sensitivity, high specificity, multiplex capability, strong fit for NADome breadth, redox-aware workflows, isotope tracing, and internal-standard correction | Higher method complexity, stronger dependence on disciplined sample handling, more demanding optimization and validation | High sensitivity and high specificity | Moderate to high, depending on panel design | Precision quantification, challenging matrices, phosphorylated analytes, redox-state work, and stable isotope tracing |
The practical lesson is direct. If the question is simple and the matrix is forgiving, an enzymatic assay may be enough for early screening. If the project needs more chemical confidence but remains narrow, HPLC-UV can still be useful in selected workflows. But if the study asks about redox-state preservation, multi-analyte specificity, phosphorylated cofactors, internal-standard correction, or isotope-resolved incorporation, LC-MS/MS becomes the strongest analytical choice. Method papers and NADomics-focused reviews consistently emphasize the analytical challenge posed by pyridine nucleotide instability, matrix effects, and differential chemical behavior, and they position LC-MS-based workflows as the most capable route for high-specificity NADome analysis in biological samples.
From measurement to decision: what precision NAD metabolomics should mean
The phrase "precision NAD metabolomics" should not be used loosely. It should mean precision at three levels.
First, it should be precise at the sample level. That means quenching is fast, extraction is designed around instability, and oxidized and reduced forms are preserved as faithfully as possible.
Second, it should be precise at the analytical level. That means chromatography is chosen to match polarity, transitions are selected for specificity rather than convenience, and internal standards are used to correct for extraction and matrix effects.
Third, it should be precise at the interpretation level. That means concentration and flux are not confused, pathway routing is tested directly when needed, and conclusions about aging or metabolism are matched to the actual resolution of the data.
When these three layers align, NAD metabolomics becomes far more than a measurement of one cofactor pool. It becomes a framework for understanding how cells preserve redox balance, reroute precursors, respond to stress, and reorganize metabolism under pressure.
That is the analytical standard the field now needs. Generic statements that NAD is important no longer move the discussion forward. What matters is whether the workflow can preserve unstable analytes, quantify them selectively, and explain what the observed change actually means.
FAQ
What is the biggest source of error in NAD metabolomics?
In many studies, the largest source of error is pre-analytical handling rather than detector sensitivity. Slow quenching, inconsistent harvest timing, incomplete cooling, and post-extraction drift can distort NAD+/NADH and NADP+/NADPH relationships before the sample reaches the LC-MS system.
Why is total NAD+ concentration not enough?
Because concentration does not reveal pathway dynamics. A stable or increased NAD+ pool can still hide rapid turnover or high consumption. Stable isotope tracing is needed when the study must distinguish synthesis from breakdown or compare salvage against de novo input.
Is HILIC always better than reversed-phase LC for NAD metabolites?
Not always. HILIC is often a strong starting point because NAD-related analytes are highly polar, but ion-pairing or mixed-mode strategies can be useful when phosphorylated metabolites remain difficult to retain or resolve. The correct method depends on analyte set, matrix, and assay goal.
Why are isotope-labeled internal standards so important in NAD workflows?
Because NAD-related compounds are sensitive to extraction loss, matrix suppression, and instability. Stable isotope internal standards track those effects more faithfully than unrelated surrogates and therefore improve quantitative confidence.
Which tracer is most useful for salvage-pathway analysis?
Labeled nicotinamide is often the clearest salvage tracer because it enters the pathway through NMN and then into NAD+. The best tracer still depends on the exact biological question and the precursor environment of the model.
Which tracer is most useful for de novo NAD synthesis?
Labeled tryptophan is especially informative for de novo contribution because it enters upstream through the kynurenine-linked branch of NAD biosynthesis. It is often the most useful starting point when the study focuses on upstream pathway routing.
What validation checks matter most before trusting NADH/NADPH ratio data?
At minimum, the method should qualify harvest-to-quench timing, recovery in the real matrix, matrix effect, short-term extract stability, autosampler residence tolerance, and freeze-thaw behavior. Ratio claims are stricter than abundance-only claims because both numerator and denominator can drift during handling.
How should autosampler residence time be qualified in NAD metabolomics?
It should be challenged directly under the real run conditions of the study. This means defining how long processed extracts remain reliable in the autosampler and whether redox-sensitive analytes drift during that window. A sample that looks stable over a short pilot run may fail across a longer analytical batch.
When is an enzymatic NAD assay enough?
It is often sufficient for early screening or directional comparisons where speed and simplicity matter more than pathway depth. It becomes much less suitable when specificity, multiplexing, challenging matrices, phosphorylated analytes, or isotope tracing are central to the claim.
Can NAD metabolomics be integrated with broader multi-omics work?
Yes. It is often useful to interpret NAD changes alongside protein regulation, central carbon metabolism, or stress-response data. In mechanism-heavy studies, that broader view can be more informative than a single cofactor panel in isolation.
References
- Bustamante S, Jayasena T, Richani D, Gilchrist RB, Wu LE. Quantifying the cellular NAD+ metabolome using a tandem liquid chromatography mass spectrometry technique. Metabolomics. 2018;14:15. DOI: 10.1007/s11306-017-1310-z
- Trammell SAJ, Brenner C. NADomics: Measuring NAD+ and Related Metabolites Using Liquid Chromatography Mass Spectrometry. Life (Basel). 2021;11(6):512. DOI: 10.3390/life11060512
- Leung KSW, McCormick B, Ching J, et al. A Method to Monitor the NAD+ Metabolome—From Mechanistic to Advanced Research Applications. International Journal of Molecular Sciences. 2021;22(19):10598. DOI: 10.3390/ijms221910598
- Zhang X, Liu L, Wang Q, et al. Metabolic Pathway Tracing for NAD+ Synthesis and Consumption. In: Methods in Molecular Biology. 2025. DOI: 10.1007/978-1-0716-4534-5_14
- Yoshino J, Imai SI. Accurate Measurement of Nicotinamide Adenine Dinucleotide (NAD+) with High-Performance Liquid Chromatography. In: Methods in Molecular Biology. 2013. DOI: 10.1007/978-1-62703-637-5_14
- Nacham O, Brown JW, Maneshi MM, et al. A mixed-mode LC-MS-based method for comprehensive analysis of NAD and related metabolites from biological sample matrices. Scientific Reports. 2025. DOI: 10.1038/s41598-025-97834-2
- Cambronne XA, Kraus WL. Assays for NAD+-Dependent Reactions and NAD+ Metabolites. In: Methods in Molecular Biology. 2018. DOI: 10.1007/978-1-4939-8588-3_6
- Stein LR, Imai SI. Assays for Determination of Cellular and Mitochondrial NAD+ and NADH Content. In: Methods in Molecular Biology. 2021. DOI: 10.1007/978-1-0716-1433-4_15
Disclaimer: All workflows described here are intended for research use only and are framed for analytical and mechanistic study design.


