

The analysis of the metabolome—the complete collection of small-molecule substrates, intermediates, and products of cellular metabolism—depends entirely on our ability to ask a precise physical question of a biological sample. While the biological implications of a changed pathway are complex, the measurement itself is governed by a strict set of physical laws. To understand the output of a modern metabolomics experiment, one must step back from the biochemical pathway maps and look inside the mass spectrometer. This is not about simply listing instrument specifications. It is about understanding the thermodynamics of a charged droplet evaporating in a vacuum, the optics of an ion oscillating around a central spindle, and the algorithms that correct for the inevitable fluctuations in liquid pressure.
The information presented here focuses on the technical sovereignty required for high-confidence metabolite identification. For those designing experiments or reviewing data, a grasp of these underlying physics is the strongest defense against false discoveries and the surest path to reproducible results. Whether you are establishing an in-house pipeline or leveraging an external metabolomics service for specialized applications, the principles dictating data quality remain unchanged.
The Fluid Dynamics of Electrospray Ionization (ESI)
The journey of a metabolite from the aqueous environment of a cell lysate to the vacuum of a mass analyzer is violent, rapid, and governed by fluid dynamics. This step is often the most significant source of bias in a metabolomics dataset. The goal of ESI is to transfer analytes from the liquid phase to the gas phase as intact, charged species. The efficiency with which this happens varies molecule by molecule.
The Taylor Cone Formation and the Rayleigh Limit
At the tip of the stainless steel capillary, a high voltage potential—typically between two and five kilovolts—is applied. This field exerts a force on the ions in solution. In positive ion mode, anions are drawn toward the capillary wall while cations are driven toward the liquid surface and then downstream toward the mass spectrometer inlet. The liquid meniscus at the tip does not simply drip. The competing forces of the electric field pulling ions outward and the surface tension of the solvent holding the liquid together result in a distinctive conical shape known as the Taylor Cone.
From the apex of this cone, a fine jet of liquid emerges. This is where the physics becomes critical for the analyst. The jet is not stable. As the solvent evaporates from the surface of the droplets, the droplet radius shrinks while the total charge on the droplet remains constant. This increases the charge density. Eventually, the Coulombic repulsion between like charges on the surface exceeds the cohesive force of surface tension. This threshold is known as the Rayleigh Limit. When this limit is breached, the droplet undergoes Coulombic fission. It literally explodes into a spray of smaller, highly charged offspring droplets.
This process repeats in a cascading sequence of evaporation and fission until the droplet radius is small enough for the electric field at the surface to eject ions directly into the gas phase. This is the Ion Evaporation Model. Alternatively, under gentle source conditions common in native mass spectrometry, the solvent shell may evaporate completely, leaving the charge stranded on the analyte molecule. This is the Charged Residue Model. In standard metabolomics workflows using heated ESI sources, both mechanisms likely contribute simultaneously.
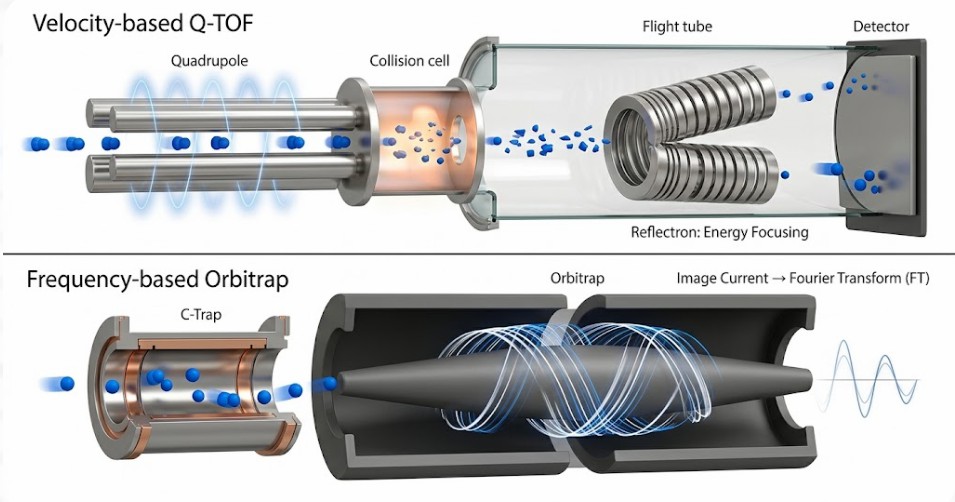 *Figure 1: Electrospray ionization droplet dynamics. The applied high voltage (2–5 kV) forms a Taylor Cone at the capillary tip (left). As the droplet travels toward the MS inlet, solvent evaporation reduces droplet radius while charge remains constant, driving the system toward the Rayleigh Limit. Coulombic fission (right) produces a cascade of smaller, highly charged offspring droplets, ultimately releasing gas-phase ions via the Ion Evaporation or Charged Residue mechanisms.*
Ionization Efficiency and the Bias of the Metabolome
Not all metabolites are created equal in the eyes of the ESI source. The physical chemistry of the molecule dictates whether it will charge and desorb efficiently or remain hidden in the background noise. The primary driver of response in positive ion mode is proton affinity. A molecule with a high gas-phase basicity—such as an amine—will readily strip a proton from the charged solvent droplets. Conversely, neutral lipids and sugars with low proton affinity may ionize poorly or only as sodium or ammonium adducts.
This introduces a phenomenon known as ionization suppression or ion competition. When multiple analytes co-elute from the liquid chromatography (LC) column and enter the source simultaneously, they compete for a finite amount of excess charge available on the droplet surface. A highly abundant species with high surface activity can monopolize the charge, effectively masking the signal of a less abundant but biologically critical metabolite.
Furthermore, the mobile phase composition dramatically alters this dynamic. Adjusting the pH of the LC eluent changes the protonation state of the analytes before they even reach the Taylor Cone. For an acidic metabolite like an organic acid, low pH suppresses ionization in negative mode by forcing the equilibrium toward the neutral state. This is why the choice of buffer and column chemistry is not merely a separation concern; it is a fundamental ionization parameter. When designing a study using a targeted approach like targeted metabolomics, mitigating this bias through careful calibration with internal standards is essential. In an untargeted metabolomics study, the bias is unavoidable, and researchers must interpret the absence of a peak with caution.
Technical Sovereignty: Mass Analyzer Architecture
Once the gas-phase ions pass through the heated capillary and the skimmer cone, they enter the high-vacuum region of the mass analyzer. Here, the goal shifts from ionization survival to precise measurement. Two architectures dominate high-resolution metabolomics: the Time-of-Flight (TOF) tube and the Orbitrap electrostatic trap. While both generate a mass spectrum, the physical principles by which they measure the mass-to-charge ratio (m/z) are fundamentally distinct, and these distinctions inform which instrument is better suited for a given experimental question.
Time-of-Flight (TOF) Physics and the Reflectron
The principle of a TOF analyzer is elegant in its simplicity. Ions are accelerated out of a pusher region by a pulsed electric field. All ions receive the same kinetic energy. Because kinetic energy equals one-half mass times velocity squared, ions with a smaller mass travel faster than ions with a larger mass. They drift through a field-free flight tube of a known length. The time it takes an ion to traverse that distance and strike the detector is measured with nanosecond precision. The m/z is calculated using the relationship: time equals distance divided by velocity.
However, this simple equation assumes that all ions of the same m/z receive exactly the same initial kinetic energy. In reality, ions are created with a distribution of initial kinetic energies. If left uncorrected, two ions of the same m/z would arrive at the detector at slightly different times, blurring the peak width and degrading resolution.
The solution is the Reflectron. This is an ion mirror located at the end of the flight tube, consisting of a series of ring electrodes with increasing voltage. An ion with higher kinetic energy penetrates deeper into this electrostatic mirror before being turned around. An ion with lower kinetic energy penetrates less deeply. The deeper penetration path is longer. By carefully tuning the voltage gradient of the reflectron, the flight times of ions with the same m/z but different initial energies are converged. They reach the detector simultaneously. This spatial and temporal focusing is the physical reason modern Q-TOF instruments achieve resolving powers exceeding 40,000 to 60,000 FWHM.
Orbitrap Ion Trapping and Axial Oscillation
The Orbitrap analyzer abandons the concept of time-of-flight measurement entirely. Instead, it traps ions in an electrostatic field and listens to their motion. Ions are injected tangentially into the gap between a central spindle-shaped electrode and an outer barrel-like electrode. The voltage applied to the central electrode creates a quadro-logarithmic potential distribution.
Ions in this trap exhibit complex motion. They orbit around the central electrode. Simultaneously, they oscillate back and forth along the axis of the central electrode. It is this axial oscillation frequency that is independent of the ion's initial energy and spatial distribution. This is the key to the Orbitrap's high mass accuracy and resolution.
As the ion packets oscillate along the axis, they induce a tiny electrical current in the split outer electrodes. This is the Image Current. The amplitude of this current over time is a complex transient signal representing the sum of all oscillation frequencies of all trapped ions. A Fourier Transform (FT) algorithm converts this time-domain signal into the frequency domain. Because frequency is inversely proportional to m/z, the final output is a mass spectrum. The longer the ions oscillate and the longer the transient is recorded, the higher the achievable resolution. Resolving powers of 240,000 or 480,000 at m/z 200 are routine in modern systems. This level of performance is particularly valuable when working with complex mixtures of isomeric or isobaric compounds, a common requirement in a comprehensive metabolomics research solution of gut microbiota.
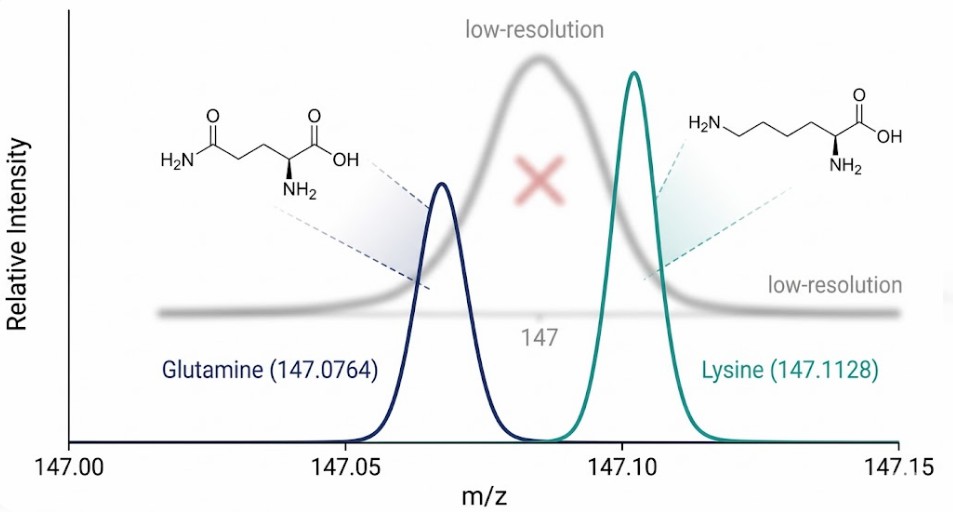 *Figure 2: Comparative ion optics of high-resolution mass analyzers. Top: Q-TOF separates ions by velocity in a field-free flight tube. The reflectron compensates for initial kinetic energy spread by forcing higher-energy ions to follow a longer path, achieving temporal focusing and resolving powers >40,000 FWHM. Bottom: Orbitrap traps ions in a quadro-logarithmic electrostatic field. Axial oscillation frequency is independent of initial conditions and is measured via image current detection followed by Fourier Transform, enabling resolving powers up to 480,000 at m/z 200.*
Variable Discussion: High Resolution vs. Scan Speed
The ability to achieve ultra-high resolution comes with a trade-off. In Fourier Transform mass spectrometry, resolution is directly proportional to the acquisition time of the transient. A 480k resolution scan requires a longer ion accumulation and detection period than a 60k resolution scan.
This creates a tension in untargeted metabolomics. Metabolites elute from an LC column in narrow peaks, often just three to ten seconds wide. To accurately define the chromatographic peak shape and obtain reliable quantification, the mass spectrometer must acquire a sufficient number of scans across that peak. Ideally, one wants at least ten to twelve data points across the peak.
If the analyst demands the maximum possible resolution for every scan, the scan rate slows down. This leads to under-sampling of the chromatographic peak. The peak apex may be missed, or the peak shape may appear jagged. Conversely, if the analyst prioritizes fast scanning to capture the LC peak profile, the resolution per scan must be reduced.
The optimal method involves finding the sweet spot. For a typical 30-minute LC gradient, a resolution setting of 60,000 to 120,000 provides the necessary specificity to distinguish isobaric interferences (as discussed next) while maintaining a scan rate of 3 to 5 Hz. This ensures robust peak integration. The physical necessity of this resolution becomes clear when examining specific metabolite pairs.
Proving the Necessity: Glutamine vs. Lysine
Why is a resolution of 100,000 non-negotiable? Consider the amino acids Glutamine and Lysine. They have different elemental compositions. Glutamine is C5H10N2O3. Lysine is C6H14N2O2. Despite being chemically distinct, their nominal mass is identical: 146 Daltons. In a low-resolution instrument, such as a single quadrupole or an ion trap operating at unit resolution, these two compounds appear as a single peak. The mass spectrometer reports m/z 147 for both.
A high-resolution instrument reveals the truth. The accurate mass of the protonated molecule [M+H]⁺ for Glutamine is 147.0764. The accurate mass for Lysine [M+H]⁺ is 147.1128. The mass difference between them is 0.0364 Daltons.
To separate these two peaks completely, the mass spectrometer must have a resolving power sufficient to distinguish this small mass difference. The required resolution is calculated as m divided by delta m. In this case, 147 divided by 0.0364 equals roughly 4,000. This seems low. However, to achieve baseline resolution where the peaks do not overlap and interfere with accurate quantification of the smaller peak, a resolution of 10 to 20 times higher is required. A resolution of 100,000 ensures that the valley between these two peaks is deep and clean.
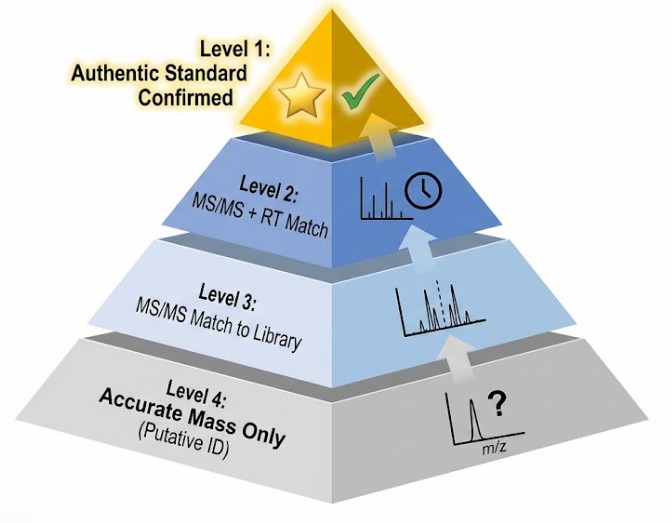 *Figure 3: High-resolution mass spectrum demonstrating baseline separation of the isobaric pair Glutamine ([M+H]⁺ = 147.0764) and Lysine ([M+H]⁺ = 147.1128). The mass difference (Δm = 0.0364 Da) requires a resolving power of >60,000 FWHM for unambiguous separation. Without this resolution, co-eluting Lysine would suppress or mask trace-level Glutamine signal, leading to false negatives in untargeted metabolomics studies.*
Without this physical separation, the software may mis-assign the feature or, worse, the ion signal of abundant Lysine could suppress the detection of trace-level Glutamine in a serum untargeted metabolomics experiment. This is why the hardware specifications are not just marketing numbers. They are a direct reflection of the physics required to answer biological questions with confidence.
Technical Sovereignty: Data Processing and Alignment Kinetics
The output of the mass analyzer is not a list of metabolites. It is a torrent of digital noise and signal. A typical one-hour untargeted metabolomics run generates several gigabytes of profile data. Transforming this raw data into a matrix of identified features is a computational challenge that demands as much rigor as the instrumental physics.
Peak Picking and the Signal-to-Noise Threshold
The detector records a continuous stream of intensity values over time. In profile mode, a peak appears as a smooth curve of many data points. While this contains all the information, it is inefficient for storage and downstream statistics. The first step is Centroiding. The software reduces the continuous curve to a single vertical bar at the centroid of the peak area. This reduces file size but requires robust algorithms to distinguish a true chromatographic peak from random electronic noise.
The mathematics of the Signal-to-Noise ratio (S/N) governs this process. A peak is only considered if its intensity rises significantly above the baseline fluctuation. For low-abundance metabolites, the S/N may hover just above the limit of detection. Setting the peak-picking threshold too low results in thousands of false features from chemical or electronic background. Setting it too high eliminates the very trace-level biology the experiment was designed to find. In the context of unknown metabolites identification, a conservative but sensitive S/N filter is critical to avoid wasting validation time on artifacts.
Retention Time Alignment Across Cohorts
A typical metabolomics study involves dozens or hundreds of injections. Despite the best efforts of modern UHPLC pumps, minute fluctuations in pressure, temperature, and column aging cause the exact same metabolite to elute at slightly different retention times (RT) across the run sequence. An RT drift of just two or three seconds is enough to break the software's ability to link features between samples.
To correct this, computational tools like XCMS and MZmine employ nonlinear warping algorithms. These algorithms look for a consensus of landmark features—peaks that appear in every sample. The software then applies a warping function to the time axis of each sample. It stretches or compresses the timeline locally so that the landmark peaks align perfectly.
The physical model underlying this is similar to Dynamic Time Warping (DTW). The goal is to ensure that the ion with m/z 147.0764 at 5.2 minutes in Sample A is aligned with the same ion at 5.4 minutes in Sample B. Without this alignment kinetics step, the statistical analysis would treat these as two different compounds. The variance within the biological group would appear artificially high, masking real biological differences. This is a non-negotiable step in bioinformatic analysis for metabolomics study.
Technical Sovereignty: Structural Elucidation and Library Logic
The alignment of peaks and the calculation of accurate masses bring the analyst to a critical juncture. A list of features with m/z and retention time coordinates is not yet biological knowledge. The final step in the mass spectrometry pipeline is the conversion of these coordinates into a named, identified metabolite. This process, known as structural elucidation, relies on a combination of gas-phase ion chemistry and vast spectral databases. For additional insights into fragmentation strategy, explore our in-depth resource.
The Mobile Proton Model and In-Silico Fragmentation
When a metabolite ion is selected for fragmentation in a tandem mass spectrometry experiment, it undergoes collisions with neutral gas atoms—typically nitrogen or argon. This process, Collision Induced Dissociation (CID) or Higher-Energy Collisional Dissociation (HCD), deposits internal energy into the ion. The ion does not break randomly. It follows predictable pathways dictated by thermodynamics.
The dominant model explaining this behavior in protonated peptides and many metabolites is the Mobile Proton Model. Upon collisional activation, the added proton is not fixed to a single site. It becomes mobile along the molecular backbone, hopping between basic sites such as the amide nitrogen of a peptide bond or the oxygen of a carbonyl group.
The migration of this proton weakens the chemical bond adjacent to its location. In a peptide, when the proton localizes on the amide nitrogen, it catalyzes the cleavage of the adjacent carbon-nitrogen bond. This predictable cleavage produces a set of complementary fragment ions: the N-terminal fragment (b-ion) and the C-terminal fragment (y-ion).
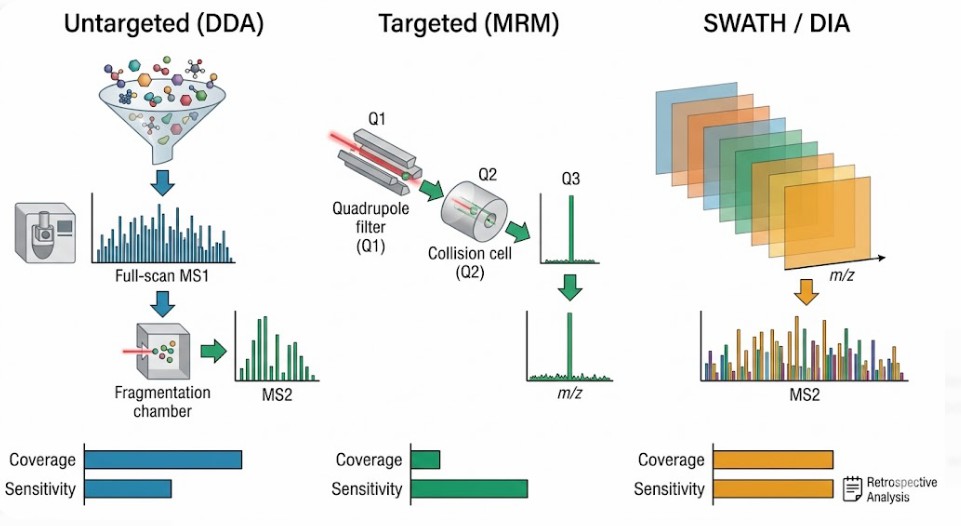 *Figure 4: The Mobile Proton Model of collision-induced dissociation (CID). Upon activation, the added proton migrates along the molecular backbone to sites of high gas-phase basicity. Localization of the proton at a specific bond (e.g., amide nitrogen) weakens that bond, catalyzing cleavage and producing diagnostic fragment ions. This predictable fragmentation forms the basis of MS/MS spectral library matching and in silico prediction tools.*
This physics-driven fragmentation pattern serves as a unique fingerprint. For a small molecule metabolite, the breaking points reveal the position of functional groups. For a lipid, it reveals the length of fatty acyl chains and the identity of the head group. Computational tools can now perform in-silico fragmentation prediction. Given a chemical structure, the software applies heuristic rules based on the Mobile Proton Model to simulate the expected MS/MS spectrum. Comparing the predicted spectrum to the experimental spectrum provides a score of confidence. This is a cornerstone of workflows like MS/MS based sequencing of peptides, where the correct assignment of fragment ions verifies the primary amino acid sequence.
Database Mapping and the Spectral Mirror Score
The experimental MS/MS spectrum is compared against a library of reference spectra from authenticated chemical standards. The three pillars of public metabolomics libraries are METLIN, the Human Metabolome Database (HMDB), and MassBank. These repositories contain hundreds of thousands of spectra collected under various collision energies and instrument types.
The comparison is not a simple yes or no match. It is a quantitative assessment using a similarity metric, often visualized as a mirror plot. The software plots the experimental spectrum pointing upward and the reference spectrum pointing downward. The algorithm calculates a similarity score—the dot product or cosine score—that measures the alignment of peak intensities and m/z values.
A perfect match has a score of 1000 or 1.0, depending on the scale. In practice, due to variations in collision energy and instrument tuning, a score above 750 or 0.75 is often considered a high-confidence match for Level 2 identification according to Metabolomics Standards Initiative (MSI guidelines).
However, the physics of the instrument imposes limitations. An Orbitrap using HCD may produce a spectrum with a different intensity distribution than a Q-TOF using CID. The higher energy deposition in HCD can reduce the intensity of labile fragments and enhance others. This is why matching against libraries collected on the same instrument platform yields higher scores. For absolute confidence, Level 1 identification requires the analysis of an authentic chemical standard on the same instrument platform, verifying that both the retention time and the fragmentation pattern match. This rigorous validation workflow is standard practice in a targeted metabolomics assay designed for absolute quantification.
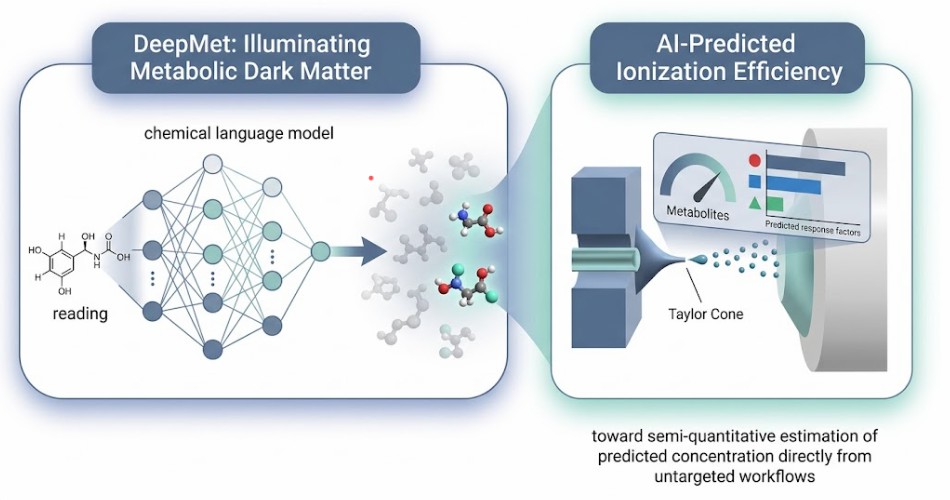 *Figure 5: Spectral mirror plot for library-based metabolite identification. The experimental MS/MS spectrum (upper trace, positive intensity) is compared against a reference library spectrum (lower trace, inverted). The dot product or cosine similarity score quantifies the alignment of fragment m/z values and relative intensities. A score >750 (or >0.75) indicates high-confidence Level 2 identification per MSI guidelines, pending validation with authentic standards for Level 1.*
Comparative Strategy: Untargeted Discovery vs. Targeted Quantitation
The choice between an untargeted (discovery) approach and a targeted (validation) approach defines the entire experimental workflow. This is not simply a choice of software settings. It is a choice of ion optics strategy. The two dominant modes are Data-Dependent Acquisition (DDA) for untargeted analysis and Multiple Reaction Monitoring (MRM) for targeted analysis.
In a DDA experiment, the mass spectrometer alternates between a high-resolution full scan (MS1) and a series of fragmentation scans (MS2). The instrument selects the top most intense ions from the MS1 scan to isolate and fragment. This is an exploratory mission. It generates a comprehensive map of the detectable metabolome. However, the stochastic nature of peak selection means that low-abundance ions co-eluting with a highly abundant matrix ion may never trigger an MS2 scan. Their identity remains a mystery. This is a significant limitation in complex samples like urine, where urine untargeted metabolomics must contend with a massive dynamic range of salt and metabolite concentrations.
In an MRM experiment, the instrument does not scan. It filters. The first quadrupole (Q1) is fixed to transmit only the precursor m/z of the target metabolite. The collision cell (Q2) fragments this specific ion. The third quadrupole (Q3) is fixed to transmit only a specific fragment ion from that target. This double filtration removes the vast majority of chemical background. The detector integrates the signal of that single transition over time. The result is a dramatic increase in signal-to-noise ratio and a dynamic range that extends over four to five orders of magnitude.
The trade-off is stark. MRM, also known as SRM, provides unparalleled sensitivity and precision for quantification but requires prior knowledge of the target's exact m/z and fragmentation behavior. It is not a discovery tool. A SRM and MRM assay can quantify femtomolar levels of a known metabolite but cannot detect an unexpected one.
For studies that demand both discovery power and quantitative precision, newer acquisition strategies have emerged. Sequential Window Acquisition of All Theoretical Mass Spectra (SWATH-MS) represents a hybrid approach. Rather than selecting specific peaks like DDA, the instrument cycles through wide isolation windows, fragmenting everything within a defined m/z range. This generates a complete digital record of all fragment ions from all precursors. The data analysis is performed retrospectively. This approach is gaining traction in DIA quantitative proteomics service and is increasingly applied in metabolomics as the computational tools for deconvolution mature.
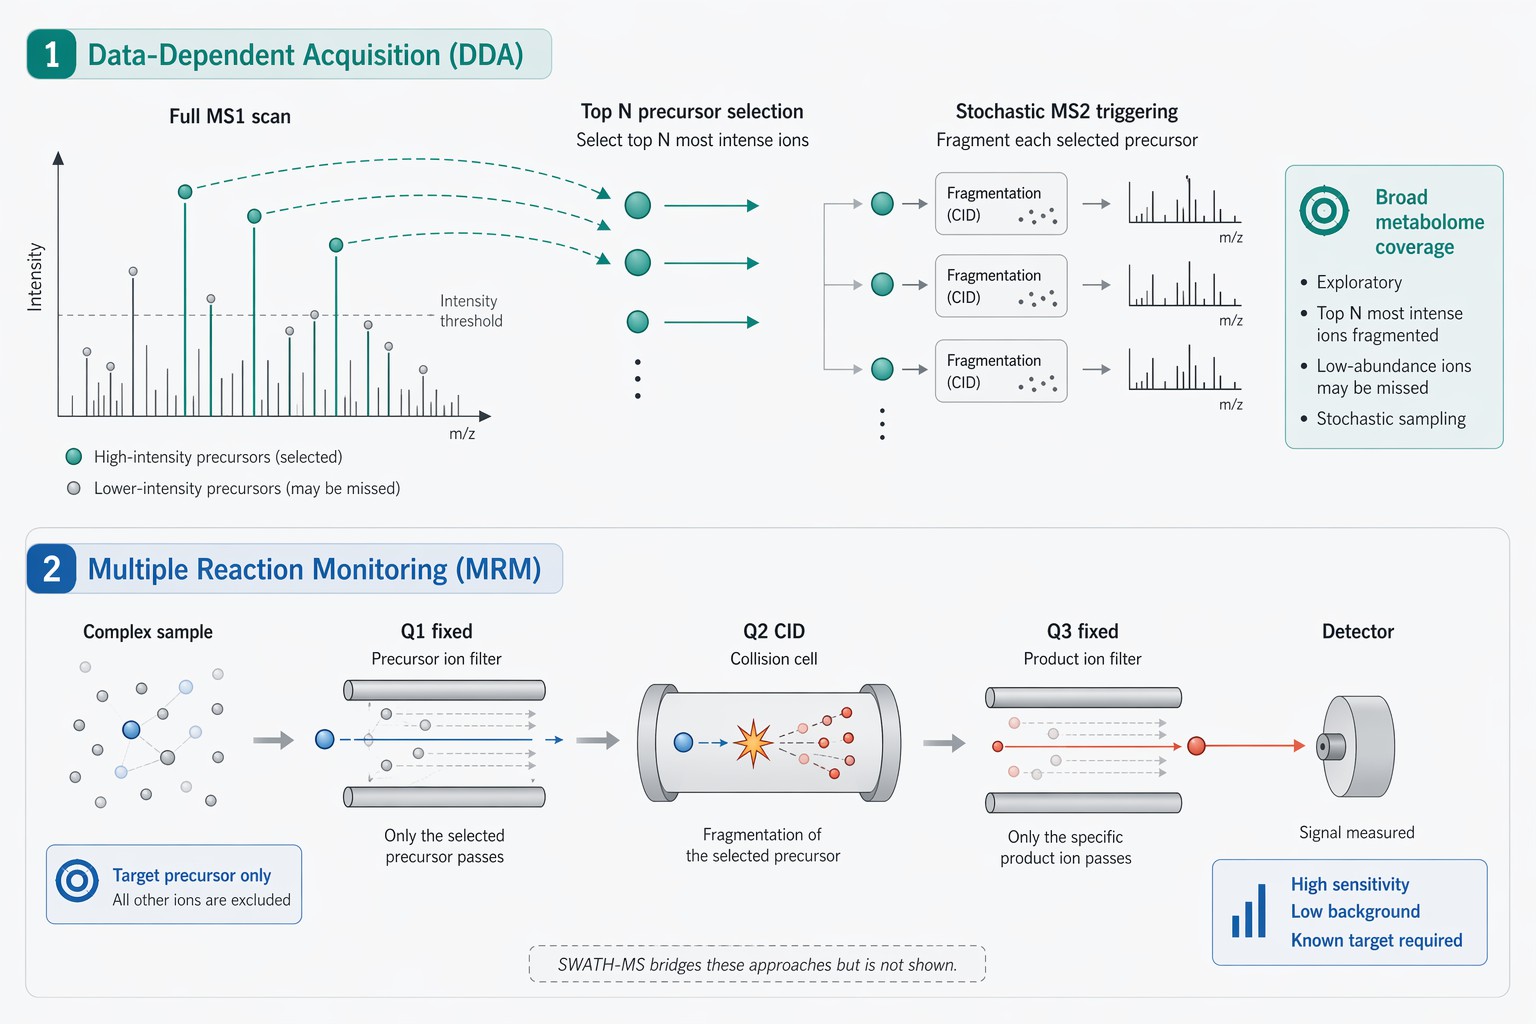 *Figure 6: Ion optics workflow comparison: Data-Dependent Acquisition (DDA, top) versus Multiple Reaction Monitoring (MRM, bottom). DDA performs full MS1 scans followed by stochastic MS2 triggering of the most abundant precursors, enabling broad metabolome coverage but limited dynamic range. MRM fixes Q1 and Q3 to specific precursor/product m/z pairs, filtering out all other ions and achieving femtogram-level sensitivity and 5–6 orders of linear dynamic range. SWATH-MS (not shown) bridges these modes by fragmenting all precursors within wide isolation windows for retrospective analysis.*
The following table consolidates the physical and practical distinctions between the primary workflows, including the hybrid SWATH-MS approach.
| Parameter | Untargeted (DDA) | Targeted (MRM/SRM) | SWATH-MS (Hybrid) |
|---|---|---|---|
| Ion Optics Mode | Full Scan MS1 + Top N MS2 | Q1 Fixed Filter -> Q2 CID -> Q3 Fixed Filter | Sequential wide-window isolation |
| Metabolome Coverage | High (Thousands of features) | Low (Dozens to hundreds) | Comprehensive |
| Sensitivity (LOD) | Moderate (pg/mL) | High (fg/mL) | High |
| Dynamic Range | 3-4 orders of magnitude | 5-6 orders of magnitude | 4-5 orders |
| Data Processing Load | Heavy (Peak picking, alignment, ID) | Light (Peak integration only) | Moderate |
| Primary Use Case | Hypothesis generation; Biomarker discovery | Hypothesis testing; Absolute quantification | Discovery + Retrospective Quant |
| Physical Limitation | Stochastic MS2 triggering; Ion suppression | Requires prior knowledge of precursor/product m/z | Requires deconvolution software |
For a complete metabolomics service, the decision of which approach to apply is often resolved through a tiered strategy. A small pilot cohort is analyzed using LC-MS/MS untargeted metabolomics to discover potential biomarkers. Subsequently, the identified candidates are validated in a larger cohort using a custom-developed targeted MRM panel.
Conclusion: Integrating Physics into Practice
The successful extraction of biological meaning from a metabolomics experiment is not a function of following a generic standard operating procedure. It is a function of understanding the physical constraints at each stage of the analytical pipeline. From the surface tension at the Taylor Cone tip to the Fourier Transform of an image current in an Orbitrap, the data are shaped by the instrument's physics as much as by the underlying biology.
Ignoring these principles leads to common pitfalls: the misinterpretation of ion suppression as biological downregulation, the conflation of isobaric species due to insufficient resolution, and the misalignment of features due to poor retention time correction. Acknowledging these principles allows the researcher to design robust experiments, whether they are performing in-house analysis or collaborating with a core facility. By applying this technical sovereignty, the field can move beyond merely listing peaks and toward a deeper, more accurate understanding of the metabolic state.
Frequently Asked Questions
1. What is the fundamental difference between profile and centroid mode data acquisition?
Profile mode records the continuous analog signal of the detector, producing a smooth curve of intensity over m/z. This preserves the peak shape information but generates very large file sizes. Centroid mode processes the raw profile data in real-time, calculating the center of mass for each peak and storing only a single m/z and intensity value as a stick representation. Centroid data is sufficient for most metabolomics applications and is far more efficient for downstream data processing and alignment.
2. Why does my internal standard show different response factors in different samples?
This is the signature of ion suppression. Co-eluting matrix components from the specific biological sample alter the efficiency of droplet charging in the ESI source. If a matrix component is highly surface-active, it can out-compete your internal standard for charge. This is why stable isotope-labeled (SIL) internal standards that co-elute exactly with the target analyte are the gold standard. They experience the same suppression as the target, effectively canceling out the matrix effect during ratio calculation.
3. Can I identify a metabolite without an MS/MS spectrum?
This is considered Level 3 or Level 4 identification according to MSI guidelines. Using only accurate mass (MS1) allows for a putative annotation based on matching m/z to a database within a narrow mass tolerance, often less than 5 ppm. However, many isomeric compounds share the exact same accurate mass. Without the diagnostic fragmentation pattern from an MS/MS spectrum, the identification remains tentative. Reliable publication usually requires MS/MS matching (Level 2) or comparison to a standard (Level 1).
4. How does the choice of LC column length affect my metabolomics data?
Column length is a trade-off between resolution and speed. A longer column (e.g., 150 mm or 250 mm with sub-2 micron particles) provides higher peak capacity and better separation of complex mixtures, which directly mitigates ion suppression. However, it increases backpressure and extends run time. A shorter column (e.g., 50 mm or 100 mm) provides faster gradients and higher throughput but may sacrifice separation of critical isobars or isomers.
5. What is the physical cause of mass accuracy drift during a long batch?
Temperature fluctuations in the laboratory cause thermal expansion or contraction of the mass analyzer components. In a TOF, a change of just a fraction of a degree alters the length of the flight tube, changing the ion flight time. In an Orbitrap, temperature changes alter the voltage stability and electrode dimensions. Modern instruments compensate for this using a lock mass—a known reference compound infused continuously or periodically to recalibrate the mass axis in real time.
6. Is a higher mass resolution always better?
Not always. While higher resolution provides better selectivity for isobaric compounds, it comes at the cost of scan speed. If the scan speed is too slow relative to the chromatographic peak width, the peak will be under-sampled, leading to inaccurate quantification. The optimal resolution is the minimum required to separate the analytes of interest while maintaining sufficient data points across the LC peak for robust peak integration.
7. Can metabolomics distinguish between isomers like leucine and isoleucine?
Accurate mass alone cannot distinguish leucine from isoleucine. They are structural isomers with the exact same elemental composition. In a standard reversed-phase LC-MS run, they also often co-elute. To differentiate them, one must either have a chromatographic method that baseline separates them (challenging for these specific amino acids) or rely on subtle differences in their MS/MS fragmentation patterns. Alternatively, specialized techniques like Ion Mobility Spectrometry (IMS) can separate them based on their collisional cross-section (shape) in the gas phase.
8. How many biological replicates do I need for a robust metabolomics study?
This depends on the biological variance of the system. For cell culture experiments with low technical variance, n equals 5 to 6 per group is often statistically sufficient for multivariate analysis. For animal studies or human cohorts, where genetic and environmental variance is high, n equals 10 to 20 per group is more appropriate to achieve sufficient statistical power to detect moderate fold-changes.
References
- Gowda, G. A. N., & Djukovic, D. (2014). Overview of mass spectrometry-based metabolomics: opportunities and challenges. Methods in Molecular Biology, 1198, 3-12. DOI: 10.1007/978-1-4939-1258-2_1
- Cajka, T., & Fiehn, O. (2016). Toward Merging Untargeted and Targeted Methods in Mass Spectrometry-Based Metabolomics and Lipidomics. Analytical Chemistry, 88(1), 524–545. DOI: 10.1021/acs.analchem.5b04491
- Zubarev, R. A., & Makarov, A. (2013). Orbitrap mass spectrometry. Analytical Chemistry, 85(11), 5288–5296. DOI: 10.1021/ac4001223
- Tsugawa, H., Cajka, T., Kind, T., Ma, Y., Higgins, B., Ikeda, K., ... & Arita, M. (2020). MS-DIAL: data-independent MS/MS deconvolution for comprehensive metabolome analysis. Nature Methods, 17(7), 661–663. DOI: 10.1038/s41592-020-0858-0
- Smith, C. A., Want, E. J., O'Maille, G., Abagyan, R., & Siuzdak, G. (2006). XCMS: processing mass spectrometry data for metabolite profiling using nonlinear peak alignment, matching, and identification. Analytical Chemistry, 78(3), 779–787. DOI: 10.1021/ac051437y
- Benton, H. P., Ivanisevic, J., Mahieu, N. G., Kurczy, M. E., Johnson, C. H., Franco, L., ... & Siuzdak, G. (2015). Autonomous metabolomics for rapid metabolite identification in global profiling. Analytical Chemistry, 87(2), 884–891. DOI: 10.1021/ac5025649
- Sumner, L. W., Amberg, A., Barrett, D., Beale, M. H., Beger, R., Daykin, C. A., ... & Viant, M. R. (2007). Proposed minimum reporting standards for chemical analysis. Metabolomics, 3(3), 211–221. DOI: 10.1007/s11306-007-0082-2
- Schymanski, E. L., Jeon, J., Gulde, R., Fenner, K., Ruff, M., Singer, H. P., & Hollender, J. (2014). Identifying small molecules via high resolution mass spectrometry: communicating confidence. Environmental Science & Technology, 48(4), 2097–2098. DOI: 10.1021/es5002105


















