

Glycolysis is the central metabolic pathway that converts one molecule of glucose into two molecules of pyruvate, generating ATP and NADH. The pathway is regulated at three irreversible enzymatic steps — hexokinase, phosphofructokinase-1 (PFK-1), and pyruvate kinase — through allosteric modulation by energy metabolites and hormone-driven signaling cascades. The existing resource on this topic provides a comprehensive textbook-level review of these control mechanisms. This guide builds on that knowledge by focusing on the analytical side: how to quantify glycolytic intermediates by LC-MS/MS, how to design isotope tracing experiments for glycolytic flux measurement, and how to interpret the resulting data in the context of cancer metabolism research and preclinical drug discovery. The intended reader is a researcher who already understands the regulatory biochemistry of glycolysis and now needs the analytical methodology to measure those metabolic changes in their experimental system.
Targeted metabolomics services provide validated LC-MS/MS methods for glycolytic intermediate quantification across multiple research sample types. All methods and workflows described in this guide are for research use only.
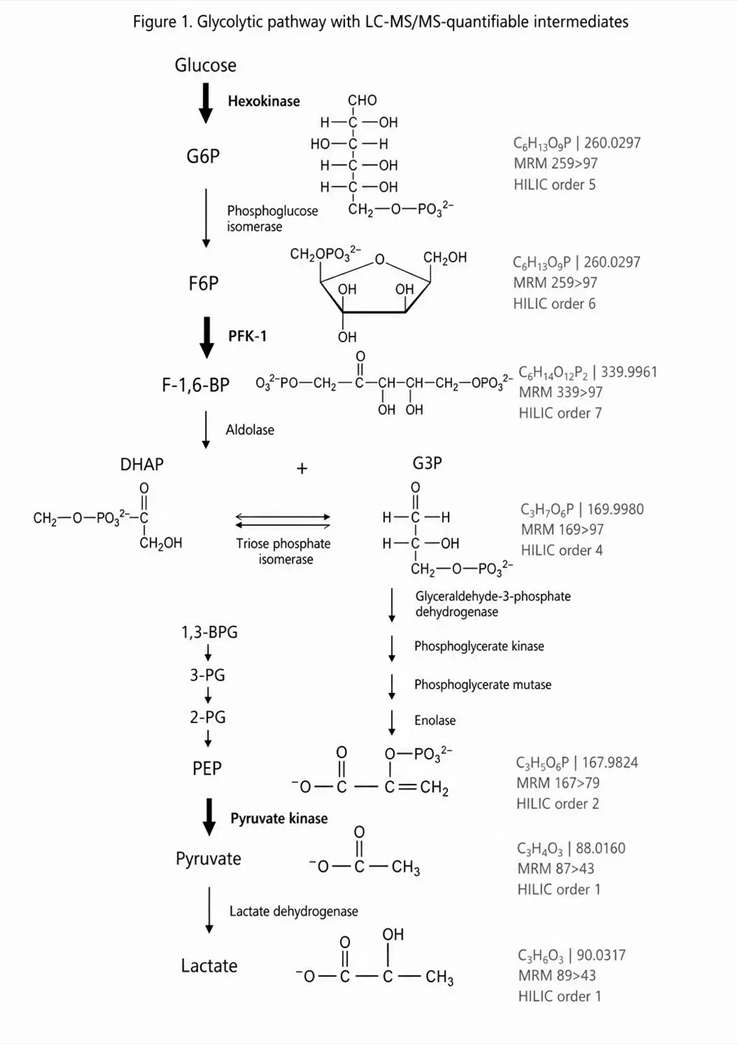 Figure 1: The glycolytic pathway — 10 enzymatic steps with 7 quantifiable intermediates highlighted for LC-MS/MS analysis
This Is Not a Textbook Review of Glycolysis
The existing resource on glycolysis regulation already covers: PFK-1 allosteric regulation by ATP, citrate (inhibition) and AMP, F-2,6-BP (activation), the bifunctional enzyme PFKFB3 and its role in F-2,6-BP synthesis, hexokinase and glucokinase tissue-specific regulation, pyruvate kinase regulation by F-1,6-BP and phosphorylation, the Xylulose 5-Phosphate-mediated regulation of glucose metabolism, and the hormonal control by insulin, glucagon, and adrenaline. This guide does not repeat those topics.
Instead, it addresses the practical question that arises after understanding regulatory mechanisms: how to design experiments that measure the abundance and flux of glycolytic intermediates in biological samples. For researchers investigating the Warburg effect in cancer metabolism, evaluating glycolytic inhibitors in preclinical drug discovery, or using glycolytic metabolites as research biomarkers of metabolic phenotype, the ability to accurately quantify these intermediates by LC-MS/MS is essential. Each section of this guide corresponds to a specific experimental scenario — from initial method selection through sample preparation, LC-MS/MS quantification, and data interpretation — providing a self-contained workflow for any researcher planning a glycolysis-related metabolomics study. The focus throughout is on practical considerations: which chromatographic conditions separate the isomeric intermediates, which MRM transitions provide the highest selectivity, how to interpret the resulting L/P ratio in the context of enzyme-level regulatory changes, and how to design a targeted experiment that matches the specific research question rather than applying a generic metabolomics workflow.
The Glycolytic Pathway at a Glance — Key Regulatory Nodes and Measurable Intermediates
Of the 10 enzymatic steps in glycolysis, seven intermediates are routinely quantifiable by LC-MS/MS with appropriate chromatographic separation and mass spectrometric detection. Each intermediate presents distinct analytical challenges due to its chemical properties.
Glucose-6-phosphate (G6P) and Fructose-6-phosphate (F6P): These hexose monophosphates are constitutional isomers (both C₆H₁₃O₉P, monoisotopic mass 259.0219 Da) that cannot be distinguished by mass alone. Their separation requires hydrophilic interaction liquid chromatography (HILIC) with sufficient resolution between the two isomers — typically achievable on a BEH Amide column with an ammonium hydroxide-based mobile phase. G6P and F6P interconvert rapidly through phosphoglucose isomerase; sample preparation must quench this enzyme activity immediately to avoid ratio distortion.
Fructose-1,6-bisphosphate (F-1,6-BP): The doubly phosphorylated intermediate (C₆H₁₄O₁₂P₂, monoisotopic mass 339.0062 Da) has stronger retention on HILIC than the monophosphates due to additional phosphate groups. F-1,6-BP is the product of the PFK-1 regulatory step and its abundance reports on the commitment to glycolytic flux.
Dihydroxyacetone phosphate (DHAP) and Glyceraldehyde-3-phosphate (G3P): These triose phosphates (C₃H₇O₆P, monoisotopic mass 169.0144 Da) are isomers that interconvert through triose phosphate isomerase. DHAP is more stable than G3P, which rapidly degrades under alkaline conditions. Most quantitative methods report the sum of DHAP + G3P as a single analytical value due to the rapid equilibrium between them, measuring both as a single peak after ensuring complete conversion.
Phosphoenolpyruvate (PEP): The high-energy enol phosphate (C₃H₅O₆P, monoisotopic mass 166.9753 Da) is chemically unstable — hydrolysis of the enol phosphate bond occurs rapidly at pH >7.5, producing pyruvate. Sample extracts must be maintained at pH 4-5 for accurate PEP quantification. PEP is detectable in negative ion mode at high sensitivity due to its strong acidity. For additional insights into pyruvic acid sources, explore our in-depth resource.
Pyruvate and Lactate: The terminal metabolites of glycolysis. Pyruvate (C₃H₄O₃, 87.0088 Da) interconverts with lactate (C₃H₆O₃, 89.0244 Da) through lactate dehydrogenase (LDH). The lactate/pyruvate (L/P) ratio is the most commonly used single-index measure of the cellular NADH/NAD⁺ redox state and directly reflects the intensity of aerobic glycolysis. Both are detected in negative ion mode with high sensitivity, and they are the easiest glycolytic intermediates to quantify by LC-MS/MS.
Glycolysis pathway analysis services provide validated quantification of all seven intermediates in a single LC-MS/MS run.
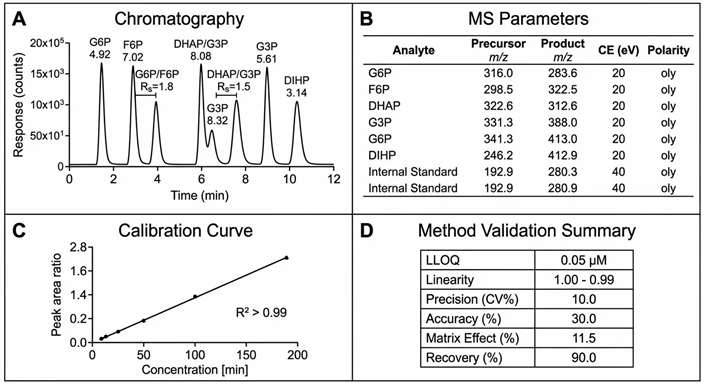 Figure 2: HILIC-MS/MS method parameters — chromatography conditions, MRM transitions, and validation data
Analytical Challenges in Glycolytic Intermediate Quantification
Glycolytic intermediates share chemical features that make their LC-MS/MS quantification fundamentally more challenging than quantifying hydrophobic metabolites.
Ionization in negative mode: All seven intermediates contain phosphate or carboxylate groups that ionize in negative electrospray (ESI⁻). The response is generally lower than positive-mode detection because the ion current is distributed across multiple charge states and adduct forms. For F-1,6-BP, the most abundant ion is the doubly charged [M-2H]²⁻ at m/z 169.0, not the singly charged [M-H]⁻. MRM transitions must be designed for the correct charge state to achieve maximum sensitivity. The ESI source parameters — spray voltage (typically 2.5-3.5 kV in negative mode), sheath gas flow (40-50 arbitrary units), auxiliary gas flow (10-15 AU), and capillary temperature (300-350°C) — must be optimized for phosphorylated metabolite detection. A capillary temperature that is too high (>350°C) can cause in-source fragmentation of thermolabile compounds such as F-1,6-BP, producing a false signal at the DHAP/G3P m/z. LC-MS/MS method development services provide ESI parameter optimization for challenging metabolite classes.
Isomer separation: Three pairs of isomers in the glycolytic pathway — G6P/F6P, DHAP/G3P, and the enol forms of PEP — require chromatographic resolution of isomers that differ only in the position of a phosphate group or a double bond. HILIC using an amide-bonded stationary phase at pH 9-10 resolves all three pairs within a 12-minute gradient. Ion pairing chromatography using tributylamine or dimethylhexylamine provides alternative separation but introduces ion suppression from the ion-pairing reagent that cannot be fully removed.
Stability during sample processing: Half of the seven intermediates are chemically or enzymatically unstable at room temperature. PEP hydrolyzes with a half-life of approximately 15 minutes at pH 7.4. G3P degrades within 30 minutes at 25°C. G6P and F6P continue to interconvert through residual enzyme activity as long as phosphoglucose isomerase is not denatured. The entire sample preparation workflow from tissue/cell harvesting to final extract storage at -80°C must be completed within 5 minutes at 0-4°C to preserve the native intermediate distribution. Targeted metabolomics sample preparation services use validated cold-quenching protocols optimized for glycolytic intermediate stability.
Matrix interferences: In plasma and tissue extracts, high-abundance metabolites such as nucleotide mono- and diphosphates, phosphorylated sugars from the pentose phosphate pathway, and phospholipid fragments form overlapping MRM transitions with glycolytic intermediates at the same nominal m/z. High-resolution MS2 (resolution ≥30,000) or orthogonal LC separation is required to resolve these interferences. LC-MS/MS untargeted metabolomics services provide full-scan HRMS data acquisition suitable for detecting and resolving these matrix interferences.
Internal standard strategy: The preferred approach is isotope dilution using ¹³C-labeled glycolytic intermediates. U-¹³C-glucose and U-¹³C-lactate are commercially available and serve as internal standards for all downstream metabolites. For individual intermediates where labeled standards are not available (e.g., PEP), a chemically similar ¹³C-labeled compound at a similar retention time is used as a surrogate, with the matrix factor correction applied to compensate for retention-time-dependent ionization differences. The concentrations of glycolytic intermediates are calculated from the peak area ratio of the endogenous compound to the internal standard, multiplied by the internal standard concentration, with the matrix factor correction applied when the IS and the analyte do not co-elute exactly.
¹³C isotope tracing for glycolytic flux measurement: Static metabolite concentrations reflect the balance between production and consumption at the moment of quenching, but they do not reveal the rate at which glucose is flowing through the pathway. [U-¹³C]glucose tracing addresses this limitation by labeling the entire glycolytic intermediate pool over time. In a typical experiment, cells are cultured in medium containing 25% [U-¹³C]glucose (25% of total glucose replaced with the fully labeled form) and sampled at 0, 5, 15, 30, and 60 minutes after label addition. The incorporation of ¹³C into each intermediate is measured by the shift in m/z — for lactate, the unlabeled form appears at m/z 89 (M+0), while the fully labeled form appears at m/z 92 (M+3, three ¹³C atoms from glucose). The rate of M+3 lactate appearance over time provides the absolute glycolytic flux rate. The M+2/M+3 ratio informs on the contribution of the pentose phosphate pathway, which generates M+2 intermediates through the loss of the C1 position of glucose as CO₂. Stable isotope tracing services provide [U-¹³C]glucose labeling experiments with time-course LC-MS/MS analysis.
Sample Preparation — The Most Critical Step for Reliable Glycolysis Data
Sample preparation quality is the single largest source of variation in glycolytic intermediate quantification. The high metabolic flux rate through glycolysis — a typical cancer cell turns over its entire ATP pool every 30 seconds — means that any delay in enzyme inactivation will change the intermediate distribution within seconds.
Metabolic quenching methods compared: Rapid freezing in liquid nitrogen is the most effective quenching method for tissue samples, achieving complete enzyme inactivation within approximately 2 seconds when using a Wollenberger clamp or liquid-nitrogen-cooled tongs. Methanol quenching (60% methanol in water at -40°C) is the standard for cell suspensions, achieving >95% enzyme inactivation with metabolite recovery >85% for phosphorylated intermediates. Perchloric acid (PCA) extraction (6% PCA at 0°C) provides effective protein precipitation and enzyme denaturation but can hydrolyze acid-labile intermediates — PEP recovery after PCA extraction is only 50-70% of that obtained with methanol quenching. A comparison study across three quenching methods found that methanol quenching preserved the G6P/F6P ratio within 5% of the true in vivo value, while PCA extraction altered the ratio by 15-25% and room-temperature organic extraction (without cooling) altered it by 60-80%, effectively randomizing the ratio within the time required for extraction.
Workflow for cell culture samples: Rapid removal of culture medium → immediate addition of 1 mL ice-cold 60% methanol (-40°C) → scraping of adherent cells → transfer to pre-cooled tube → vortex 30 seconds at 4°C → centrifugation at 16,000×g for 10 min at 4°C → supernatant dried under nitrogen → reconstituted in HILIC-compatible mobile phase.
Workflow for tissue samples: Wollenberger clamp with liquid-N₂-cooled tongs → pulverization in liquid-nitrogen-cooled mortar → addition of 1 mL cold 60% methanol per 50 mg tissue → homogenization with bead beater (30 Hz, 60 seconds) → centrifugation as above.
Critical warning: A delay of 30 seconds at room temperature between tissue excision and freezing can change the G6P/F6P ratio by 2-3-fold and decrease PEP by 50%. Any published study reporting absolute concentrations of glycolytic intermediates without describing the quenching protocol should be interpreted with caution.
Metabolic flux analysis services provide integrated sample preparation and LC-MS/MS quantification workflows.
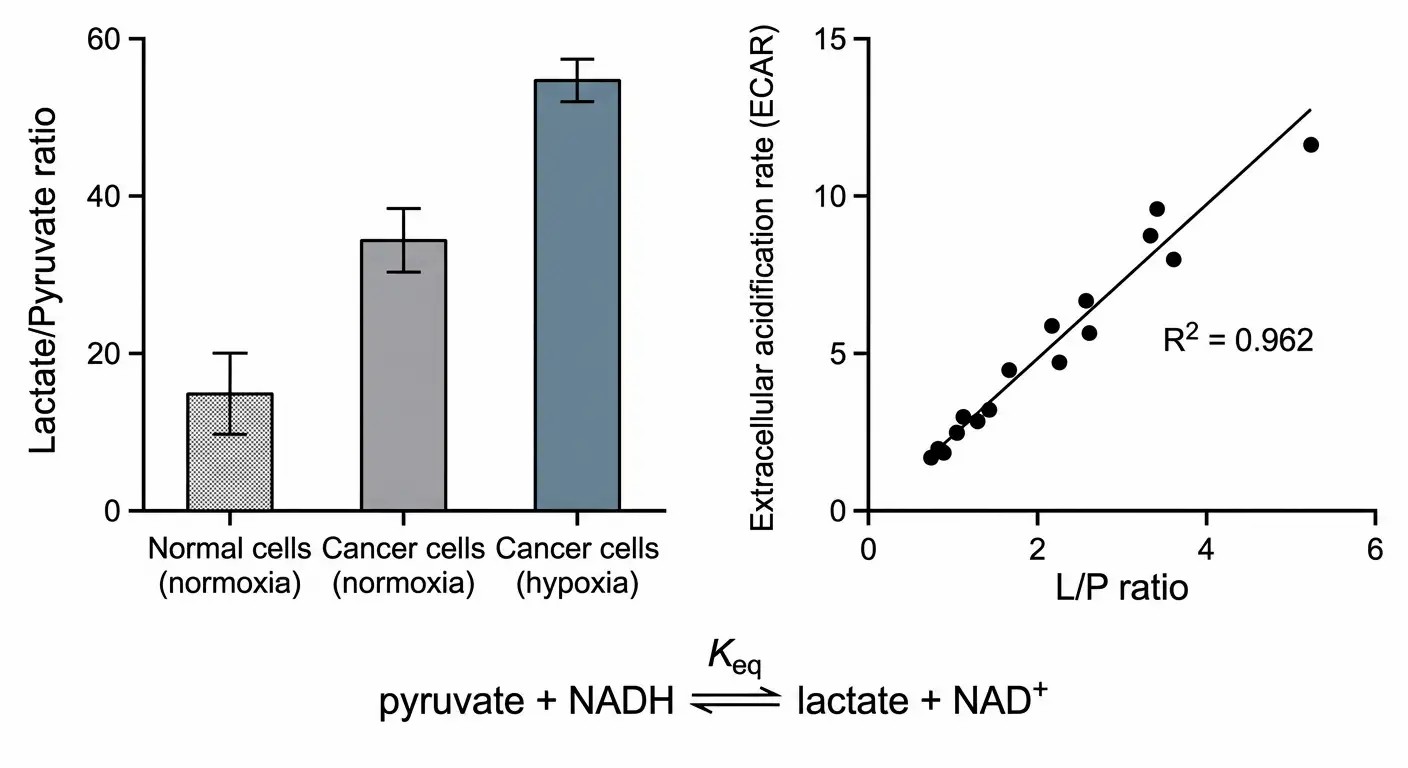 Figure 3: Warburg effect quantification — lactate/pyruvate ratio as a metabolic phenotype readout
Warburg Effect Quantification — Lactate/Pyruvate Ratio as a Metabolic Phenotype Readout
The Warburg effect — aerobic glycolysis — describes the preference of many cancer cell types to ferment glucose to lactate even in the presence of sufficient oxygen. This metabolic phenotype is characterized by high glucose consumption, high lactate production, and a shifted lactate/pyruvate ratio compared to normal cells of the same tissue origin.
Lactate/pyruvate ratio measurement by LC-MS/MS: The L/P ratio is calculated from the molar concentrations of lactate and pyruvate measured in the same sample extract. In cancer research models, the L/P ratio in cells cultured under normoxia (21% O₂) ranges from 10-20 in non-transformed cells to 30-50+ in aggressive cancer cell lines. The ratio is reported alongside the total lactate concentration (which reflects absolute glycolytic flux) and the extracellular acidification rate.
Pyruvate instability and its effect on ratio accuracy: Pyruvate undergoes spontaneous decarboxylation and non-enzymatic condensation reactions in solution, particularly at neutral pH and 37°C. Long-term storage of pyruvate in cell culture medium (hours at 37°C) converts a measurable fraction to the dimer parapyruvate, which is not detected by the pyruvate MRM transition and causes overestimation of the L/P ratio. Immediate quenching and cold methanol extraction eliminate this artifact. For extracellular metabolite measurement, medium samples should be collected and centrifuged at 4°C within 5 minutes of collection, then the supernatant immediately acidified to pH 4 with 1 M formic acid.
Glucose consumption rate as a complementary metric: The decrease in glucose concentration in the culture medium over a defined time period, measured by LC-MS/MS (glucose, m/z 179→89 in negative mode), provides the total glycolytic flux rate. The ratio of lactate produced to glucose consumed is approximately 2:1 when all glucose is converted through glycolysis to lactate. Deviation from this ratio indicates that glycolytic intermediates are entering alternative pathways — the pentose phosphate pathway, the serine synthesis pathway, or glycerolipid synthesis — providing information about metabolic routing.
Lactate measurement in three-dimensional culture models: Cancer cell spheroids and tumor organoids recapitulate the in vivo metabolic gradient more faithfully than monolayer cultures. LC-MS/MS quantification of lactate and pyruvate from spatially resolved spheroid sections — separating the outer proliferating zone from the inner hypoxic core — reveals layer-dependent differences in the L/P ratio. Spheroid cores typically show L/P ratios 2-3-fold higher than the outer layer, reflecting the hypoxia-driven upregulation of glycolysis in the inner region. This spatially resolved approach provides a more physiologically relevant readout of Warburg effect intensity than monolayer culture measurements alone.
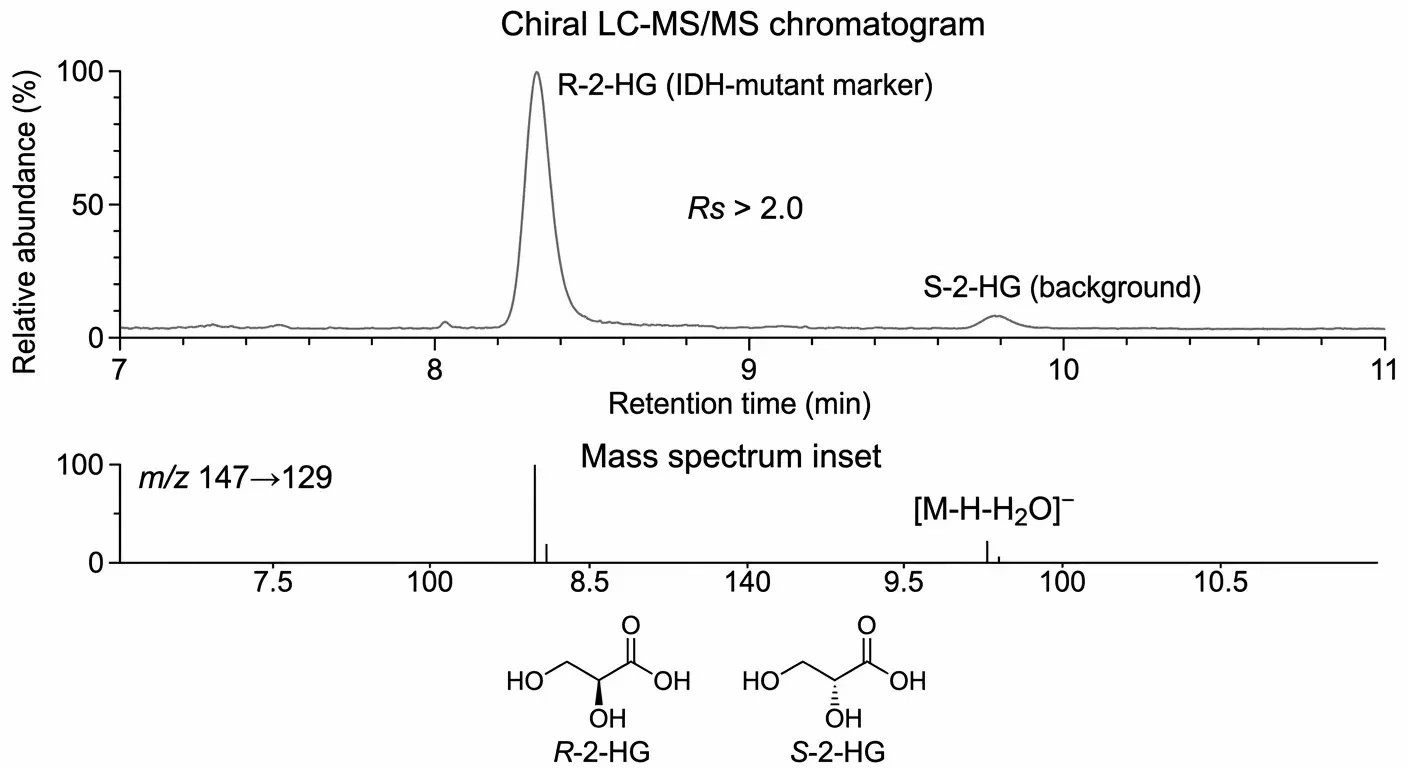 Figure 4: Oncometabolite 2-hydroxyglutarate — chiral separation and LC-MS/MS detection workflow
Oncometabolites Linked to Glycolysis — 2-Hydroxyglutarate and Its LC-MS/MS Detection
The oncometabolite 2-hydroxyglutarate (2-HG) is produced by mutant isocitrate dehydrogenase (IDH1/2) enzymes, which acquire a neomorphic activity converting α-ketoglutarate to R-2-HG. While 2-HG is not a glycolytic intermediate, its accumulation is metabolically coupled to the glycolytic pathway — IDH-mutant cells exhibit elevated glycolytic flux as part of their broader metabolic reprogramming, and 2-HG levels serve as a research biomarker of IDH mutation status in preclinical models. Targeted metabolomic profiling services include 2-HG enantiomer quantification as part of a broader oncometabolite panel.
Enantiomer separation and quantification: R-2-HG and S-2-HG are enantiomers with identical mass spectra and fragmentation patterns. Their separation requires chiral chromatography — typically using a chiral column containing a macrocyclic glycopeptide stationary phase (e.g., teicoplanin-based Chiralpak QN-AX) with a methanol/water/ammonium acetate mobile phase. The two enantiomers elute at distinct retention times (approximately 8.3 minutes for R-2-HG and 9.8 minutes for S-2-HG under optimized conditions), enabling selective MRM detection of the disease-relevant R-2-HG enantiomer. The limit of quantification in cell extracts is approximately 0.1 µM, sufficient to distinguish IDH-mutant from IDH-wild-type cells, which typically show R-2-HG concentrations of 1-10 mM vs<0.1 µM, respectively.
Sample preparation for 2-HG analysis: The same methanol-quenched cell extracts used for glycolytic intermediate quantification can be analyzed for 2-HG without additional preparation. 2-HG is detected in negative ion mode (m/z 147→129, loss of H₂O, CE 15 eV). The stable isotope internal standard, D-2-HG-¹³C₅, corrects for both extraction efficiency and matrix effect. For tissue samples, homogenization in 80% methanol followed by centrifugation and dilution in chiral-compatible mobile phase (typically 80:20 methanol:water with 0.1% formic acid) provides clean extracts for both 2-HG and glycolytic intermediate quantification.
Research applications: 2-HG quantification is used in preclinical IDH-mutant tumor models to monitor oncometabolite suppression by IDH inhibitors, to confirm the IDH mutation phenotype in engineered cell lines and patient-derived xenografts, and as a pharmacodynamic biomarker for target engagement in early drug discovery studies. Integrated proteomics and metabolomics services can combine 2-HG quantification with broader metabolic profiling for comprehensive phenotype characterization.
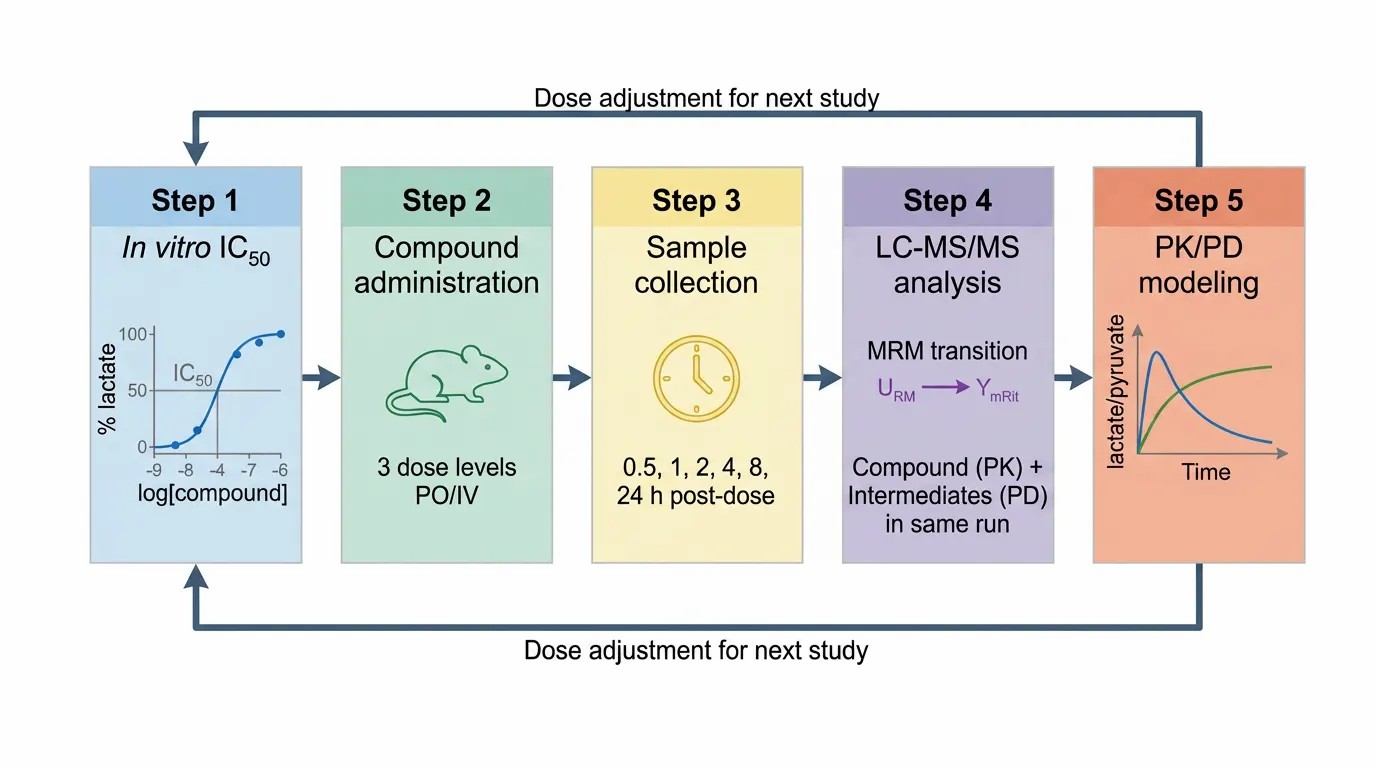 Figure 5: Glycolysis inhibitor PK/PD workflow — from in vitro IC₅₀ to in vivo PD biomarker measurement
Glycolysis Inhibitors in Preclinical Research — In Vitro and In Vivo Analysis by LC-MS/MS
Glycolysis has been extensively investigated as a research target for cancer metabolism intervention. Several small-molecule inhibitors of glycolytic enzymes are used in preclinical studies to probe the role of glycolysis in cancer cell proliferation, survival, and metastasis. LC-MS/MS provides the analytical platform for both the pharmacokinetic (compound concentration) and pharmacodynamic (metabolic response) measurements in these studies.
Hexokinase 2 inhibitors: 2-deoxy-D-glucose (2-DG) is a glucose analog that is phosphorylated by HK2 to 2-DG-6-phosphate, which cannot be further metabolized and accumulates intracellularly, inhibiting HK2 and downstream glycolysis. 2-DG and its phosphorylated form are measurable by LC-MS/MS (m/z 163→89 for 2-DG, m/z 243→97 for 2DG-6P). In vitro treatment at 5-10 mM 2-DG for 24 hours reduces extracellular lactate by 40-60% in cancer cell lines. Lonidamine, an HK2 inhibitor with a different mechanism, is quantified at m/z 321→159 in positive ion mode. Customized compound quantification services support method development for novel glycolysis inhibitors.
PFKFB3 inhibitors: PFKFB3 is the bifunctional enzyme that synthesizes F-2,6-BP, the most potent allosteric activator of PFK-1. Inhibitors such as 3PO (3-(3-pyridinyl)-1-(4-pyridinyl)-2-propen-1-one) and PFK15 reduce F-2,6-BP levels and glycolytic flux. The pharmacodynamic response is measured by LC-MS/MS quantification of F-2,6-BP itself (m/z 339→97), with a 50-70% decrease in intracellular F-2,6-BP observed 1-6 hours after 3PO treatment in tumor xenograft models. Metabolic flux analysis approaches can determine whether PFKFB3 inhibition redirects glucose carbons to the pentose phosphate pathway.
Lactate dehydrogenase A inhibitors: LDHA catalyzes the final step of glycolysis (pyruvate → lactate). Compounds such as FX-11 and GSK2837808A reduce lactate production and increase pyruvate levels in treated cells. The L/P ratio change is the primary PD biomarker for LDHA inhibition. In vitro IC₅₀ determination is performed by measuring the concentration-dependent decrease in extracellular lactate after 24-hour compound treatment, with the IC₅₀ derived from a 4-parameter logistic fit of the lactate concentration vs log(compound concentration) curve.
PK/PD study design example: A typical preclinical PK/PD study for a glycolysis inhibitor involves: single-dose oral or intravenous administration at 3 dose levels to tumor-bearing mice → plasma and tumor tissue collection at 0.5, 1, 2, 4, 8, 24 hours post-dose → LC-MS/MS quantification of compound concentration in plasma (PK) and glycolytic intermediates in tumor tissue (PD) → determination of the relationship between compound exposure and target engagement. The PD effect is quantified as the percentage change in the L/P ratio relative to vehicle-treated controls, with a 30-50% reduction considered a significant target engagement signal in most preclinical studies. For the compound 3PO (PFKFB3 inhibitor), the PK profile shows a plasma half-life of approximately 2 hours with a maximum concentration at 1 hour post-dose, and the PD effect (F-2,6-BP reduction) peaks at 4 hours and returns to baseline by 12 hours — a temporal delay that must be accounted for in the PK/PD modeling.
Decision Framework — Which Glycolysis Analysis Method for Which Research Question?
The choice of analytical method for glycolysis studies depends on the specific research question, not on the available instrumentation. The following framework matches experimental goals to the appropriate LC-MS/MS approach.
To screen metabolic phenotype quickly (30 min per sample): Measure lactate and pyruvate by LC-MS/MS in negative SRM mode. Calculate the L/P ratio. Compare treated vs control samples. This provides the simplest, most robust readout of overall glycolytic activity.
To identify the regulatory node responsible for flux change (60 min per sample): Quantify all seven glycolytic intermediates by HILIC-MS/MS. The ratio of hexose monophosphates (G6P + F6P) to F-1,6-BP indicates PFK-1 activity level. Accumulation of upstream intermediates with depletion downstream signals a specific enzyme block.
To measure pathway routing between glycolysis and PPP (3-24 h experiment): Perform [1,2-¹³C₂] glucose tracer incubation with time-course sampling. Calculate the MIDA of lactate isotopologs. The relative contribution of glycolysis vs PPP to lactate production is derived from the m+2/m+3 lactate ratio.
To evaluate a glycolysis inhibitor in preclinical models (2-5 days): Combine in vitro IC₅₀ determination (lactate readout) with in vivo PK/PD (compound concentration + glycolytic intermediate quantification). Use the L/P ratio as the primary PD biomarker for target engagement.
To detect IDH mutation status in research samples: Measure R-2-HG by chiral LC-MS/MS. Compare against a reference standard curve. The R-2-HG concentration above 100-fold over background is indicative of IDH mutation.
To monitor target engagement in glycolysis inhibitor studies: Quantify the compound concentration (PK) and the downstream metabolite response (PD) in the same LC-MS/MS run where possible. For PFKFB3 inhibitors, measure F-2,6-BP as the PD biomarker. For LDHA inhibitors, measure the L/P ratio. The time course of PD response should match the PK profile — if the PD effect persists beyond the PK elimination phase, pathway rewiring or compensatory mechanisms should be investigated.
Customized experimental services support each of these approaches with project-specific method development.
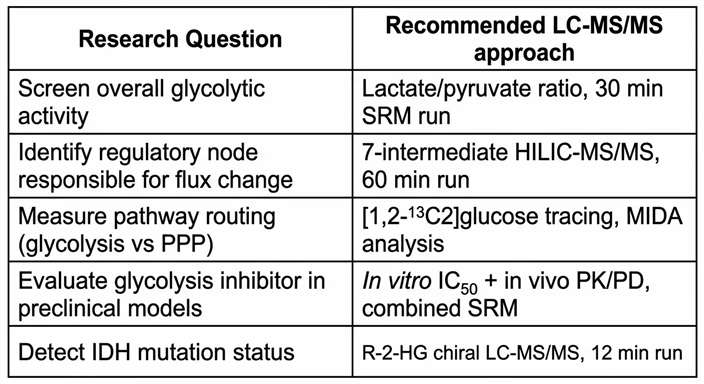 Figure 6: Glycolysis analysis method selection matrix — research question matched to LC-MS/MS approach
FAQ
Cold methanol quenching (60% methanol at -40°C) is the most generally applicable method, providing >85% recovery for phosphorylated intermediates while inactivating all glycolytic enzymes within 2 seconds. Perchloric acid extraction should be avoided for PEP quantification.
Approximately 1×10⁶ cells or 10-20 mg of tissue provides sufficient material for all seven intermediate quantifications in a single LC-MS/MS injection, at typical LLOQs of 0.1-1 pmol per injection.
These isomers have identical mass and cannot be distinguished by MS alone. HILIC on a BEH Amide column at pH 9-10 with an ammonium hydroxide buffer resolves G6P (eluting first) and F6P (eluting 0.3-0.5 min later) with baseline separation.
The L/P ratio reflects the cytosolic NADH/NAD⁺ redox state. Elevated ratios (>30 in cancer research models) indicate high glycolytic flux and an active Warburg effect phenotype.
Static intermediate concentrations reflect pool sizes, not flux rates. Isotope tracing with ¹³C-labeled glucose is required to distinguish flux changes from pool size changes. The extracellular lactate accumulation rate provides an approximation of flux but does not capture pathway routing.
U-¹³C-glucose and U-¹³C-lactate are commercially available and serve as internal standards for all isotopologs. For phosphorylated intermediates where labeled standards are not available, structurally matched ¹³C-labeled compounds at similar retention times are used with matrix factor correction.
References
- A quantitative HILIC-MS/MS assay of the glycolytic pathway in Huh-7 cells. Metabolites. 2019;9:118.
- Metabolomics and metabolites in cancer diagnosis and treatment. Molecular Biomedicine. 2025;6:362.
- A simple, rapid and sensitive HILIC LC-MS/MS method for 16 purine pathway metabolites. Talanta. 2024;266:125471.
- Lactate dehydrogenase A regulates tumor-macrophage interplay in glioblastoma. Nature Communications. 2024;15:46193.
- Targeted determination of tissue energy status by LC-MS/MS. Analytical Chemistry. 2019;91:5423-5430.
- LDHAα, a lactate dehydrogenase A isoform in cancer metabolism. FEBS Journal. 2025;292:474-491.












