

1. Introduction: The Spatial Proteomics Paradigm Shift and Computational Bottlenecks
1.1 Beyond Single-Cell Transcriptomics: Why Spatial Protein Localization Dictates Tumor Phenotypes
Modern oncology has made monumental strides through single-cell RNA sequencing (scRNA-seq) and spatial transcriptomics. However, mRNA abundance frequently demonstrates poor correlation with functional protein expression, post-translational modifications (PTMs), and active signaling cascades due to variable mRNA degradation rates, translational efficiency, and protein turnover. Proteins execute cellular programs, construct extracellular matrices, and mediate direct cell-cell interactions. In the complex tumor microenvironment (TME), the spatial physical location of a protein—whether localized at the cell membrane, translocated into the nucleus, or sequestered within the stroma—dictates therapeutic response and disease progression.
For instance, the expression of programmed death-ligand 1 (PD-L1) on tumor cells versus neighboring antigen-presenting macrophages yields starkly different prognostic outcomes and therapeutic responses to immune checkpoint inhibitors. Furthermore, key oncogenic drivers rely on localized phosphorylation events (such as p-STAT3, p-ERK1/2, p-AKT, or p-Src) that cannot be inferred from mRNA transcript abundance alone. Membrane-bound receptor tyrosine kinases (RTKs, including EGFR, HER2, and MET) triggering intracellular phosphorylation cascades require precise physical proximity between ligands and receptors across adjacent cell membranes. Understanding these localized functional states is critical for translational researchers aiming to identify robust clinical biomarkers, unravel multi-drug resistance mechanisms, and design targeted combination immunotherapies.
1.2 High-Multiplexed Imaging Platforms (IMC, MIBI, CODEX/PhenoCycler)
To capture this multi-layered spatial complexity, high-multiplexed tissue imaging technologies have evolved rapidly across two primary analytical modalities:
- Mass Spectrometry-Based Imaging: Imaging Mass Cytometry (IMC) and Multiplexed Ion Beam Imaging (MIBI) utilize antibodies conjugated to distinct stable metal isotopes (pure lanthanide metals). Tissue sections are systematically rasterized using high-resolution laser ablation (IMC) or primary ion beams (MIBI), releasing metal tags for Time-of-Flight (TOF) mass spectrometry quantification. Utilizing comprehensive Mass Spectrometry Imaging Service platforms resolves 40 to 100+ protein markers simultaneously at sub-micron resolution (down to 250 nm in MIBI) while completely eliminating optical spectral overlap and tissue autofluorescence interference.
- Cyclic Immunofluorescence Platforms: Cyclic immunofluorescence technologies, such as PhenoCycler (formerly CODEX), Cell DIVE, and Ultivue, employ automated microfluidics to perform iterative cycles of fluorophore-conjugated oligonucleotide hybridization, fluorescent imaging, and gentle chemical cleavage. These optical platforms map cellular architectures across intact tissue sections at single-cell and subcellular resolution, preserving complete morphological tissue context.
These high-dimensional imaging platforms generate vast, multi-gigabyte spatial datasets that combine native spatial coordinates (X, Y pixels) with multi-channel protein expression intensity vectors across millions of individual cells per tissue slice. Leveraging a specialized Spatial Proteomics Service provides the baseline experimental data quality, antibody validation, and spatial resolution essential for downstream AI modeling.
1.3 The Computational Bottleneck: Manual Cell Segmentation, Batch Effects, and Loss of Spatial Context
Despite these technological breakthroughs, downstream computational workflows remain a severe bottleneck in translational research. Traditional analysis pipelines rely heavily on manual or semi-automated cell segmentation algorithms (such as Cellpose, Mesmer, or DeepCell) applied to nuclear DAPI or membrane markers, followed by single-cell intensity averaging and classical unsupervised clustering (e.g., PhenoGraph, Seurat, or FlowSOM). This conventional paradigm suffers from four critical technical flaws:
- Segmentation Dependency & Boundary Artifacts: Missegmentation in densely packed, multinucleated, or highly irregular tumor tissue alters cellular protein intensity signatures, introducing substantial artificial noise. Overlapping cell boundaries frequently lead to false co-expression classifications (e.g., falsely assigning stromal marker intensity to an adjacent lymphocyte).
- Platform & Batch Effects: Variations in antibody staining efficiency, tissue autofluorescence, laser/ion beam decay, instrument sensitivity, and slide preparation create prominent batch effects between experimental runs and multi-center clinical cohorts. Standard batch correction tools often erase genuine biological variance while attempting to harmonize multi-center data.
- Loss of Macro-Spatial Architecture: Averaging protein signals into discrete cell-type labels discards essential spatial context—such as higher-order microenvironment niches, signaling gradients, tertiary lymphoid structures (TLS), and non-cellular extracellular matrix impedance.
- Inability to Capture Non-Cellular Functional Matrix Structures: Fibronectin fiber alignment, collagen deposition, and acellular vascular basement membranes play profound roles in drug penetration and immune cell exclusion, yet are completely ignored by cell-centric segmentation pipelines.
Addressing these computational hurdles requires a fundamental shift from rigid, single-cell heuristic pipelines to self-supervised, multi-scale artificial intelligence models capable of directly learning native tissue representations.
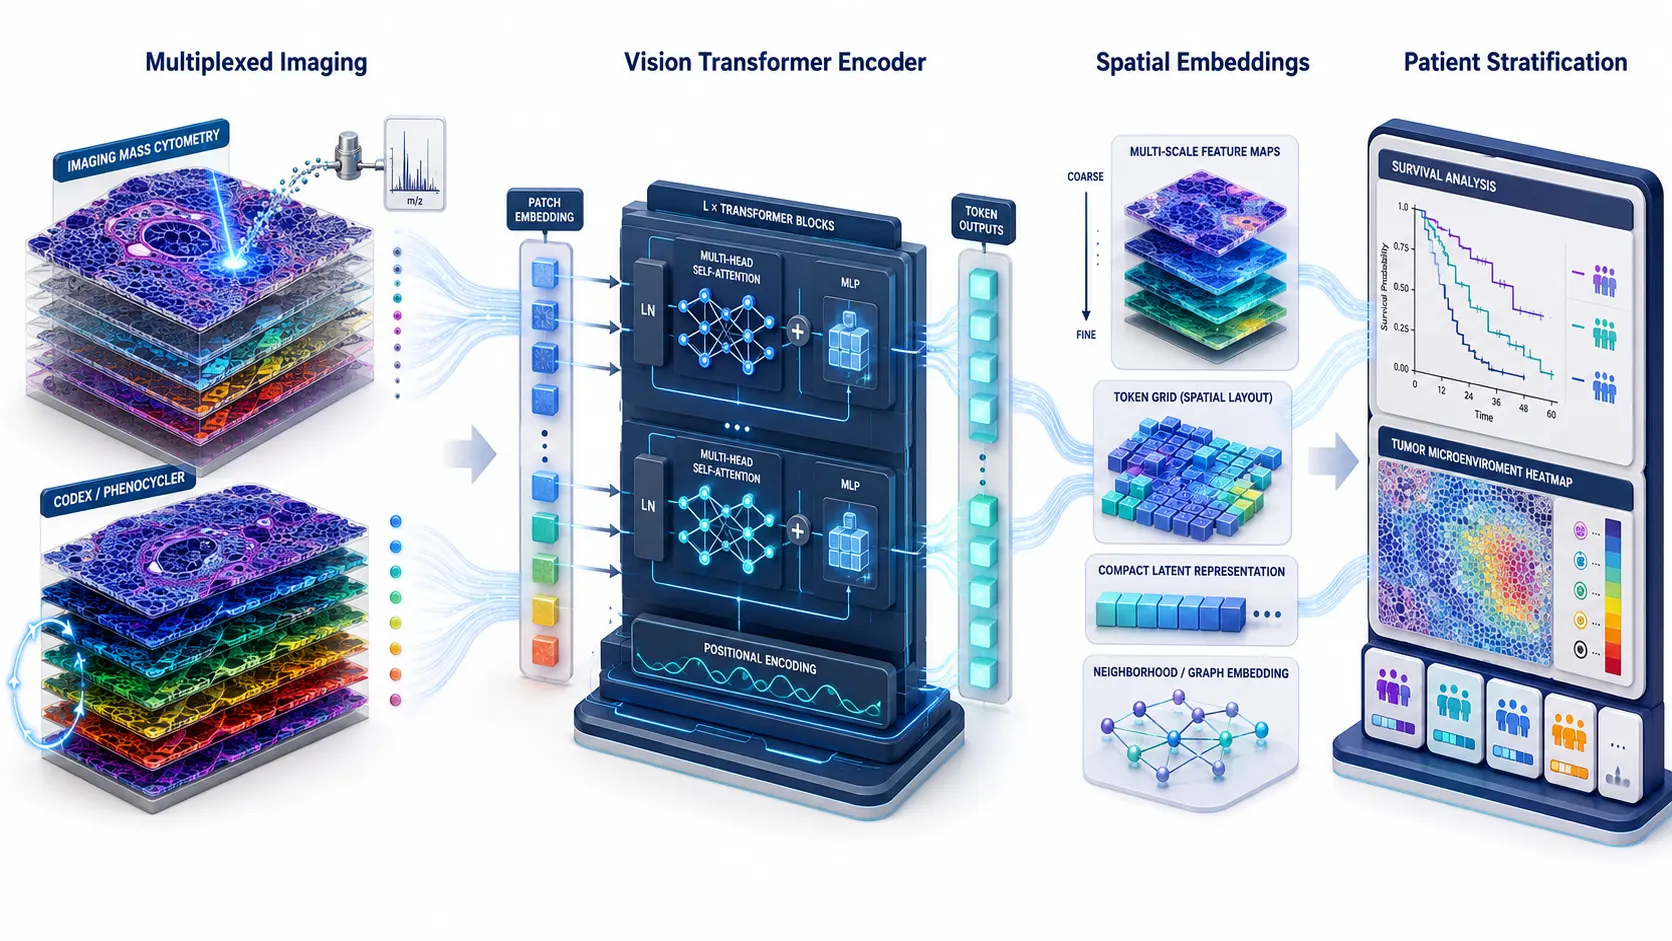 Figure 1: Spatial Proteomics Foundation Model Pipeline
2. Core Architecture of Spatial Proteomics Foundation Models
2.1 Self-Supervised Learning (SSL) on Tissue Images: Masked Image Modeling & ViTs
Foundation models represent a transformative paradigm in computational biology. Rather than relying on human-annotated labels, cell segmentation masks, or predefined cell categories, foundation models leverage Self-Supervised Learning (SSL) over massive, unannotated multi-center tissue image libraries. In spatial proteomics, advanced foundation model architectures—such as Vision Transformers (ViTs, including ViT-Base, ViT-Large, and Swin Transformers)—treat multi-channel tissue images as sequences of spatial patches (e.g., 16x16 pixel patches across 40+ marker channels).
Utilizing Masked Image Modeling (MIM) pre-training recipes (analogous to BERT or MAE in computer vision), large random segments (50% to 75%) of multi-channel protein patches are masked during input processing. The Vision Transformer encoder processes unmasked patches alongside 2D sine-cosine spatial positional embeddings, projecting them through multi-head self-attention layers. The decoder must reconstruct the missing channel intensity values by optimizing a mean squared error (MSE) loss function across all protein markers.
Through this pre-training process, the model autonomously learns intricate spatial correlations, channel-to-channel co-expression patterns, organelle organization, and contextual tissue morphology across diverse organ systems and disease states without human supervision. Furthermore, contrastive learning objectives (such as SimCLR or DINOv2 formulations) are frequently integrated alongside MIM to enforce feature alignment across augmented spatial rotations, scaling transformations, and intensity jittering. Pre-training on multi-institutional datasets incorporating millions of tissue patches ensures robust feature representations that generalize across novel disease indications.
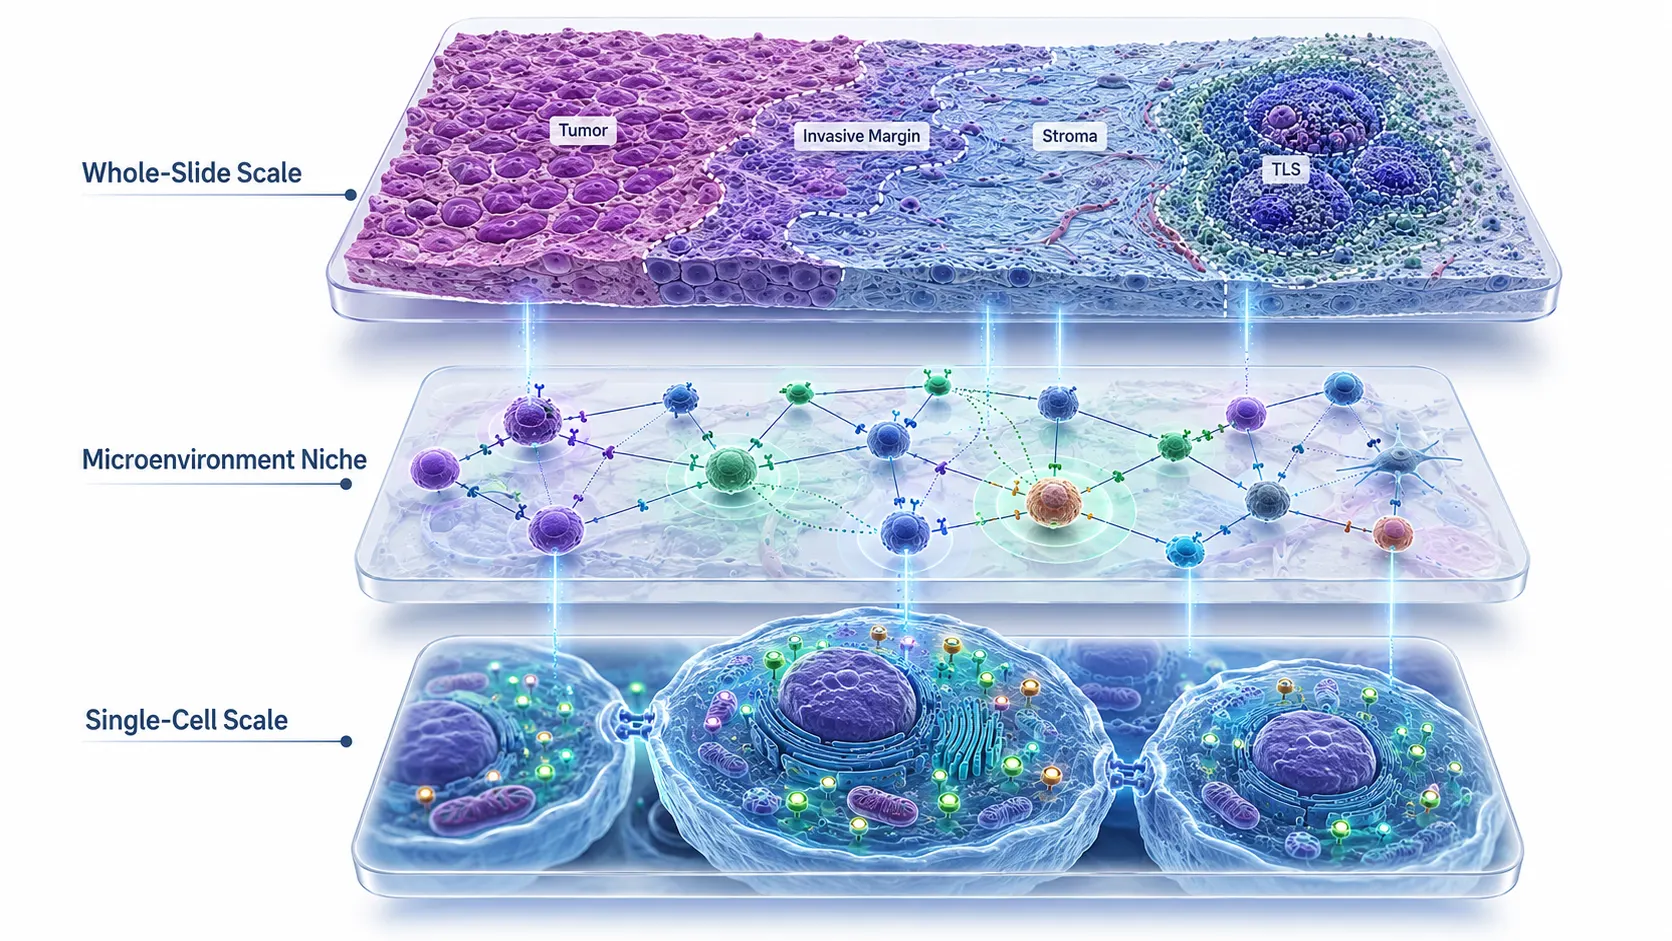 Figure 2: Multi-Scale Spatial Representation Architecture
2.2 Multi-Scale Feature Representation: Single-Cell, Functional Niche, and Whole-Slide Embeddings
A key strength of spatial proteomics foundation models lies in multi-scale representation learning. Rather than restricting feature extraction to an isolated cell or a fixed window size, the Transformer encoder computes hierarchical embeddings across three distinct, biologically meaningful scales:
- Cellular-Level Scale (Local Scale): Extracts fine-grained intracellular protein co-expression vectors, organelle distribution, and membrane receptor clustering without requiring hard cell boundaries. This captures localized sub-cellular signaling dynamics such as nuclear translocation of transcription factors (e.g., NF-kB, beta-catenin, or STAT family members).
- Microenvironment Niche Scale (Intermediate Scale): Models cell-cell adjacency networks, paracrine signaling radii, and localized immune-stroma boundaries. This is achieved by combining Transformer spatial attention mechanisms with Graph Neural Networks (GNNs, such as Graph Attention Networks [GATs]), where nodes represent local cell patches and edges encode spatial distances and functional interaction states. Node degree centrality, clustering coefficients, and graph attention weights reflect localized cellular communication hubs and spatial signaling networks.
- Whole-Slide Tissue Scale (Global Macro-Scale): Aggregates macro-architectural patterns, tertiary lymphoid structures (TLS), invasive margins, tumor-nest boundaries, and global intra-tumor heterogeneity into compact, high-dimensional feature vectors via global attention pooling (e.g., Clam or Performer aggregation).
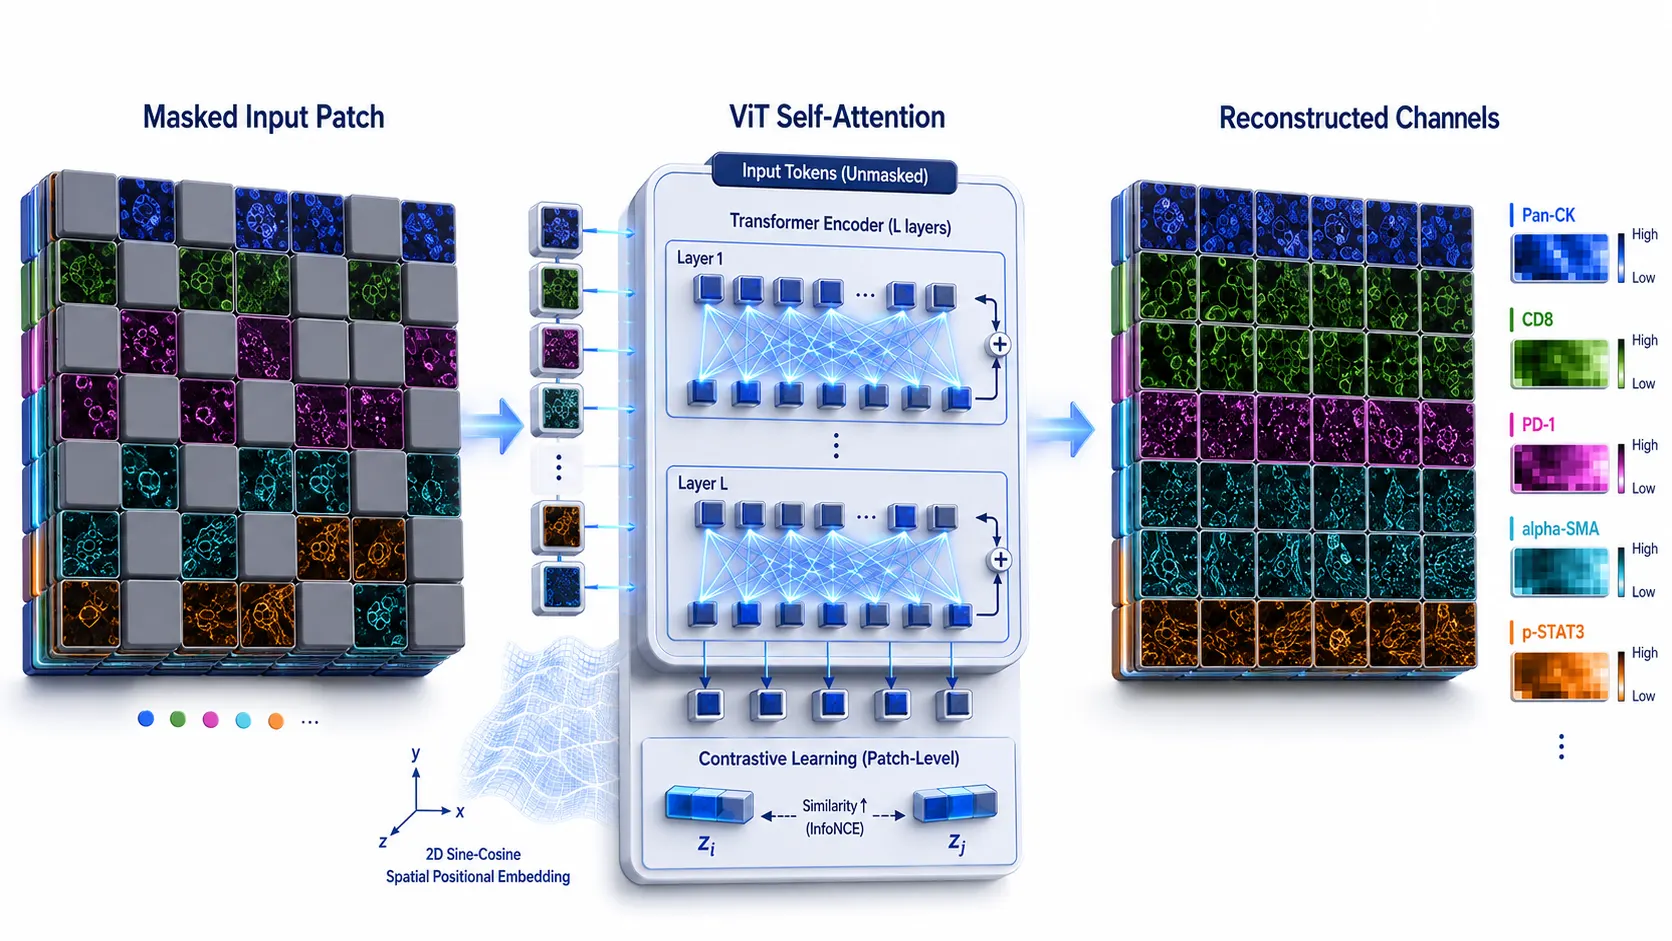 Figure 3: Self-Supervised Pre-Training Recipe
2.3 Unsupervised Clustering and Spatial Graph Representations
By embedding multi-channel tissue images into unified, smooth latent spaces, foundation models enable downstream unsupervised discovery without manual gating bias. Latent representations allow researchers to perform zero-shot clustering, identifying novel, rare cell states, transitional cell phenotypes, and continuous functional gradients that escape conventional gating strategies and discrete cell-type classification. Graph topology embeddings further allow quantifying tissue disorder, spatial entropy, cell-type mixing indices, and lacunarity metrics across intact clinical biopsies.
3. Overcoming Platform Heterogeneity and Technical Artifacts
3.1 Channel-Agnostic Representation and Cross-Platform Normalization
One of the most formidable challenges in spatial proteomics is the lack of standardized marker panels across different institutions and imaging platforms. A CODEX panel utilized at one institution may share only 10 antibodies with an IMC panel run at a partner research center. Advanced foundation models overcome this barrier by incorporating channel-agnostic Transformer encoders or cross-modal set projection layers (such as Set Transformers or Perceiver IO architectures).
By treating individual protein channels as flexible, unordered sets rather than fixed tensor dimensions, the foundation model projects arbitrary marker combinations into a shared, standardized embedding space. This allows the model to generalize seamlessly across heterogeneous marker panels, different antibody clones, and varying imaging modalities (optical fluorescence vs. mass spectrometry imaging) without requiring complete model re-training or losing valuable historical dataset compatibility.
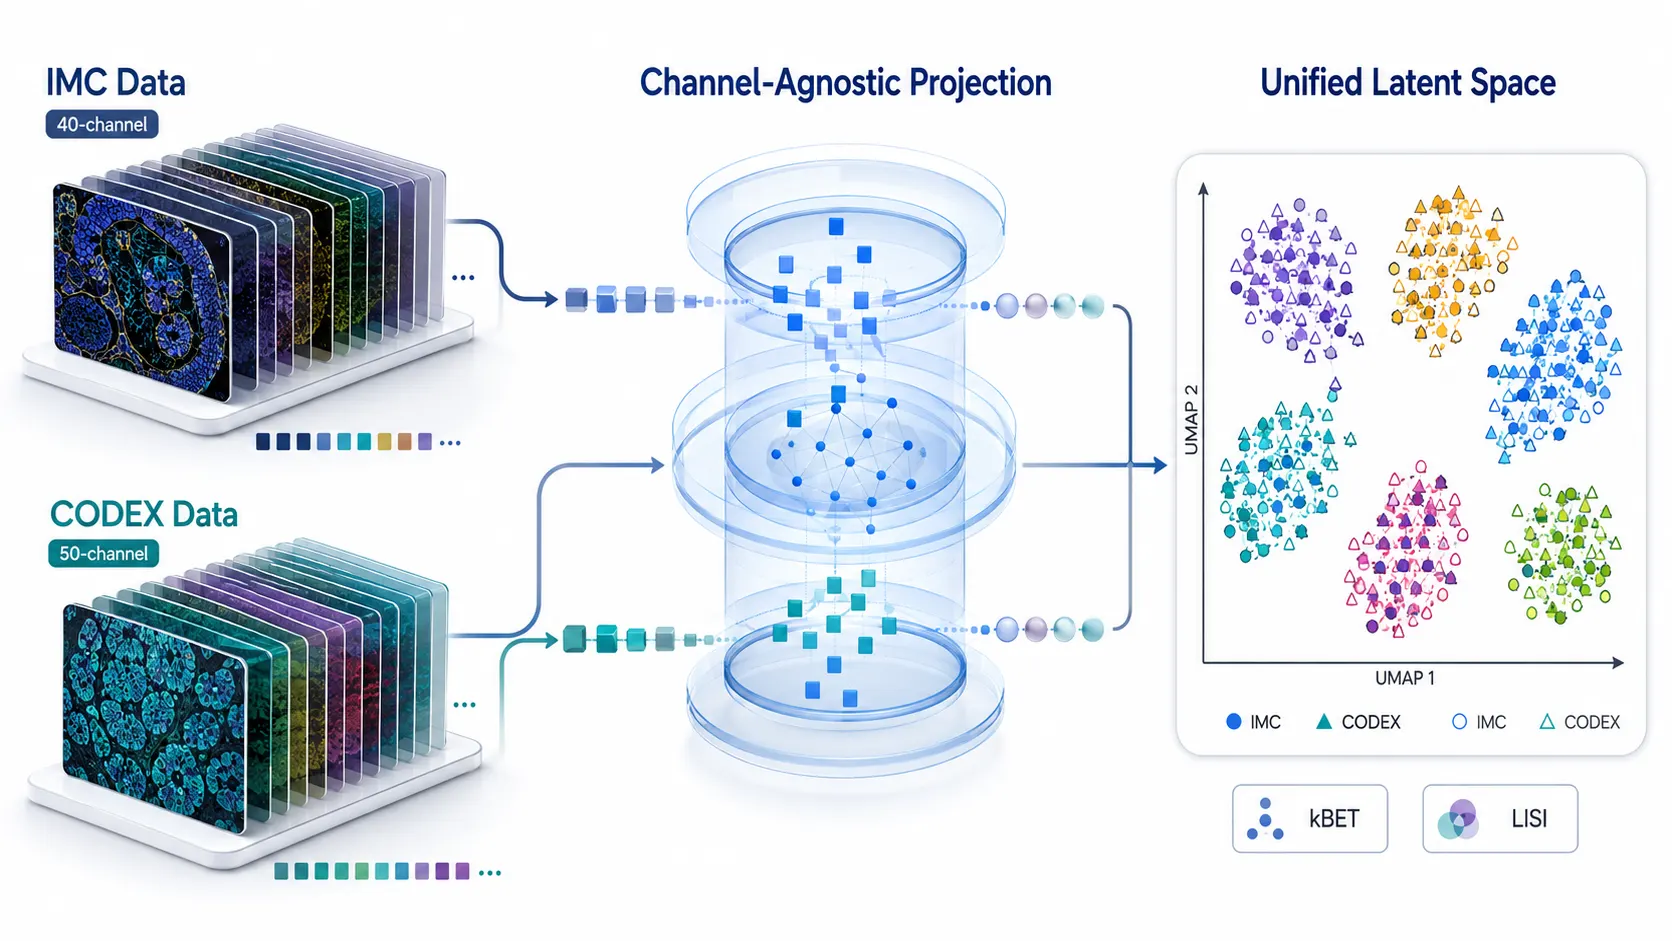 Figure 4: Cross-Platform Feature Normalization & Channel Invariance Engine
3.2 Automated Artifact Removal and Noise Compensation
Tissue tears, foldings, antibody aggregation, bubble formation, laser energy decay, and spectral bleed-through frequently corrupt multiplexed imaging slides in clinical trial settings. Pre-trained foundation models automatically learn the underlying biological grammar of healthy and diseased tissue architecture. Consequently, technical anomalies and staining artifacts manifest as out-of-distribution outliers in latent feature space. This enables automated quality control pipelines to detect, mask, or impute corrupted tissue regions, restoring optimal signal-to-noise ratios prior to patient stratification. Benchmarking tools show that foundation model latent features achieve superior batch-effect correction (measured by kBET and LISI metrics) compared to conventional Harmony or ComBat algorithms.
4. Virtual Spatial Proteomics and Multimodal Integration
4.1 H&E-to-Protein Virtual Profiling: Generative AI in Tissue Omics
Standard Hematoxylin and Eosin (H&E) staining is ubiquitous, ultra-low-cost, and routinely performed across clinical pathology laboratories worldwide. However, standard H&E lacks molecular specificity and cannot resolve complex protein expression patterns or signaling activation. Emerging generative foundation models establish multi-modal translation bridges between standard histopathology and high-multiplexed spatial proteomics.
Utilizing conditional generative adversarial networks (cGANs) or diffusion-based generative architectures (such as SPgen, Denoising Diffusion Probabilistic Models [DDPMs], and HEX), foundation models learn shared latent feature representations between structural H&E cellular morphology and multiplexed protein intensity channels. Consequently, these models enable "virtual spatial proteomics"—predicting proteome-wide spatial protein expression profiles directly from digital H&E tissue slides. This innovation drastically reduces screening costs and enables retrospective spatial biomarker discovery across massive archival biobanks containing millions of paraffin-embedded (FFPE) pathology slides.
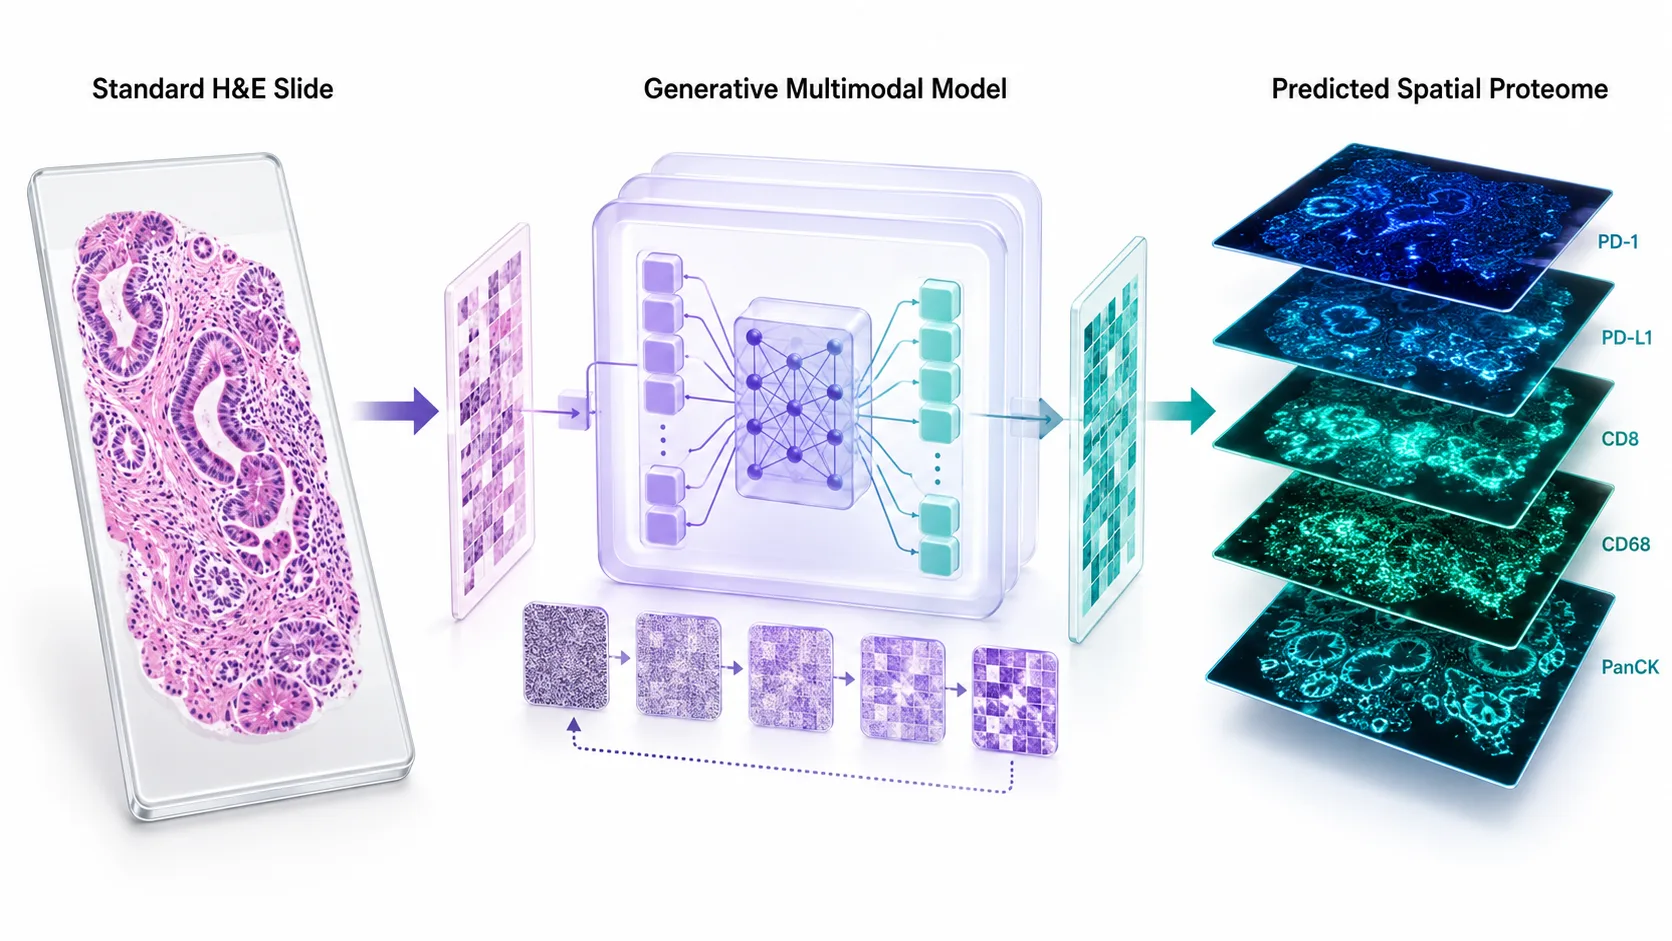 Figure 5: Virtual Spatial Proteomics Engine
4.2 Cross-Modal Fusion: Bridging Spatial Transcriptomics and Spatial Proteomics
Integrating spatial transcriptomics (e.g., 10x Visium, Xenium, CosMx) with spatial proteomics provides an unparalleled multi-omics view of tissue biology. Combining spatial protein detection with targeted Single Cell Proteomics Service assays enables foundation models with cross-attention multimodal encoders to perform joint latent alignment. This links transcriptomic gene expression with functional proteomic translation at identical spatial coordinates, resolving post-transcriptional regulatory bottlenecks, mRNA decay rates, spatial PTM dynamics, and ligand-receptor signaling pairs in complex clinical samples.
5. Translating Spatial Representations into Clinical Patient Stratification
5.1 Pathway-Driven Functional Niche Profiling vs. Pure Physical Proximity
Traditional spatial biology analysis measures physical proximity—for instance, calculating Euclidean distances between CD8+ T cells and Pan-CK+ tumor cells. However, physical proximity alone does not guarantee biological or therapeutic interaction. A cytotoxic T cell located immediately adjacent to a tumor cell may remain functionally exhausted due to localized immune checkpoint engagement (e.g., PD-1/PD-L1, TIM-3, LAG-3, or TIGIT interactions) or TGF-beta-mediated stromal suppression.
Spatial proteomics foundation models evaluate functional niches based on active signaling pathway co-expression, phosphorylated protein activation states (e.g., p-STAT3, p-ERK1/2, p-AKT, Ki67, Cleaved Caspase-3), and localized immunosuppressive gradients. By evaluating functional activation rather than mere cell density or distance, foundation models deliver a vastly superior, highly accurate metric for predicting drug response, resistance emergence, and overall patient survival.
5.2 Deciphering the Immune-Stroma Boundary and Immunotherapy Resistance
Immunotherapy resistance is heavily governed by microenvironmental spatial architecture. In "immune-excluded" tumors, cytotoxic lymphocytes are physically restricted to dense, fibrotic stromal margins, unable to penetrate the core tumor nest. Foundation models quantify the spatial impedance of the extracellular matrix, fibronectin fiber alignment, alpha-SMA+ cancer-associated fibroblast (CAF) barriers, and immunosuppressive myeloid-derived suppressor cell (MDSC) niches. This spatial characterization successfully stratifies responders from non-responders in immune checkpoint blockade (ICB), anti-VEGF, and cellular therapy clinical trials.
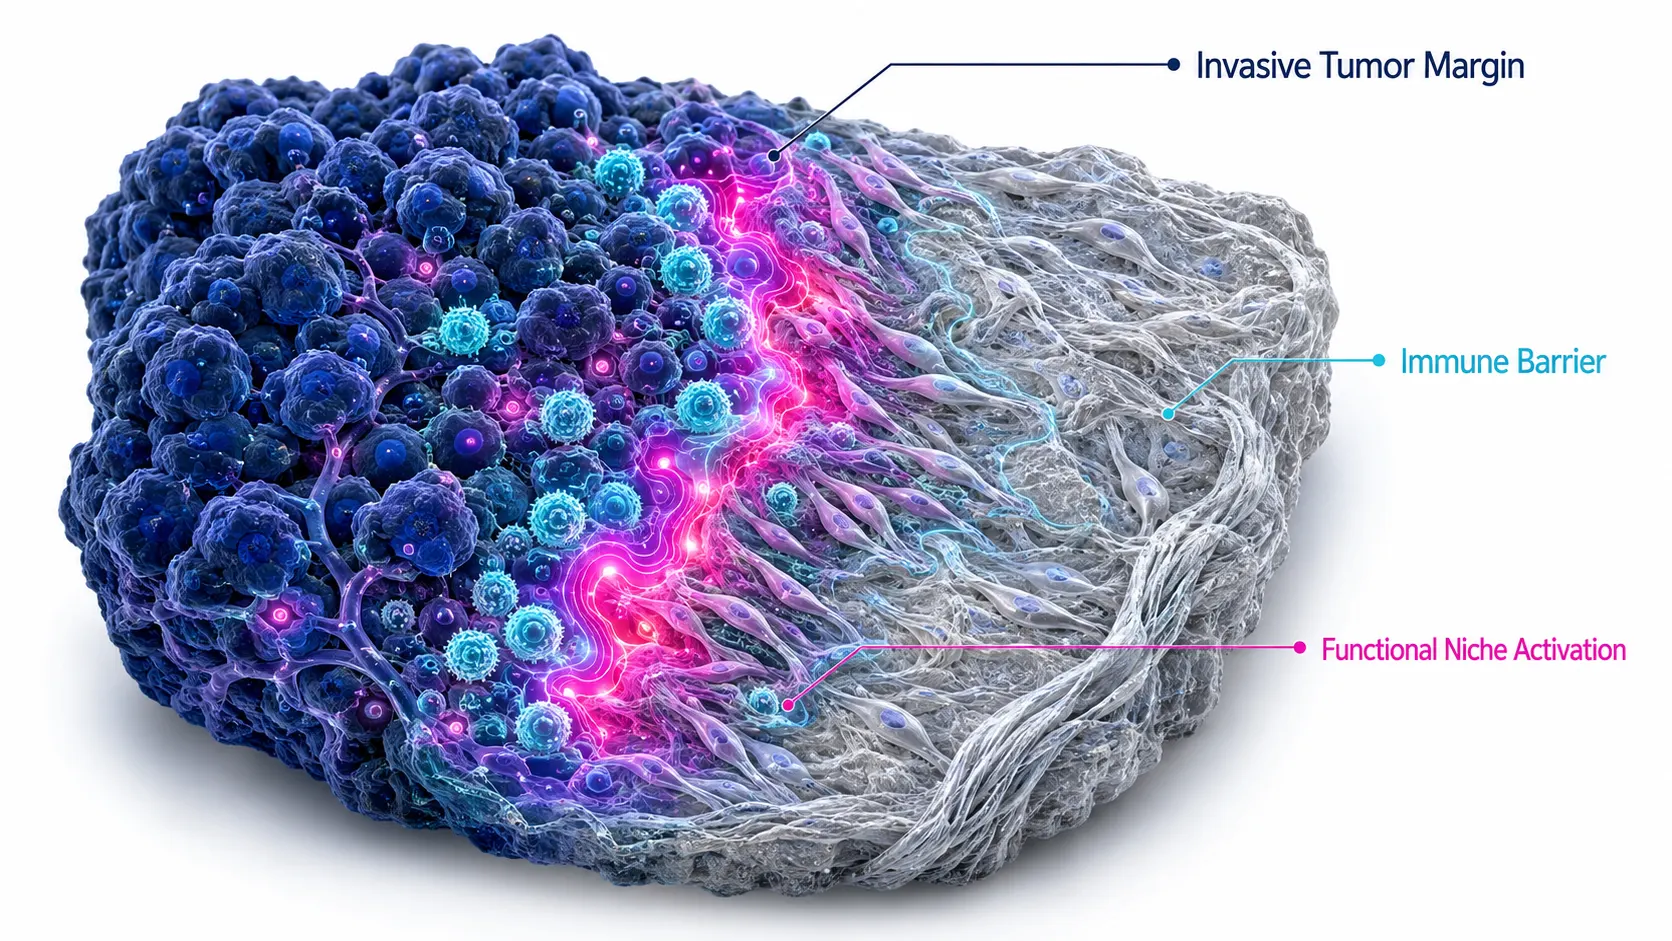 Figure 6: Functional Niche & Tumor Boundary Stratification
5.3 Predictive Biomarker Discovery Across Heterogeneous Cancer Cohorts
By leveraging pre-trained latent representations, researchers can train lightweight classification or survival heads on clinical endpoints (e.g., overall survival [OS], progression-free survival [PFS], objective response rate [ORR]) using modest patient cohorts (e.g., N = 50 to 200 patients). Partnering with an experienced Biomarker Discovery Service provider allows clinical trial teams to extract subtle, multi-cellular spatial motifs that predict therapeutic efficacy far more accurately than single-marker immunohistochemistry (IHC) or bulk tumor mutational burden (TMB).
6. Model Interpretability and Translational Validation
6.1 Explainable AI: Biological Validation of Spatial Attention Maps
A critical requirement in clinical medicine and drug development is model interpretability—overcoming the "black box" nature of deep neural networks. Spatial proteomics foundation models address this challenge through explainable AI mechanisms, such as Integrated Gradients, SHAP (SHapley Additive exPlanations), and spatial Transformer attention mapping. By projecting high-weight attention scores back onto original digital tissue coordinates, pathologists and translational scientists can visually inspect which specific microenvironment niches, cell-cell interaction boundaries, tertiary lymphoid structures, or vascular interfaces drove the patient risk stratification score, ensuring biological plausibility and regulatory compliance.
6.2 Multi-Center Cohort Benchmarking and Survival Analysis
To achieve clinical translation, foundation model representations must undergo rigorous validation across multi-center, independent patient cohorts. Applying Kaplan-Meier survival analysis, log-rank hypothesis testing, and multivariate Cox proportional hazards regression demonstrates that foundation-model-derived spatial risk scores independently predict patient survival across diverse oncology cohorts (including non-small cell lung cancer [NSCLC], diffuse large B-cell lymphoma [DLBCL], colorectal cancer [CRC], and triple-negative breast cancer [TNBC]), outperforming standard TNM clinical staging and traditional pathology grading.
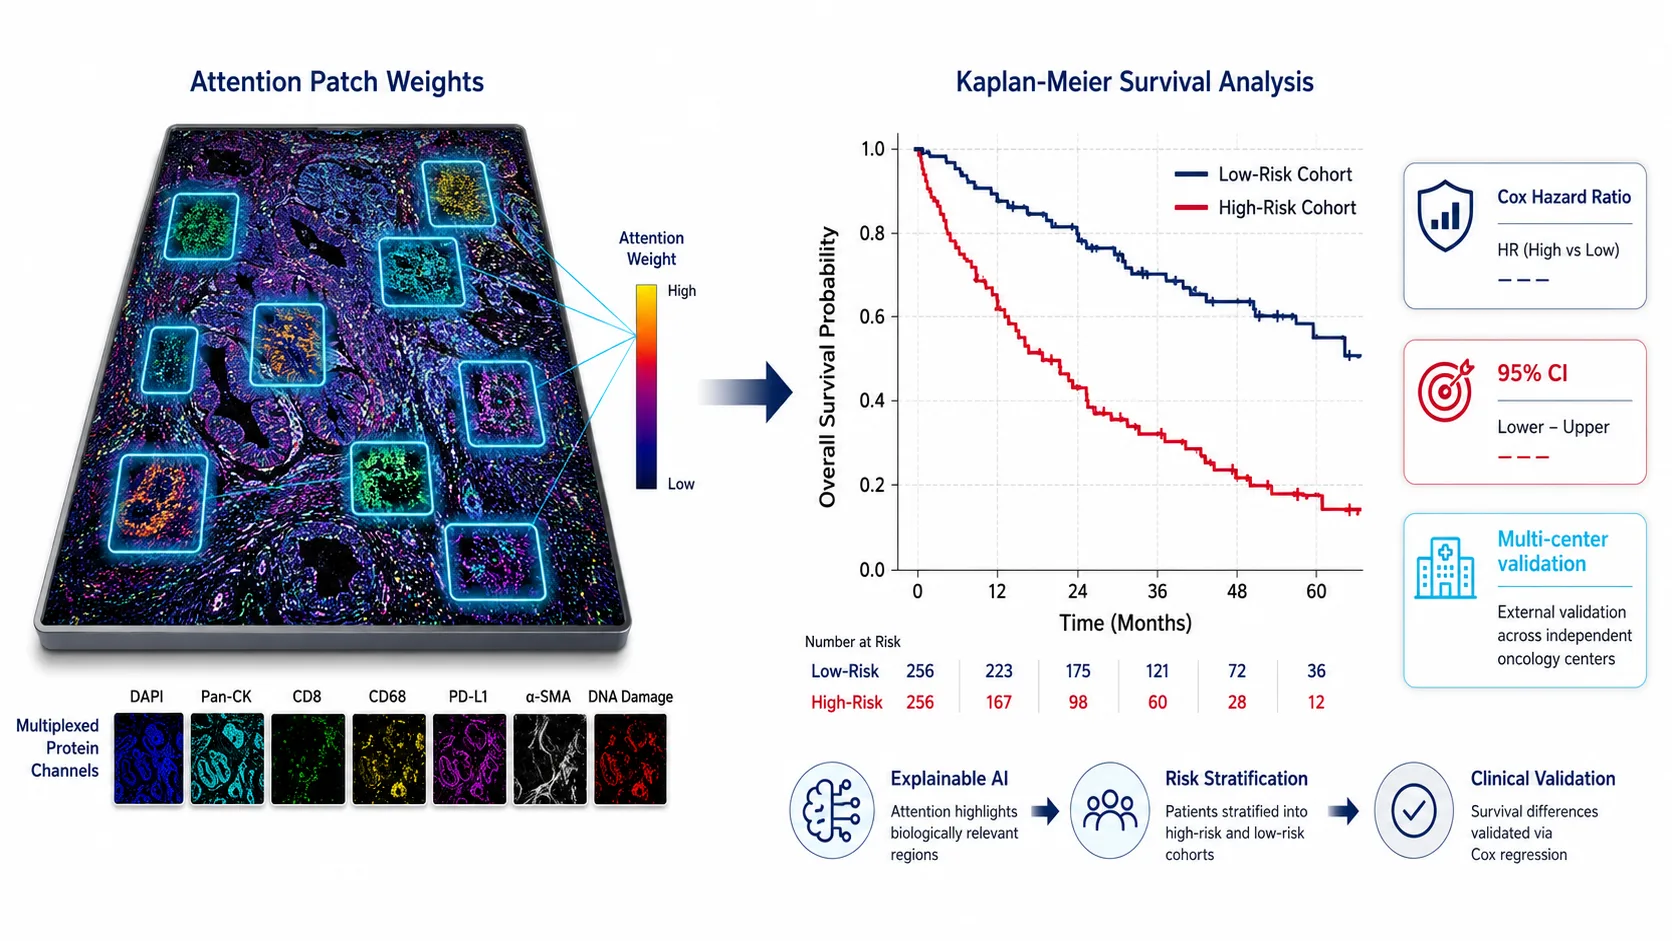 Figure 7: Multi-Cohort Patient Survival Stratification
7. Methodological Comparison: Traditional Spatial Pipelines vs. Foundation Models
| Analytical Feature | Traditional Spatial Analysis Pipeline | Spatial Proteomics Foundation Model |
|---|---|---|
| Primary Input Format | Single-cell segmentation masks & averaged intensity matrices | Native multi-channel image patches, spatial graphs & raw arrays |
| Segmentation Dependency | Critical (Highly vulnerable to cell boundary overlap errors) | Minimal (Segment-free / Patch-based Vision Transformer processing) |
| Spatial Context Retention | Single-cell local features only (Macro-architecture lost) | Multi-scale (Cellular, Niche, Whole-Slide macro-architecture) |
| Cross-Platform Generalizability | Low (Requires labor-intensive batch correction per run) | High (Channel-agnostic encoders / Zero-shot representation learning) |
| Feature Discovery | Supervised / Unsupervised gating on predefined markers | Unsupervised zero-shot discovery of novel functional motifs & niches |
| Functional State Profiling | Static cell-type labeling based on primary markers | Active pathway activation profiling (PTMs, phosphorylation states) |
| Predictive Power for Stratification | Moderate (Relies on simple cell counts & linear distances) | High (Captures non-linear, multi-cellular spatial interactions) |
| Scalability to Large Cohorts | Poor (High manual intervention & computational latency) | Excellent (Parallelized GPU inference on raw digital slides) |
8. Translational Best Practices & Implementation Framework
For translational research teams, biopharmaceutical developers, and contract research organizations (CROs) integrating spatial proteomics into target discovery, mechanism-of-action (MoA) validation, and clinical trials, we recommend a four-stage implementation framework:
- Experimental Standardization & Panel Optimization: Implement standardized tissue fixative protocols (FFPE vs. fresh frozen) and select high-multiplex antibody panels covering key tumor, immune, stromal, and phosphoprotein markers. Standardized antibody conjugation chemistry ensures high signal-to-noise ratios across multi-center studies.
- Quality-Controlled Data Ingestion & Artifact Filtering: Utilize automated AI pre-processing and artifact removal pipelines to filter tissue tears, background autofluorescence, laser energy decay, and antibody aggregation anomalies prior to feature extraction.
- Multi-Scale Model Embedding & Latent Space Mapping: Apply pre-trained foundation model encoders to map multi-channel tissue features into unified, high-dimensional latent spaces without manual segmentation bias. Utilizing an advanced Bioinformatics Analysis Service for multi-scale spatial graph construction reveals rare functional cell sub-populations and structural microenvironment niches.
- Clinical Endpoint Fine-Tuning & Biomarker Validation: Train interpretable classification heads on patient survival, immunotherapy response, or drug efficacy metrics, validating results across independent multi-center clinical trial cohorts using Cox regression models and receiver operating characteristic (ROC) AUC benchmarks.
9. Frequently Asked Questions (FAQ)
Q1: What imaging platforms are compatible with spatial proteomics foundation models?
Spatial proteomics foundation models are platform-agnostic. They process multi-channel spatial data generated from fluorescence-based platforms (such as CODEX/PhenoCycler, Cell DIVE, and Ultivue) as well as mass-spectrometry-based platforms (such as Imaging Mass Cytometry [IMC] and MIBI). Channel-agnostic Transformer encoders allow seamlessly combining datasets across different imaging modalities without losing historical compatibility.
Q2: Do foundation models completely eliminate the need for cell segmentation?
While foundation models can perform patch-based or pixel-level feature extraction without prior cell segmentation, incorporating cell segmentation boundaries can provide auxiliary biological constraints when evaluating single-cell morphology. However, foundation models are far less sensitive to segmentation boundary errors compared to traditional cell-averaging algorithms.
Q3: How do spatial proteomics foundation models differ from pathology foundation models trained on H&E slides?
Pathology foundation models trained on H&E or IHC slides capture tissue morphology, nuclear structure, and basic cellular arrangements. In contrast, spatial proteomics foundation models process high-dimensional multiplexed protein co-expression channels (40–100+ markers simultaneously), enabling direct resolution of functional cell states, signaling pathway activity, ligand-receptor binding, and post-translational modifications that are completely invisible on standard H&E staining.
Q4: Can virtual spatial proteomics replace physical multiplexed imaging experiments?
Virtual spatial proteomics (predicting multiplexed protein signals from digital H&E slides) serves as an extremely powerful, cost-effective screening tool for large retrospective cohorts and biobanks where physical tissue samples or budgets are limited. However, for prospective biomarker validation, target discovery, and clinical trial stratifications, physical multiplexed imaging remains the gold standard for ground-truth quantification.
Q5: What sample size is required to fine-tune a pre-trained spatial proteomics foundation model for patient stratification?
Because the underlying Vision Transformer encoder is pre-trained on millions of unannotated tissue patches, fine-tuning a downstream classifier for clinical endpoints (such as overall survival or drug response) typically requires modest cohort sizes—often between 50 and 200 well-annotated patient samples—making it highly accessible for clinical trial biomarker discovery.
Q6: How do foundation models account for tissue heterogeneity across different tumor types?
Pre-training across multi-center, pan-cancer tissue libraries exposes the Vision Transformer encoder to diverse histological architectures (e.g., carcinomas, sarcomas, lymphomas). The resulting multi-scale embeddings capture generalizable rules of cell-cell communication and microenvironment organization that translate across heterogeneous tumor types.
Q7: What computational infrastructure is required to deploy spatial proteomics foundation models?
Pre-training a foundation model requires GPU clusters (e.g., NVIDIA A100 or H100 GPUs). However, inference and downstream fine-tuning on pre-extracted tissue embeddings can be executed efficiently on standard workstation GPUs or cloud-based AI environments, making deployment highly practical for biopharmaceutical research teams.
Q8: Are these computational workflows intended for clinical diagnostic use?
Spatial proteomics foundation models and associated analytical workflows described here are developed for Research Use Only (RUO). They serve as powerful tools for target discovery, biomarker identification, drug mechanism-of-action evaluation, and translational research in biopharmaceutical and academic settings, and are not intended for direct clinical diagnostic procedures.
References:
- Shaban, M., Chang, Y., Qiu, H., et al. (2025). A Foundation Model for Spatial Proteomics. arXiv preprint arXiv:2506.03373. https://arxiv.org/abs/2506.03373 (CC BY 4.0 Open Access).
- AACR Annual Meeting Abstract. (2026). Abstract 4163: A general-purpose AI foundation model for spatial proteomics. Cancer Research, 86(7_Supplement), 4163. https://aacrjournals.org/cancerres/article/86/7_Supplement/4163/779336
- SpatialFusion Modeling Group. (2026). SpatialFusion: A lightweight multimodal foundation model for spatial biology. bioRxiv preprint. https://www.biorxiv.org/content/10.64898/2026.03.16.712056v1.full-text (CC BY 4.0 Open Access).
- Review of Spatial Omics & Precision Medicine. (2025). Opportunities, challenges, and pitfalls in spatial proteomics modeling. PMC Articles, PMC13082395. https://pmc.ncbi.nlm.nih.gov/articles/PMC13082395/ (CC BY 4.0 Open Access).
- Advances and Applications of Spatial Proteomics in Oncology. (2026). PubMed Central, PMC12800893. https://pmc.ncbi.nlm.nih.gov/articles/PMC12800893/ (CC BY 4.0 Open Access).














