

Adenosine triphosphate (ATP) is the principal energy currency of the cell, but its concentration alone does not define metabolic status. The adenylate energy charge — a weighted ratio of ATP, ADP, and AMP formulated by Daniel Atkinson in 1968 — captures the proportion of the adenylate pool that is in the high-energy triphosphate form. In healthy, metabolizing cells, the energy charge is tightly maintained between 0.85 and 0.95 through a system of ATP synthesis and utilization pathways. When the energy charge falls below 0.70, metabolic adaptation is triggered through AMPK signaling. Below 0.50, irreversible damage pathways begin, and the cell is committed to either apoptosis or necrosis. The quantitative interpretation of adenylate data therefore requires measuring all three species — ATP, ADP, and AMP — within the context of the specific research model. The existing resource provides a comprehensive review of ATP synthesis pathways, breakdown mechanisms, and the ATP cycle. This guide extends that foundation into quantitative practice: how to measure ATP, ADP, and AMP simultaneously by LC-MS/MS, how to calculate the energy charge, and how to interpret adenylate changes in the context of metabolic adaptation, mitochondrial function, and preclinical drug discovery. All methods and analyses described are for research use only.
ATP quantitative analysis services provide validated LC-MS/MS methods for ATP, ADP, and AMP quantification with energy charge calculation in research samples.
Figure 1: LC-MS/MS method parameters for ATP, ADP, and AMP quantification
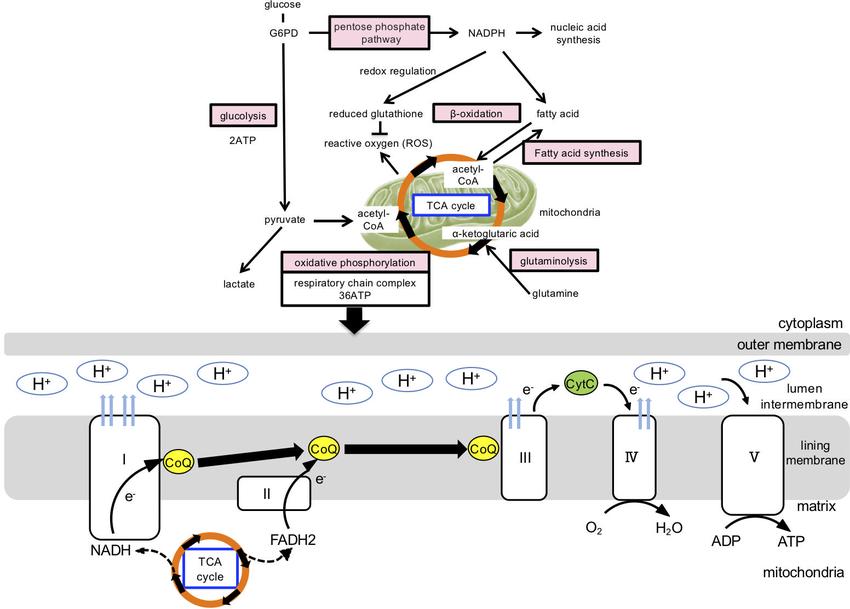
This Is Not a Biochemical Review of ATP
The existing resource on this topic already covers: ATP molecular structure (adenine + ribose + triphosphate), five synthesis pathways with detailed enzyme sequences (glycolysis with 10 steps and energy investment/payoff phases, the citric acid cycle with 8 steps, oxidative phosphorylation with four ETC complexes and chemiosmosis, beta-oxidation of fatty acids, and the phosphocreatine system), ATP hydrolysis chemistry with the 30.5 kJ/mol energy release value and its coupling to four types of cellular work, the ATP cycle concept, and factors influencing ATP production including oxygen, nutrients, and exercise intensity. This guide does not repeat those topics.
It addresses the practical questions that arise after understanding ATP biochemistry: how to measure ATP, ADP, and AMP accurately from biological samples by LC-MS/MS, how to calculate the energy charge and interpret its changes across different experimental conditions, how to distinguish mitochondrial from cytosolic ATP depletion, how to use ATP levels as a pharmacodynamic readout in preclinical drug discovery studies, and how to optimize sample preparation to preserve the in vivo adenylate distribution.
Figure 2: Adenylate energy charge in different cellular states
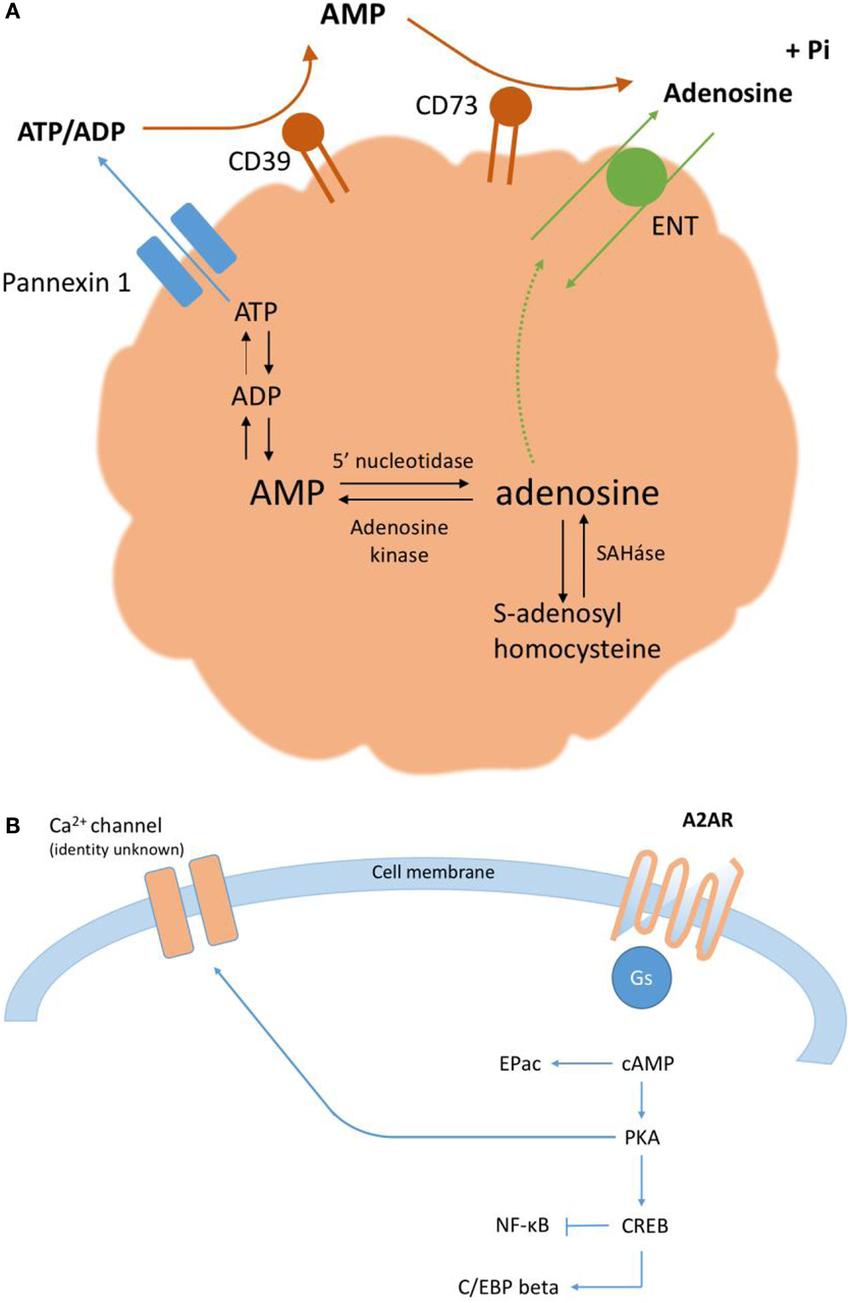
The Adenylate Energy Charge — ATP, ADP, and AMP as a Single System
Measuring ATP alone provides an incomplete picture of cellular energy status. The Atkinson energy charge (EC), defined as EC = (ATP + 0.5 ADP) / (ATP + ADP + AMP), integrates all three adenylate species into a single value between 0 (all AMP) and 1 (all ATP). The EC of healthy, metabolizing cells is tightly maintained at 0.85-0.95 across species and cell types — from bacteria to mammalian neurons — by the near-equilibrium adenylate kinase reaction (2 ADP ⇌ ATP + AMP), which buffers the adenylate pool against rapid changes in any one species.
When ATP is consumed, ADP rises, and adenylate kinase converts 2 ADP to ATP + AMP. The resulting ATP is used for cellular work; the resulting AMP accumulates and serves as the signal for metabolic adaptation through AMPK activation. This is why AMP is a more sensitive and earlier indicator of energy stress than ATP — a 10% decrease in ATP typically produces a 5-10-fold increase in AMP due to the adenylate kinase equilibrium constant of approximately 1.0 favoring AMP production when ADP accumulates. Measuring only ATP misses this early warning signal. In metabolic research, AMP levels provide information about the direction and magnitude of energy stress that is simply not accessible from ATP measurements alone.
EC values in specific research contexts provide diagnostic information about metabolic status. In proliferating cancer cells under aerobic glycolysis (the Warburg effect), EC is maintained at 0.88-0.92 despite high glucose consumption because glycolysis compensates for reduced oxidative phosphorylation — the cells maintain normal ATP levels but at the cost of high glucose flux and lactate production. During apoptosis, EC falls to 0.60-0.70 before cytochrome c release from mitochondria, making it an early marker of the commitment to cell death that precedes the morphological changes detectable by microscopy. In hypoxia (1% O₂ atmosphere for cultured cells), EC drops from approximately 0.90 to 0.75-0.80 within 2-4 hours as oxidative phosphorylation slows and compensatory glycolysis is insufficient to fully replace mitochondrial ATP production. After treatment with mitochondrial toxins (oligomycin at 1-10 µM for ATP synthase inhibition, FCCP at 1-5 µM for mitochondrial uncoupling, rotenone at 0.5-5 µM for Complex I inhibition), EC falls to 0.30-0.50 within 1-2 hours, reflecting the complete block of mitochondrial ATP synthesis and the rapid consumption of the pre-existing cellular ATP pool by ongoing metabolic processes.
The EC calculation from LC-MS/MS data provides an advantage over single-analyte ATP measurements: even if the absolute concentrations of all three adenylates are systematically biased by incomplete extraction recovery, the EC is a ratio that partially cancels this recovery bias. If the extraction recovers 80% of each adenylate equally, the EC calculated from the measured concentrations equals the true EC. If the recoveries differ across adenylates (e.g., ATP 85%, ADP 78%, AMP 65%), the calculated EC is biased, and isotopically labeled internal standards for each adenylate individually correct for these differential recoveries. The use of a single IS for all three adenylates — a common shortcut in some published methods — assumes equal recovery and can produce EC values that are biased by 0.05-0.10 units. This bias is large enough to shift a sample from the normal range (0.85-0.95) to the stressed range (0.75-0.85), potentially leading to incorrect conclusions about the metabolic status of the cells.
For studies involving the phosphocreatine (PCr) system — particularly in muscle, heart, and brain tissue where PCr serves as the primary ATP buffer — measuring ATP alone without accounting for PCr-derived ATP resynthesis can produce misleading energy charge values. In tissues with high creatine kinase activity, ATP is maintained at near-normal levels for several minutes after the onset of ischemia or hypoxia by the PCr + ADP → creatine + ATP reaction, even as the total energy reserve (PCr + ATP) declines. During this period, the energy charge calculated from ATP, ADP, and AMP will appear normal because ATP is continuously regenerated from PCr. Only after PCr is depleted — which occurs within 2-5 minutes in ischemic myocardium — does the EC begin to decline. For studies in muscle or cardiac tissue, including creatine and PCr in the LC-MS/MS panel alongside the adenylates provides the complete picture of tissue energy status that ATP measurement alone cannot capture.
Quantifying ATP, ADP, and AMP Simultaneously by LC-MS/MS
Quantification of all three adenylates requires chromatographic separation of structurally similar nucleotides — ATP and ADP differ by one phosphate group (505.99 vs 426.02 Da monoisotopic mass), and AMP differs from both by the absence of the phosphate chain — combined with stable isotope-labeled internal standards to correct for the rapid enzymatic interconversion that continues during sample processing.
The choice of chromatographic method has direct consequences for quantification accuracy. Some published methods for adenylate quantification use isocratic HILIC conditions (sustained 75% acetonitrile) to maximize throughput — a single injection takes only 6 minutes. However, isocratic methods cannot adequately resolve ATP from GTP in tissue extracts where guanine nucleotides are present at comparable concentrations. The ATP/GTP interference is particularly problematic in proliferating cells where GTP pools are elevated for RNA and protein synthesis. Co-elution of ATP and GTP causes the ATP MRM channel to detect both signals, overestimating ATP and inflating the calculated energy charge by 0.05-0.10 units. A gradient method with a 10-minute run time and 5-minute re-equilibration is recommended for samples with complex nucleotide backgrounds. The total analysis time per sample is approximately 18 minutes, enabling a throughput of up to 80 samples per 24 hours on a single LC-MS/MS system with temperature-controlled autosampler.
For the chromatographic separation, hydrophilic interaction liquid chromatography (HILIC) on a BEH Amide column (2.1×100 mm, 1.7 µm) with a mobile phase of ammonium acetate (pH 9.0)/acetonitrile gradient provides excellent separation of ATP, ADP, and AMP with retention times of approximately 7.2, 5.8, and 3.5 minutes respectively. HILIC is strongly preferred over ion-pairing reverse-phase chromatography for adenylates because it avoids the ion-pairing reagent tributylamine, which causes persistent ion suppression on the column, requires dedicated HPLC systems that cannot be used for other analyses, and produces carryover between injections if the column is not exhaustively washed. The HILIC method resolves ATP from GTP and AMP from IMP, which differ by only one amino group and co-elute on many reverse-phase methods. The gradient starts at 85% acetonitrile containing 10 mM ammonium acetate at pH 9.0 and decreases to 40% acetonitrile over 10 minutes at a flow rate of 0.3 mL/min and column temperature of 40°C. The column is equilibrated at 85% acetonitrile for 5 minutes between injections to maintain retention time reproducibility, which is especially important for the triphosphate nucleotides that are most sensitive to minor fluctuations in mobile phase pH and ionic strength.
For mass spectrometric detection, MRM transitions are optimized in negative ion mode: ATP (m/z 506→408, loss of H₃PO₄, CE 28 eV), ADP (m/z 426→328, loss of H₃PO₄, CE 24 eV), AMP (m/z 346→79, loss of ribose + phosphate producing PO₃⁻, CE 22 eV). The internal standards ¹³C₁₀-¹⁵N₂-ATP, -ADP, and -AMP are added at the beginning of extraction at concentrations that match the expected endogenous adenylate levels (typically 1-10 nmol/mL standard vs 1-5 nmol/mg protein endogenous ATP in most tissues). The peak area ratio between endogenous and labeled species is used for quantification against a calibration curve. The calibration range spans 0.1-100 nmol/mL for all three analytes with linearity R²>0.99 across at least seven calibration points distributed across the full range.
For the energy charge calculation from LC-MS/MS data, the concentrations of ATP, ADP, and AMP (expressed in nmol/mg protein or nmol/10⁶ cells to normalize for sample amount) are entered into the Atkinson formula. The error in the calculated EC is dominated by the error in the AMP measurement, which has the lowest absolute concentration and the highest relative standard deviation (typically 10-15% CV at endogenous levels). Including a pooled QC sample measured every 10-15 injections throughout the analytical batch is essential for monitoring the inter-batch precision of the AMP measurement and the resulting EC calculation. If the QC sample CV for AMP exceeds 20%, the EC values from that batch should be interpreted with caution, regardless of the precision of the ATP measurement. The most common source of AMP imprecision is incomplete chromatographic resolution from IMP and other monophosphate nucleotides — a retention time shift of as little as 0.1 minutes can cause peak overlap and integration errors that disproportionately affect the low-abundance AMP peak. Monitoring the resolution between AMP and IMP (Rs >1.5) in the QC injections throughout the batch provides early warning of column degradation or mobile phase drift before it affects data quality.
Adenosine triphosphate LC-MS/MS quantification provides validated methods for ATP, ADP, and AMP with energy charge reporting. Targeted metabolomics services integrate adenylate quantification with broader metabolic pathway analysis.
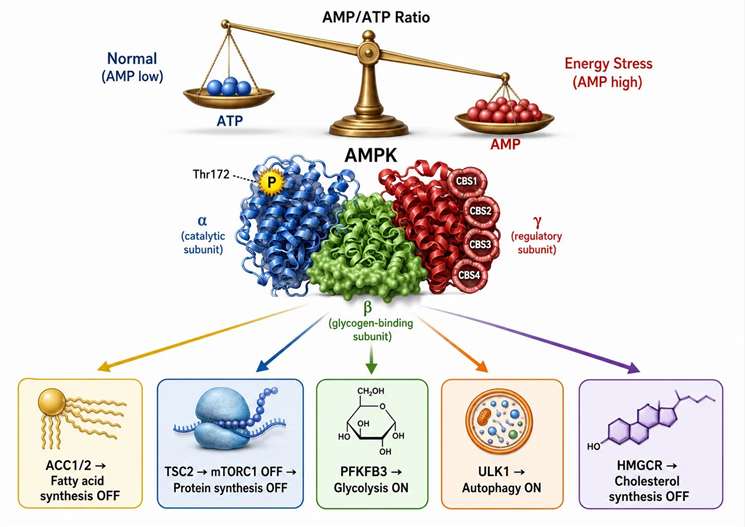
Figure 3: AMPK signaling cascade — energy stress sensing and metabolic reprogramming
Sample Collection and Preparation — Speed Determines Accuracy
Adenylates are among the most rapidly changing metabolites in biological samples. In actively metabolizing cultured cells, the entire ATP pool turns over approximately every 30 seconds at 37°C. Any delay between sample collection and enzyme inactivation causes ATP hydrolysis and ADP/AMP accumulation, producing artificially low energy charge values that do not reflect the in vivo state.
The effect of quenching delay on ATP measurements has been quantified in controlled studies. A 10-second delay at room temperature between cell harvest and methanol quenching reduces measured ATP by 15-25% and increases AMP by 2-3-fold — enough to shift the energy charge by 0.05-0.08 units. A 30-second delay reduces ATP by 40-60%, enough to change the calculated energy charge from 0.90 (normal) to 0.70-0.75 (apparent metabolic stress). Beyond 60 seconds at room temperature, the adenylate profile no longer reflects any in vivo state and instead reports the kinetics of post-harvest ATP hydrolysis. For tissue samples, the delay between excision and freezing must be less than 5 seconds, which is achievable only with liquid-nitrogen-cooled Wollenberger clamps or whole-organ flash-freezing in situ using liquid nitrogen poured directly over the organ while it remains perfused.
For cultured cells, the validated workflow is: aspirate culture medium by rapid vacuum aspiration, immediately add 1 mL ice-cold 60% methanol at -40°C directly to the cell monolayer while the plate remains on a bed of dry ice, scrape cells on ice with a pre-cooled rubber policeman, transfer the cell suspension to a pre-cooled 2 mL tube, perform one freeze-thaw cycle in liquid nitrogen to ensure complete cell lysis, centrifuge at 16,000×g for 10 min at 4°C, collect the supernatant, dry under a gentle stream of nitrogen gas at room temperature, and reconstitute in HILIC-compatible mobile phase (80:20 acetonitrile:water with 10 mM ammonium acetate, pH 9.0). The cold methanol quenching step inactivates all adenylate-interconverting enzymes — adenylate kinase, ATPases, and creatine kinase — within approximately 2 seconds, preserving the in vivo adenylate distribution.
For tissue samples, the workflow is: apply a Wollenberger clamp with liquid-N₂-cooled tongs to the tissue of interest while it remains in situ and perfused, transfer the frozen tissue to a liquid-N₂-cooled mortar, pulverize to a fine powder, add 1 mL of cold 60% methanol per 50 mg tissue, homogenize with a bead beater at 30 Hz for 60 seconds at 4°C, centrifuge at 16,000×g for 10 min at 4°C, and process the supernatant as above. For large tissue pieces where a Wollenberger clamp is not practical — for example, whole mouse brain or large liver lobes — the tissue block should be submerged in liquid nitrogen within 3 seconds of excision, and then only the rapidly frozen outer surface layer (1-2 mm depth) is chipped off for analysis using a pre-cooled scalpel on a dry ice surface. The inner core of the tissue, which froze more slowly, should be discarded because its adenylate profile reflects a mixture of pre-excision and post-excision metabolic states.
Regarding extraction chemistry, perchloric acid (PCA) extraction at 0.5 M PCA at 0°C for 10 minutes effectively precipitates proteins and denatures enzymes, but must be followed by neutralization with KOH or KHCO₃ to bring the pH to 6-7 before LC-MS/MS analysis. The neutralization step adds potassium perchlorate precipitate that must be removed by centrifugation, and the residual potassium concentration can suppress ionization of phosphorylated nucleotides in the ESI source. Acid-catalyzed hydrolysis of ATP to ADP and AMP is negligible at 0°C for the 10-minute extraction period but becomes significant (>5% ATP loss) at room temperature. Cold methanol extraction at -40°C avoids the neutralization step entirely, provides comparable recovery (>85%) for all three adenylates in most biological matrices, and is the preferred method when LC-MS/MS is used as the analytical platform.
AMPK — The Cellular ATP Sensor and Its Role in Metabolic Reprogramming
AMP-activated protein kinase (AMPK) is the primary sensor of cellular energy status and the mediator of metabolic adaptation when the energy charge falls below its set point. AMPK detects the AMP/ATP and ADP/ATP ratios through its regulatory γ subunit, which contains four tandem cystathionine-β-synthase (CBS) domains that bind adenine nucleotides competitively. Under normal energy conditions, ATP occupies all four CBS sites and maintains AMPK in an inactive conformation. When AMP rises during energy stress, it displaces ATP from CBS site 3, causing an allosteric conformational change that exposes the activation loop on the α catalytic subunit for phosphorylation by upstream kinases — primarily LKB1 (constitutively active tumor suppressor) and CaMKKβ (activated by increases in intracellular calcium). Once phosphorylated at Thr172 in the α subunit, AMPK is activated 100-1,000-fold above its basal activity.
Activated AMPK phosphorylates a coordinated network of downstream targets: acetyl-CoA carboxylase (ACC1/2, Ser79) to inhibit fatty acid synthesis and promote mitochondrial fatty acid oxidation by reducing malonyl-CoA, HMG-CoA reductase to inhibit cholesterol synthesis, TSC2 to activate the TSC complex and inhibit mTORC1, thereby globally suppressing cap-dependent protein synthesis, PFKFB3 to generate fructose-2,6-bisphosphate and activate glycolysis for rapid ATP production, and ULK1 to initiate autophagy for nutrient and energy recycling from damaged organelles and protein aggregates. The net effect is a coordinated metabolic switch — biosynthesis is suppressed and catabolic energy production is activated — within minutes of AMPK phosphorylation.
In preclinical studies of metabolic modulators, AMPK phosphorylation at Thr172 is typically measured by phospho-specific western blot or quantitative phospho-proteomics, while ATP, ADP, and AMP levels are measured by LC-MS/MS in the same sample set. The two measurements together — the upstream energy signal (AMP/ATP ratio by LC-MS/MS) and the downstream response (p-AMPK/total AMPK ratio by western blot) — provide a complete view of energy stress sensing and signal transduction. A compound that depletes ATP without activating AMPK suggests either direct AMPK inhibition or a mechanism that operates downstream of the AMPK activation step, providing mechanistic information that ATP measurement alone cannot deliver. Quantifying ATP by LC-MS/MS alongside p-AMPK and its downstream targets provides multi-level validation that the observed metabolic changes are driven specifically by energy stress rather than by off-target compound effects. Targeted metabolomics profiling integrates adenylate quantification with broader metabolic pathway analysis to map the full response to AMPK activation.
Figure 4: Mitochondrial vs. cytosolic ATP pools
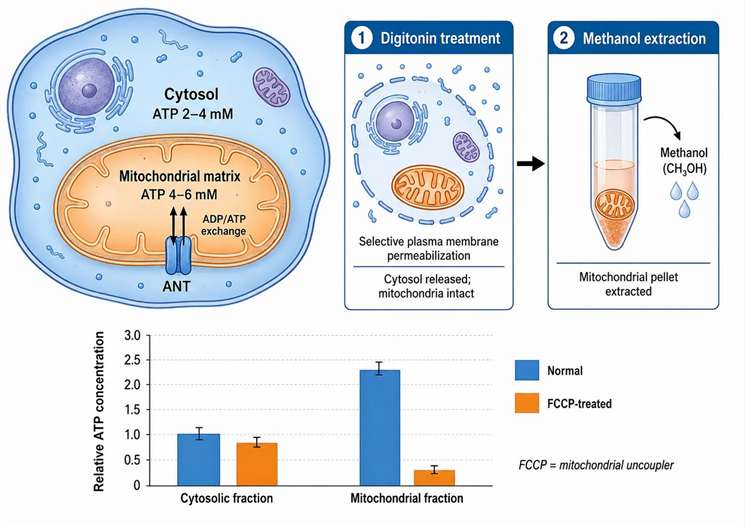
Mitochondrial vs. Cytosolic ATP Pools — Why They Must Be Measured Separately
The total cellular ATP concentration — typically 3-10 mM in mammalian cells — is the arithmetic sum of two compartmentalized pools: the mitochondrial matrix pool produced by ATP synthase from the proton motive force across the inner membrane, and the cytosolic pool consisting of ATP exported from the matrix by the adenine nucleotide translocator (ANT) in exchange for cytosolic ADP. The two pools are connected by ANT-mediated exchange but are not in instantaneous equilibrium. In well-coupled mitochondria, the matrix ATP concentration is 0.5-1.0 mM higher than the cytosolic concentration. This gradient collapses when the mitochondrial inner membrane potential (ΔΨm) is dissipated by uncoupling agents or electron transport chain inhibitors.
Compartment-specific ATP measurement uses selective plasma membrane permeabilization with digitonin at 25-50 µg/mL for 1-2 minutes at 0°C. Digitonin is a cholesterol-binding saponin that binds cholesterol-rich plasma membranes with approximately 100-fold higher affinity than cholesterol-poor intracellular membranes, selectively permeabilizing the plasma membrane while leaving mitochondrial membranes intact. After digitonin treatment and centrifugation, the supernatant contains the released cytosolic fraction and the pellet contains intact mitochondria. Both fractions are extracted with cold 60% methanol and analyzed by LC-MS/MS. Under normal conditions, the cytosolic-to-mitochondrial ATP ratio is 0.7-0.9. After treatment with the protonophore FCCP (1 µM, 30 min) or the ATP synthase inhibitor oligomycin (5 µM, 30 min), the ratio falls below 0.5 as mitochondrial ATP is selectively depleted while cytosolic ATP is maintained temporarily by glycolysis and the phosphocreatine shuttle.
This approach provides mechanistic discrimination between drug classes in preclinical safety pharmacology. A compound that reduces mitochondrial ATP by more than 30% while leaving cytosolic ATP unchanged is classified as a selective mitochondrial toxicant — its primary mechanism involves mitochondrial function impairment. A compound that reduces both pools equally is a general metabolic inhibitor affecting energy metabolism globally rather than specifically at the mitochondrial level. This distinction is not possible with total cellular ATP measurement alone and is valuable for prioritizing compound series during lead optimization. Customized mitochondrial toxicity assays include compartment-specific ATP quantification for preclinical compound characterization. For additional insights into mitochondria metabolism immunity, explore our in-depth resource.
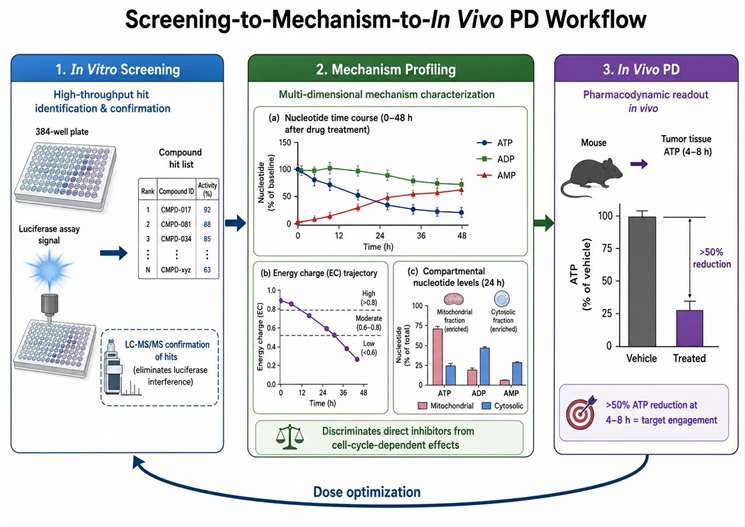
Figure 5: ATP quantification in preclinical drug discovery
ATP Quantification in Preclinical Drug Discovery
ATP measurement serves multiple distinct roles across the preclinical drug discovery pipeline, from primary in vitro screening to in vivo pharmacodynamic biomarker studies, with LC-MS/MS providing analytical specificity that cannot be achieved with enzymatic reporter assays.
The firefly luciferase assay is the dominant method for high-throughput ATP screening because of its speed — a 384-well plate can be processed in 5-10 minutes — and its sensitivity, detecting ATP from as few as 10-100 cells per well. However, luciferase has three well-documented limitations that LC-MS/MS overcomes. First, luciferase is susceptible to direct compound interference: any compound that inhibits the luciferase enzyme itself or absorbs light at the emission wavelength of 560 nm produces a false positive signal for ATP depletion. In a typical high-throughput screen of 10,000 compounds, approximately 3-5% show luciferase inhibition in a counterscreen, requiring orthogonal confirmation. Second, luciferase measures only ATP and cannot simultaneously quantify ADP and AMP, so the energy charge cannot be calculated from luciferase data. Third, luciferase signal saturates at ATP concentrations above approximately 1 µM, requiring sample dilution that introduces pipetting variability and degrades precision at the high end of the concentration range. LC-MS/MS has a linear dynamic range of 0.1-100 nmol/mL (3 orders of magnitude) without saturation, accommodating samples with widely varying ATP content without dilution optimization. The recommended screening workflow is to use luciferase for primary high-throughput screens and LC-MS/MS for hit confirmation and detailed adenylate profiling of confirmed active compounds.
For nucleoside analog and antimetabolite research programs — compounds targeting nucleotide metabolism such as methotrexate, 5-fluorouracil, and gemcitabine — ATP depletion is a pharmacodynamic endpoint that integrates the effects of nucleotide pool perturbation on cellular energy status. The time course of ATP depletion after compound treatment, measured by LC-MS/MS at 2, 4, 8, 24, and 48 hours with sampling at each time point from triplicate wells, distinguishes compounds that cause rapid ATP loss through direct metabolic inhibition from those that cause delayed ATP loss through cell cycle-dependent effects that require progression into S-phase. The ATP/ADP ratio and AMP/ATP ratio provide complementary information: transient energy stress that the cell can recover from produces a reversible change in these ratios, while progressive energy depletion preceding commitment to cell death produces a monotonic trend toward low ATP/ADP and high AMP/ATP that does not reverse upon compound washout.
For in vivo pharmacodynamic biomarker applications, tumor tissue ATP is measured by LC-MS/MS in xenograft models after compound administration by oral gavage or intraperitoneal injection. The ATP content in the tumor tissue, normalized to wet tissue weight (nmol/mg) or total protein (nmol/mg protein), is compared between compound-treated and vehicle-treated groups. A greater than 50% decrease in tumor ATP within 4-8 hours of the first dose is considered evidence of target engagement for a compound that directly or indirectly impairs energy metabolism. The combination of ATP, ADP, and AMP quantification with energy charge calculation provides a more robust PD biomarker than ATP alone: the EC normalizes for differences in tissue extraction efficiency across samples and adjusts for variations in total adenylate pool size between individual tumors. For central nervous system applications, ATP measurement in brain tissue by the same LC-MS/MS method extends the PD analysis to brain-penetrant compounds. Metabolic flux analysis services complement ATP quantification with stable isotope tracing to determine which specific metabolic pathways are affected by compound treatment.
FAQ
What is the Atkinson energy charge and how is it calculated?
EC = (ATP + 0.5 ADP) / (ATP + ADP + AMP). It measures the proportion of the total adenylate pool that is in the high-energy triphosphate form. Healthy cells maintain EC at 0.85-0.95. Values below 0.70 indicate metabolic stress; values below 0.50 indicate that irreversible damage pathways have been activated.
Why measure AMP instead of just ATP?
AMP increases 5-50-fold when ATP decreases by only 10% due to the adenylate kinase equilibrium. AMP is the earliest and most sensitive indicator of energy stress and the direct allosteric activator of AMPK. ATP concentration alone may appear normal while AMP signals an emerging energy crisis.
How quickly must samples be quenched for accurate adenylate measurement?
Within 5 seconds for tissue, within 2 seconds for cultured cells. A 30-second delay at room temperature reduces measured ATP by 40-60% and produces an artificially low energy charge that no longer reflects the in vivo metabolic state.
What is the best extraction method for ATP/ADP/AMP LC-MS/MS?
Cold 60% methanol at -40°C, followed by freeze-thaw, centrifugation, drying under nitrogen, and reconstitution. This method avoids the neutralization step required for acid extraction and provides comparable recovery (>85%) for all three adenylates without the ion suppression caused by residual perchlorate salts from acid extraction.
How do mitochondrial and cytosolic ATP pools differ and how are they measured separately?
Mitochondrial matrix ATP is 0.5-1.0 mM higher than cytosolic ATP under normal conditions. Selective digitonin permeabilization (25-50 µg/mL at 0°C) releases cytosolic contents while preserving mitochondrial membranes, enabling separate LC-MS/MS quantification of the two pools after fractionation by centrifugation.
Can ATP measurement detect drug-induced mitochondrial toxicity?
Yes. A compound that reduces mitochondrial ATP by more than 30% without affecting cytosolic ATP is a selective mitochondrial toxicant. A compound that reduces both pools equally is a general metabolic inhibitor. This mechanistic distinction guides compound prioritization in preclinical lead optimization.
References
- Measuring cellular adenine nucleotides by LC-MS. Methods in Molecular Biology. 2025;284:1-15.
- Liquid chromatography method for simultaneous quantification of ATP, ADP, and AMP. Metabolites. 2022;12:835.
- Recent advances in LC-MS-based metabolomics for cancer research. Mass Spectrometry Reviews. 2023;42:101-134.
- B cell activation via immunometabolism. Frontiers in Immunology. 2023;14:1155421.
- Adenosine A2A receptor signaling. Frontiers in Immunology. 2018;9:402.











