Introduction to PAGE
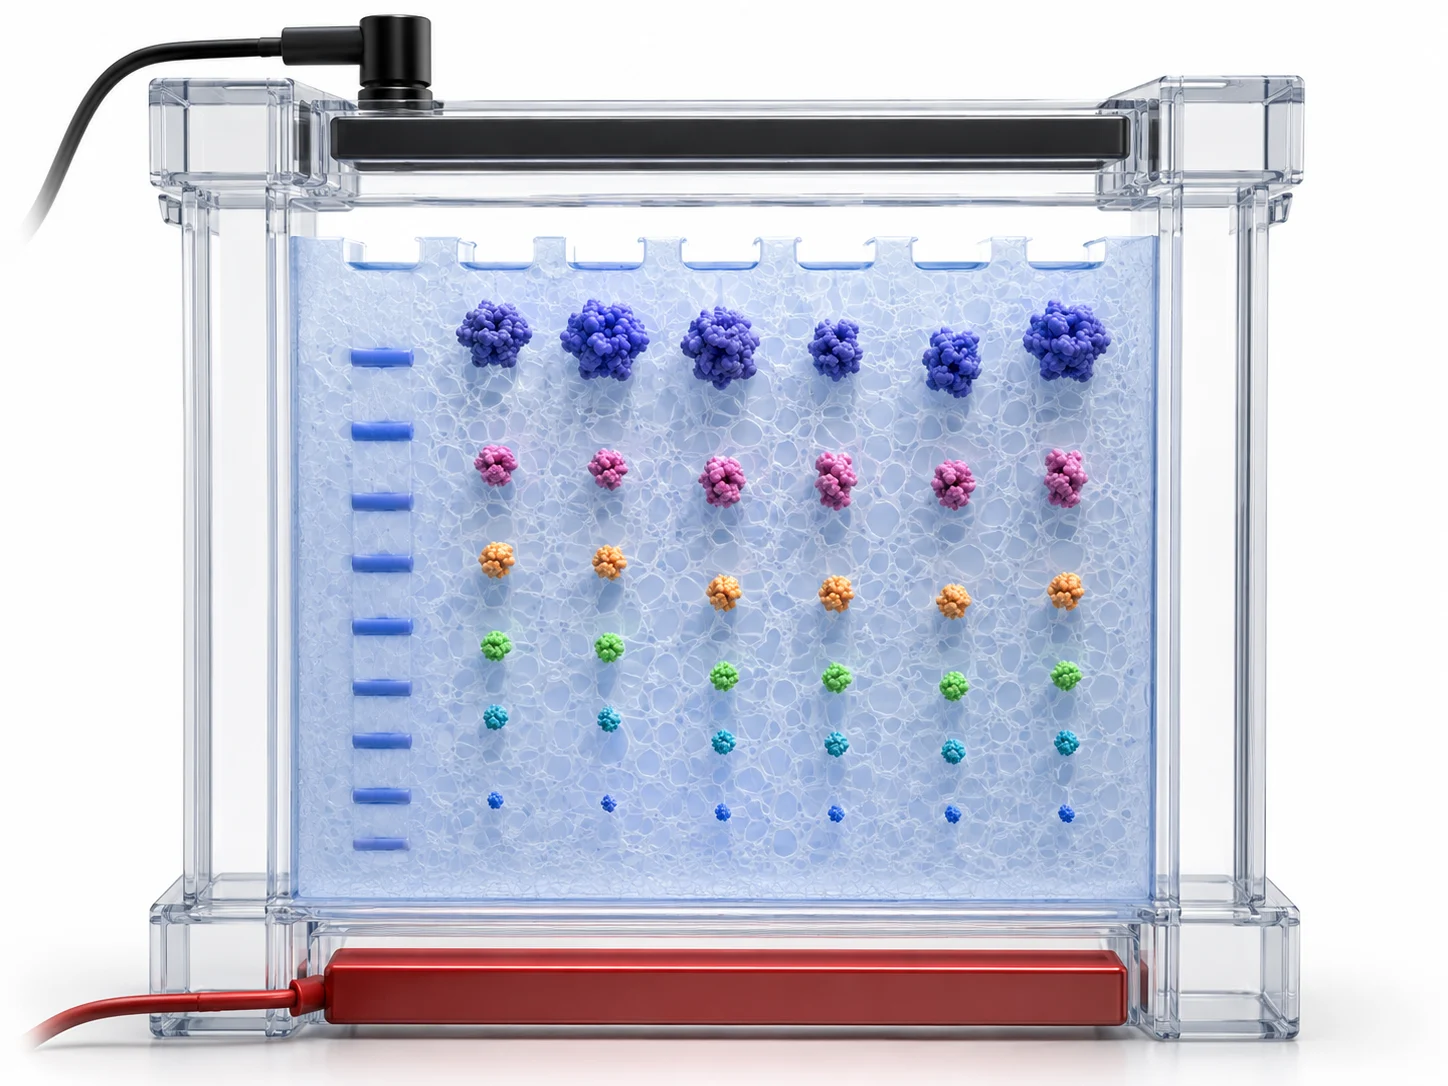
Polyacrylamide Gel Electrophoresis (PAGE) is a cornerstone technique in protein biochemistry, enabling the separation of proteins based on their size and charge as they migrate through a cross-linked polyacrylamide matrix under an applied electric field. The pore size of the gel acts as a molecular sieve — smaller proteins navigate the matrix more rapidly while larger proteins encounter greater resistance, resulting in size-dependent migration patterns that allow high-resolution separation of complex protein mixtures.
Compared to agarose gel electrophoresis, which is typically used for DNA and RNA separation with pore sizes in the micrometer range, PAGE offers significantly higher resolving power for proteins. The polyacrylamide matrix can be precisely tuned by adjusting the acrylamide monomer concentration and cross-linking ratio, producing pore sizes that discriminate between proteins differing by as little as 2% in molecular weight. This resolution makes PAGE indispensable for detecting protein isoforms, post-translational modification variants, and subtle differences in protein composition across experimental conditions.
The significance of PAGE extends across virtually all areas of protein research. It provides high-resolution separation with the ability to detect minor differences in protein composition. It is a versatile and widely used technique that can be adapted for a variety of applications, from basic research to biopharmaceutical quality control. Creative Proteomics provides professional Protein Gel and Imaging services to support researchers in gel-based protein characterization and downstream proteomic analysis. For a focused step-by-step protocol with detailed reagent formulations and equipment specifications, refer to the dedicated gel electrophoresis protocol guide available on the Creative Proteomics resource page.
Figure 1: PAGE Separation Principle
Chemistry of Polyacrylamide Gels
Understanding gel chemistry is essential for reproducible PAGE results. Polyacrylamide gels are formed by the polymerization of acrylamide monomers (CH₂=CH-CONH₂) cross-linked with N,N'-methylenebisacrylamide. The reaction is initiated by ammonium persulfate (APS), which generates free radicals, and catalyzed by TEMED (N,N,N',N'-tetramethylethylenediamine), which accelerates radical formation. The polymerization proceeds rapidly at room temperature, typically completing within 20 to 40 minutes depending on APS concentration and ambient temperature.
Two parameters control gel pore size:
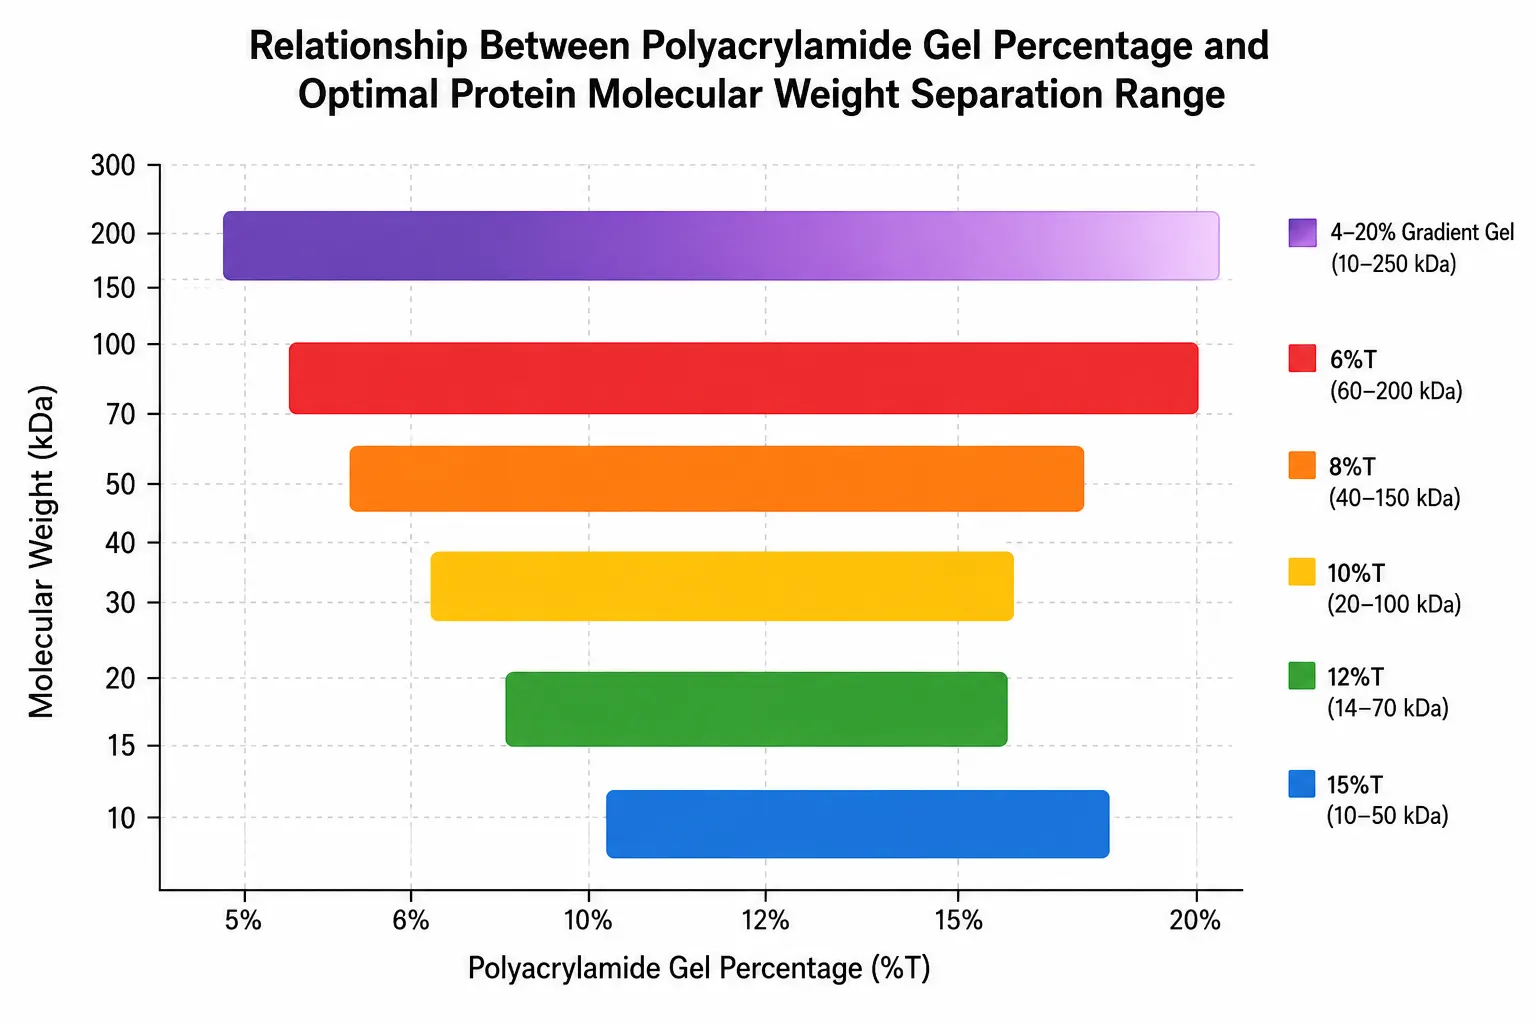
- %T (total acrylamide concentration): The total weight percentage of acrylamide plus bisacrylamide in the solution. Higher %T produces smaller pores. For most protein applications, %T ranges from 5% (large pores, suitable for high-molecular-weight proteins) to 20% (small pores for low-molecular-weight proteins). A 12%T gel, the most common choice, separates proteins optimally in the 14 to 100 kDa range.
- %C (cross-linker concentration): The percentage of the total acrylamide that is bisacrylamide. The standard value is 2.7%C for most applications. Increasing %C to 5% produces smaller pores at a given %T, while values above 5% create more rigid but more brittle gels.
For specialized applications, gradient gels provide a continuous transition from low %T at the top to high %T at the bottom, allowing simultaneous separation of proteins across a wider molecular weight range than uniform %T gels. A 4-20% gradient gel, for example, can resolve proteins from 10 to 250 kDa in a single run.
Figure 2: Gel Percentage and Molecular Weight Separation Range
Major Types of PAGE and Their Principles
Several variations of PAGE exist, each designed for specific analytical purposes. The choice between them fundamentally alters the type of information obtained from the experiment.
SDS-PAGE
Sodium dodecyl sulfate polyacrylamide gel electrophoresis (SDS-PAGE) is the most widely used PAGE method. Proteins are denatured by heating in the presence of SDS, an anionic detergent that binds to the polypeptide backbone at a consistent ratio of approximately 1.4 g SDS per gram of protein. This SDS binding masks the intrinsic charge of the protein and provides a uniform negative charge density, so that all proteins migrate toward the anode based solely on their molecular weight. A reducing agent such as dithiothreitol (DTT) or beta-mercaptoethanol is typically added to break disulfide bonds, ensuring complete denaturation. The relationship between migration distance and the logarithm of molecular weight is linear over a defined range, allowing accurate molecular weight determination when protein standards of known mass are run alongside the sample.
Native PAGE
Native PAGE is performed under non-denaturing conditions — no SDS, no reducing agent, and no heating. Proteins migrate according to their native charge-to-size ratio, retaining their three-dimensional structure, enzymatic activity, and non-covalent interactions with binding partners. This makes native PAGE the method of choice for analyzing protein-protein complexes, detecting enzyme activity directly in the gel through activity staining, and assessing the functional state of purified proteins. The migration pattern in native PAGE is more difficult to predict than in SDS-PAGE because both charge and size contribute to mobility, and molecular weight determination requires comparison with native protein standards of known size and charge.
Blue Native PAGE (BN-PAGE)
Blue native PAGE (BN-PAGE) is a specialized technique for analyzing membrane protein complexes. The anionic dye Coomassie Brilliant Blue G-250 is added to the sample and cathode buffer. The dye binds to hydrophobic surfaces of membrane proteins, providing a uniform negative charge without denaturing the protein complexes. BN-PAGE is particularly valuable for studying mitochondrial respiratory chain complexes, photosystem supercomplexes, and other large membrane-embedded assemblies. For researchers requiring specialized Membrane Protein Identification, BN-PAGE followed by mass spectrometry provides comprehensive characterization of membrane proteomes. The method can resolve complexes ranging from 100 kDa to over 10 MDa and is often used as a first dimension for two-dimensional BN/SDS-PAGE analysis.
Two-Dimensional PAGE (2D-PAGE)
Two-dimensional PAGE combines isoelectric focusing (IEF) in the first dimension with SDS-PAGE in the second dimension. Proteins are first separated by their isoelectric point along an immobilized pH gradient strip, then the strip is placed horizontally across an SDS-PAGE gel for size-based separation in the perpendicular direction. The resulting two-dimensional map can resolve thousands of protein spots from a single sample, making 2D-PAGE a powerful tool for comparative proteomics and differential expression analysis. The method is particularly effective for detecting protein isoforms that differ in pI but have similar molecular weights.
Gradient PAGE
Gradient PAGE uses gels with a continuous %T gradient (typically 4-20% or 8-16%) rather than a uniform concentration. As proteins migrate through the increasing polyacrylamide concentration, they encounter progressively smaller pore sizes, which compresses the bands into sharper zones and extends the effective separation range. Gradient gels are particularly useful for analyzing samples containing proteins of widely different molecular weights in a single run.
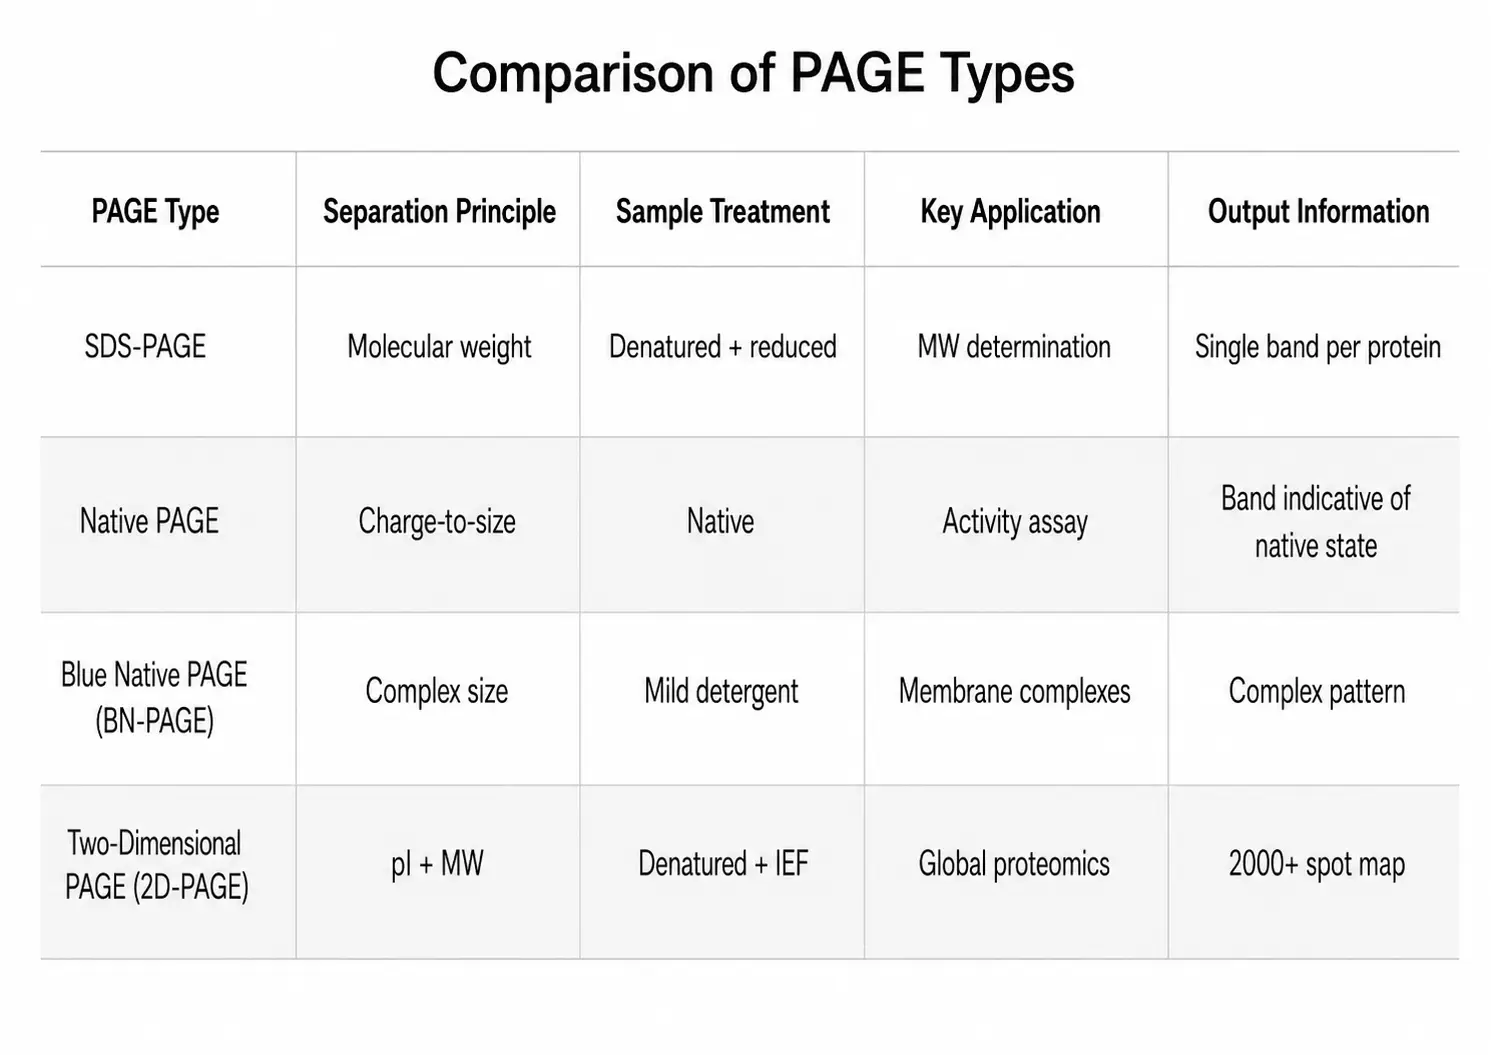
Figure 3: PAGE Types Comparison Table — SDS-PAGE, Native PAGE, BN-PAGE, and 2D-PAGE
Choosing the Right PAGE Method: A Decision Framework
The selection of a PAGE method should be driven by the specific research question, the nature of the protein sample, and the downstream analytical requirements. The following framework provides a structured approach to method selection.
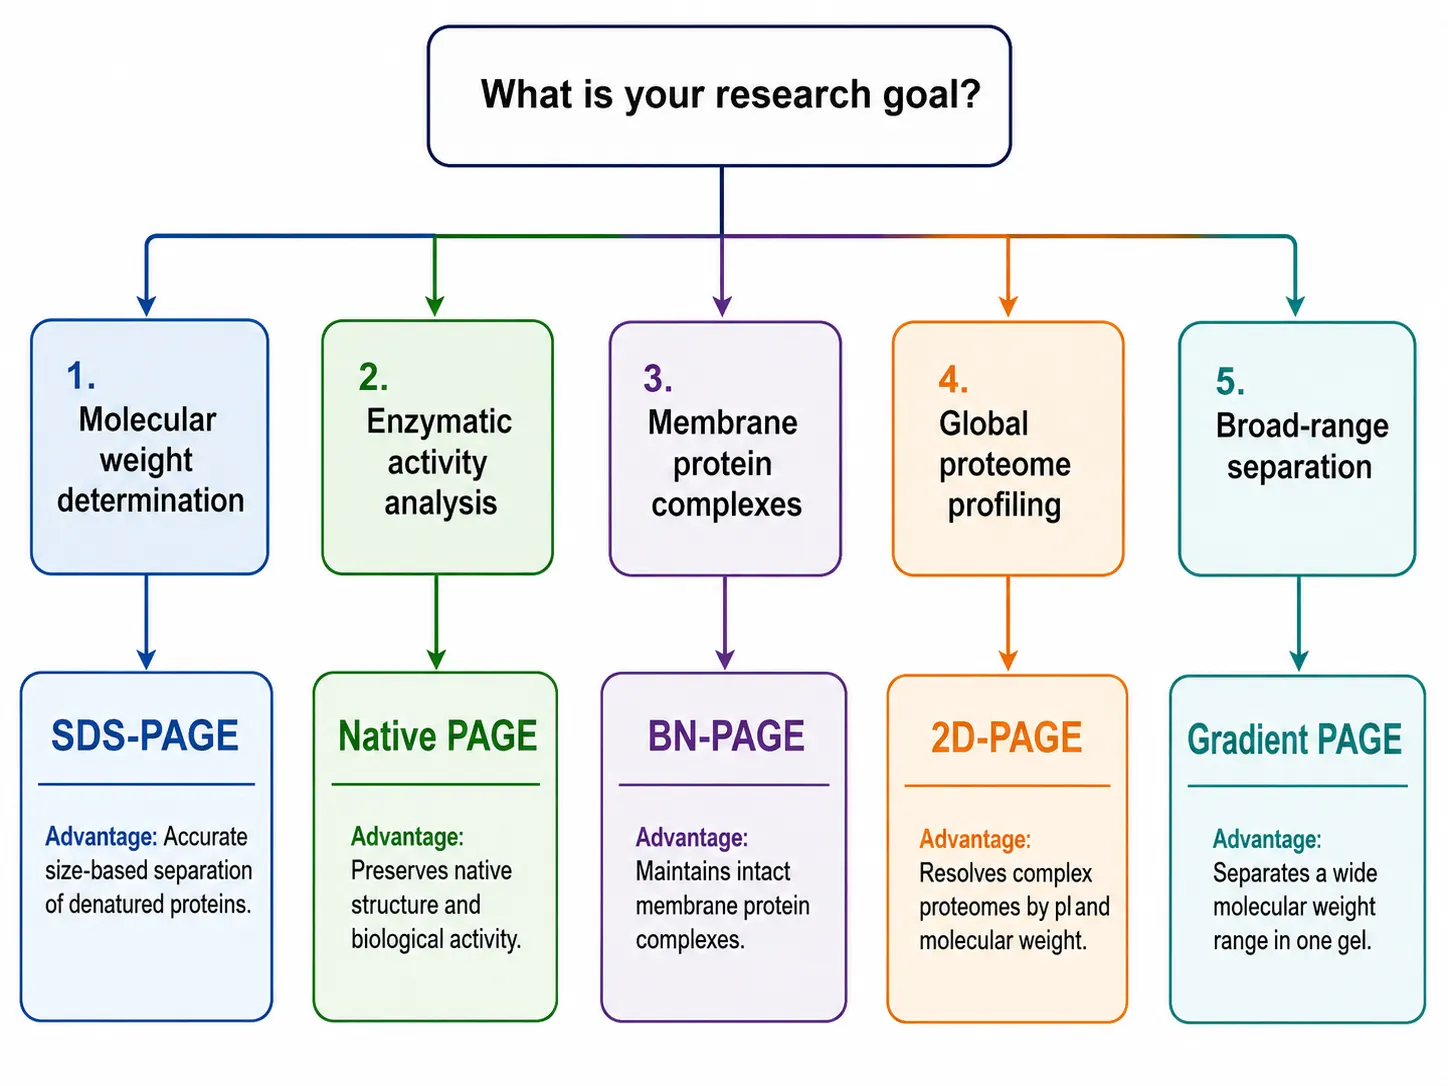
- For molecular weight determination: SDS-PAGE is the clear choice. The denaturing conditions eliminate charge effects, and the linear relationship between log(MW) and migration distance enables accurate mass estimation. This is the standard approach for purity assessment and size characterization of recombinant proteins.
- For enzymatic activity analysis: Native PAGE preserves protein function, allowing in-gel activity assays. After electrophoresis, the gel can be incubated with a chromogenic or fluorogenic substrate to visualize active bands corresponding to the enzyme of interest. This is widely used for studying isozymes, protease activity, and phosphatase activity.
- For membrane protein complex analysis: BN-PAGE is the method of choice. The mild detergent conditions and Coomassie stabilization preserve native complexes while providing sufficient negative charge for electrophoretic migration. The method can be combined with in-gel activity assays and second-dimension SDS-PAGE for subunit composition analysis.
- For global proteome profiling: 2D-PAGE provides the highest resolution for complex protein mixtures. When combined with mass spectrometry-based protein identification, it enables comprehensive analysis of protein expression patterns, isoform distribution, and post-translational modification states across experimental conditions.
- For broad-range separation: Gradient PAGE offers the best compromise when the sample contains proteins with significantly different molecular weights. The continuous pore gradient provides sharp bands across a wider mass range than any uniform gel.
Figure 4: PAGE Method Selection Decision Flowchart
Sample Preparation for PAGE
Sample preparation directly determines the quality of PAGE results. Inadequate preparation is the single most common cause of poor resolution, streaking, and irreproducible band patterns. For researchers who prefer standardized workflows, Protein Sample Preparation services ensure consistent sample quality across large-scale projects.
Reducing agents: For SDS-PAGE, samples are typically reduced with 50-100 mM DTT or 2-5% beta-mercaptoethanol in the loading buffer, followed by heating at 95-100°C for 5-10 minutes. DTT is preferred for downstream mass spectrometry applications because it produces fewer artifacts. For native and BN-PAGE, reducing agents are omitted to preserve native structure.
Detergent compatibility: SDS is the standard detergent for denaturing PAGE. For native PAGE, non-ionic detergents such as Triton X-100 or CHAPS are preferred at concentrations of 0.1-1% to avoid protein denaturation. For BN-PAGE, digitonin or dodecyl maltoside at 1% are used for membrane protein solubilization while maintaining complex integrity.
Protein concentration and loading: The optimal protein load depends on the gel thickness and detection method. For a standard 1.0 mm thick mini-gel with Coomassie staining, 5-20 micrograms of total protein per lane produces well-resolved bands. For silver staining, 0.5-2 micrograms is sufficient. For fluorescent staining, 1-5 micrograms is recommended. Overloading causes band broadening and poor resolution, while underloading leads to faint or undetectable bands. Protein concentration should be quantified by a compatible assay (BCA or Bradford) before loading, and all samples in a comparison should be adjusted to equal concentrations.
SDS-PAGE Protocol
The following protocol describes standard SDS-PAGE for protein separation. All reagents and equipment are listed in the materials section, and the procedure includes optimization notes for researchers adapting the protocol to their specific applications.
Materials
- Acrylamide/bis-acrylamide solution (30%T, 2.7%C, typically stored at 4°C and protected from light)
- Tris buffer (1.5 M Tris-HCl, pH 8.8 for separating gel; 0.5 M Tris-HCl, pH 6.8 for stacking gel)
- SDS (10% w/v solution in water)
- TEMED (N,N,N',N'-tetramethylethylenediamine)
- APS (ammonium persulfate, 10% w/v solution, prepared fresh weekly)
- Running buffer (25 mM Tris, 192 mM glycine, 0.1% SDS, pH 8.3)
- Protein sample (prepared according to sample preparation guidelines)
- Loading buffer (62.5 mM Tris-HCl pH 6.8, 2% SDS, 10% glycerol, 0.01% bromophenol blue, with or without reducing agent)
- Electrophoresis apparatus (vertical gel system with glass plates, comb, and casting stand)
- Power supply (capable of constant voltage up to 200 V)
- Staining solution (0.1% Coomassie Brilliant Blue R-250 in 40% methanol, 10% acetic acid)
- Destaining solution (40% methanol, 10% acetic acid in water)
Procedure
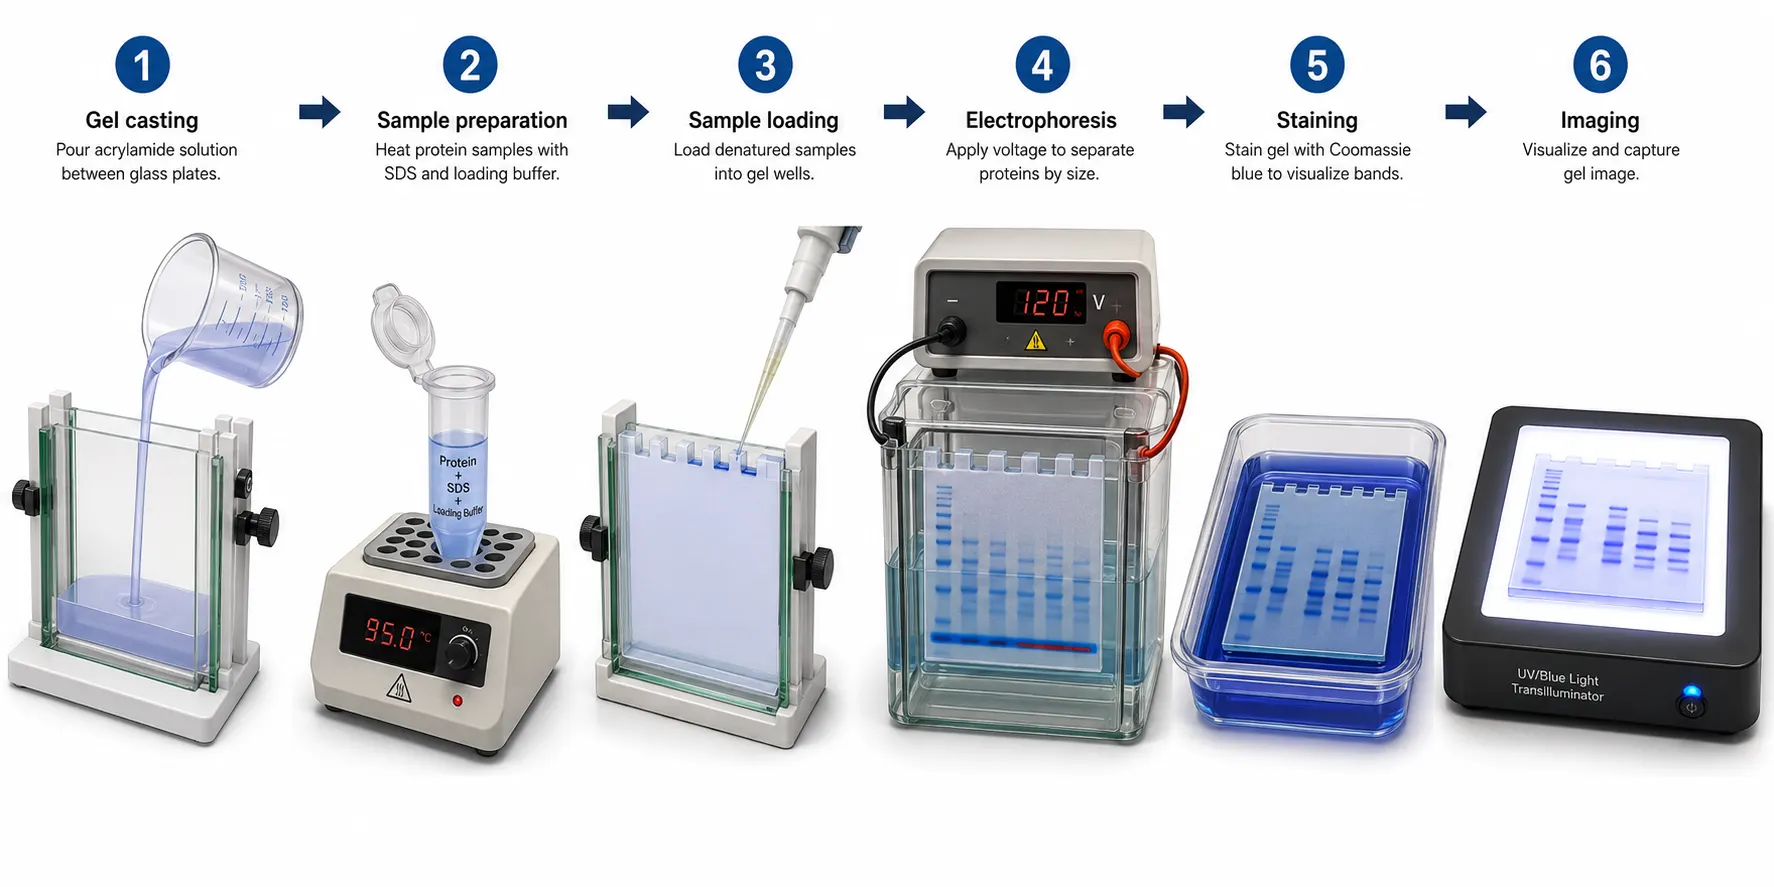
- Prepare the separating gel by mixing appropriate volumes of acrylamide/bis-acrylamide solution, Tris buffer (pH 8.8), SDS, water, TEMED, and APS according to the desired gel percentage and volume. Add TEMED and APS last, as polymerization begins immediately after their addition.
- Pour the separating gel into the assembled gel mold, leaving approximately 2 cm below the bottom of the comb for the stacking gel. Overlay with water-saturated isobutanol or 0.1% SDS to create a flat interface. Allow the gel to polymerize for approximately 30 minutes.
- Prepare the stacking gel by mixing appropriate volumes of acrylamide/bis-acrylamide solution, Tris buffer (pH 6.8), SDS, water, TEMED, and APS. The stacking gel typically uses 4-5%T.
- Remove the overlay solution from the separating gel and rinse the gel surface with distilled water. Pour the stacking gel on top and insert the comb. Allow the gel to polymerize for approximately 30 minutes.
- Remove the comb carefully and rinse the wells with running buffer using a syringe and needle to remove unpolymerized acrylamide.
- Prepare the protein sample by mixing it with loading buffer (typically 1:1 to 1:4 sample-to-buffer ratio) and heat at 95-100°C for 5-10 minutes to denature the proteins. Centrifuge briefly to collect condensation.
- Load the protein sample into the wells using a micropipette with gel loading tips. Include a molecular weight marker in at least one lane for size estimation.
- Fill the electrophoresis chambers with running buffer — the upper chamber must be completely filled above the gel height, and the lower chamber should cover the bottom of the gel.
- Run the gel at a constant voltage of 80-100 V through the stacking gel (until the dye front reaches the separating gel), then increase to 120-150 V for the separating gel. Total running time is typically 45-90 minutes depending on gel percentage and voltage.
- Stop electrophoresis when the dye front reaches approximately 0.5 cm from the bottom of the gel.
- Remove the gel from the apparatus, carefully pry open the glass plates, and transfer the gel to a clean container with staining solution.
- Stain the gel with gentle agitation for at least 1 hour (or overnight for maximum sensitivity) using Coomassie Brilliant Blue R-250 or the staining method of choice.
- Destain the gel in destaining solution with gentle agitation until the background is clear and protein bands are visible. Change the destaining solution 2-3 times during the process.
- Visualize and document the separated proteins by imaging the gel on a transilluminator or gel documentation system. Analyze band patterns using gel analysis software for molecular weight estimation and quantification. Professional Protein Gel and Imaging Analysis services provide high-resolution gel documentation, densitometric quantification, and band excision for downstream MS analysis.
Notes on Protocol Optimization
This protocol provides a general guideline for SDS-PAGE. Specific applications often require optimization of several parameters. The gel percentage should be selected based on the molecular weight range of the target proteins: 6%T for 60-200 kDa proteins, 10%T for 20-100 kDa, 12%T for 14-70 kDa, and 15%T for 10-50 kDa (these %T guidelines are established from cross-referenced methodological studies; see O'Farrell, 1975 for the foundational principles of polyacrylamide gel-based protein separation). Running at lower voltage (80-100 V) improves resolution but increases run time; higher voltage (150-200 V) is faster but may cause band distortion due to heating. Temperature control is important — running the gel at 4°C reduces proteolysis and improves band sharpness for some samples, but may cause SDS precipitation.
It is important to refer to appropriate literature and consult with experienced colleagues when developing and optimizing a PAGE protocol for specific applications.
Figure 5: SDS-PAGE Complete Workflow — From Gel Casting to Imaging
Protein Detection and Visualization
After electrophoresis, proteins must be visualized within the gel. The choice of detection method depends on the required sensitivity, the downstream applications, and whether quantitative information is needed. Four main staining approaches are available, each with distinct performance characteristics.
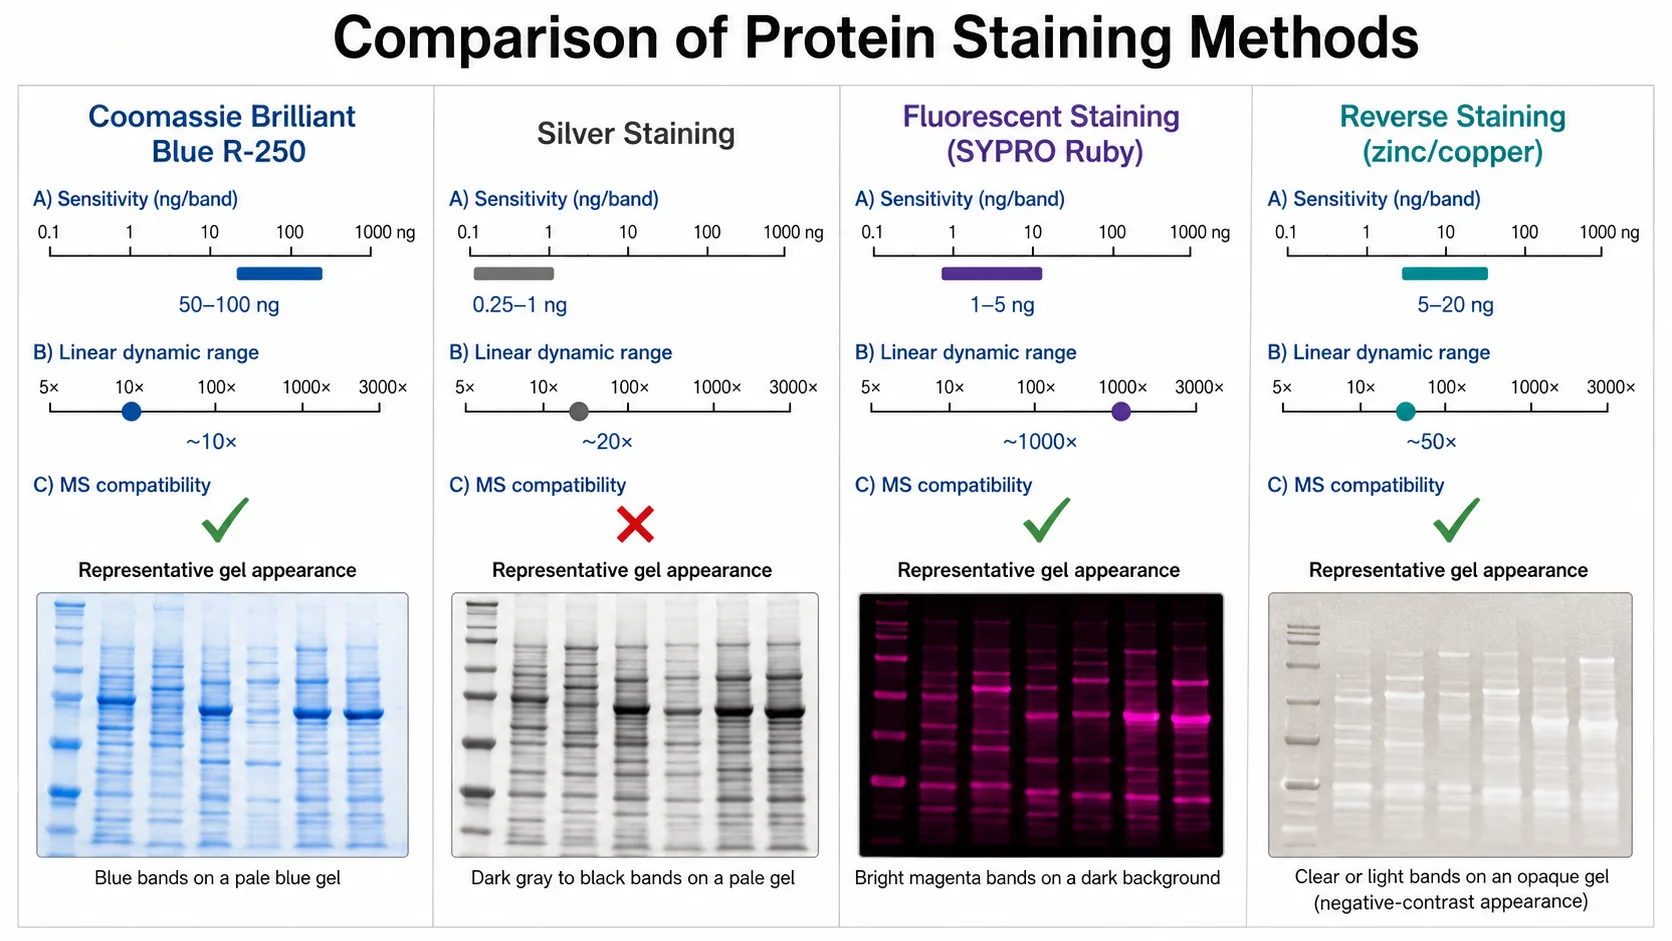
Coomassie Brilliant Blue R-250 is the most widely used staining method for routine PAGE analysis. The dye binds non-specifically to basic and hydrophobic amino acid residues, producing blue bands against a clear background after destaining. The detection limit is approximately 100 nanograms of protein per band, making it suitable for most analytical and preparative applications. Coomassie staining is compatible with downstream mass spectrometry analysis, as the dye does not covalently modify proteins and can be removed during in-gel digestion. A 1-hour staining followed by 2-3 hours of destaining is sufficient for most applications, although overnight staining with extended destaining provides maximum sensitivity within this method's range.
Silver staining offers approximately 100-fold higher sensitivity than Coomassie, with a detection limit of 1-2 nanograms per band. The method relies on the reduction of silver ions bound to proteins, producing dark brown to black bands. Several commercial silver staining kits provide consistent results with a total protocol time of 60-90 minutes. The critical limitation of silver staining is its incompatibility with mass spectrometry — the glutaraldehyde and formaldehyde used in most silver staining protocols covalently cross-link proteins, preventing efficient proteolytic digestion and peptide extraction. Mass-spectrometry-compatible silver staining protocols exist but require omitting the aldehyde fixation steps, which reduces sensitivity to approximately 10-20 nanograms.
Fluorescent staining using dyes such as SYPRO Ruby, Flamingo, or Krypton provides sensitivity approaching that of silver staining (1-2 nanograms per band) while maintaining full mass spectrometry compatibility. The linear dynamic range of fluorescent staining is 2,000- to 3,000-fold, significantly wider than the 10- to 30-fold range of Coomassie and silver staining, making it the preferred method for quantitative proteomics experiments. Fluorescent staining requires a gel documentation system with appropriate excitation and emission filters, which limits accessibility for some laboratories. The total protocol time ranges from 3 hours to overnight depending on the specific stain used.
Reverse staining with zinc or copper salts is a rapid, reversible method that produces transparent protein bands against an opaque white or dark background. The detection limit is approximately 10-50 nanograms, and the method is fully compatible with mass spectrometry because no fixatives or dyes are used. The staining procedure requires only 5-15 minutes, and the stain can be completely removed within 2-5 minutes using a chelating agent such as EDTA. Reverse staining is best suited for preparative applications where specific bands need to be excised for further analysis, such as in Protein Gel and Imaging workflows.
Figure 6: Staining Methods Comparison — Sensitivity, Dynamic Range, and MS Compatibility
Troubleshooting Common PAGE Problems
Even with careful protocol execution, PAGE experiments can produce suboptimal results. The following guide addresses the most frequently encountered problems, their root causes, and practical solutions.
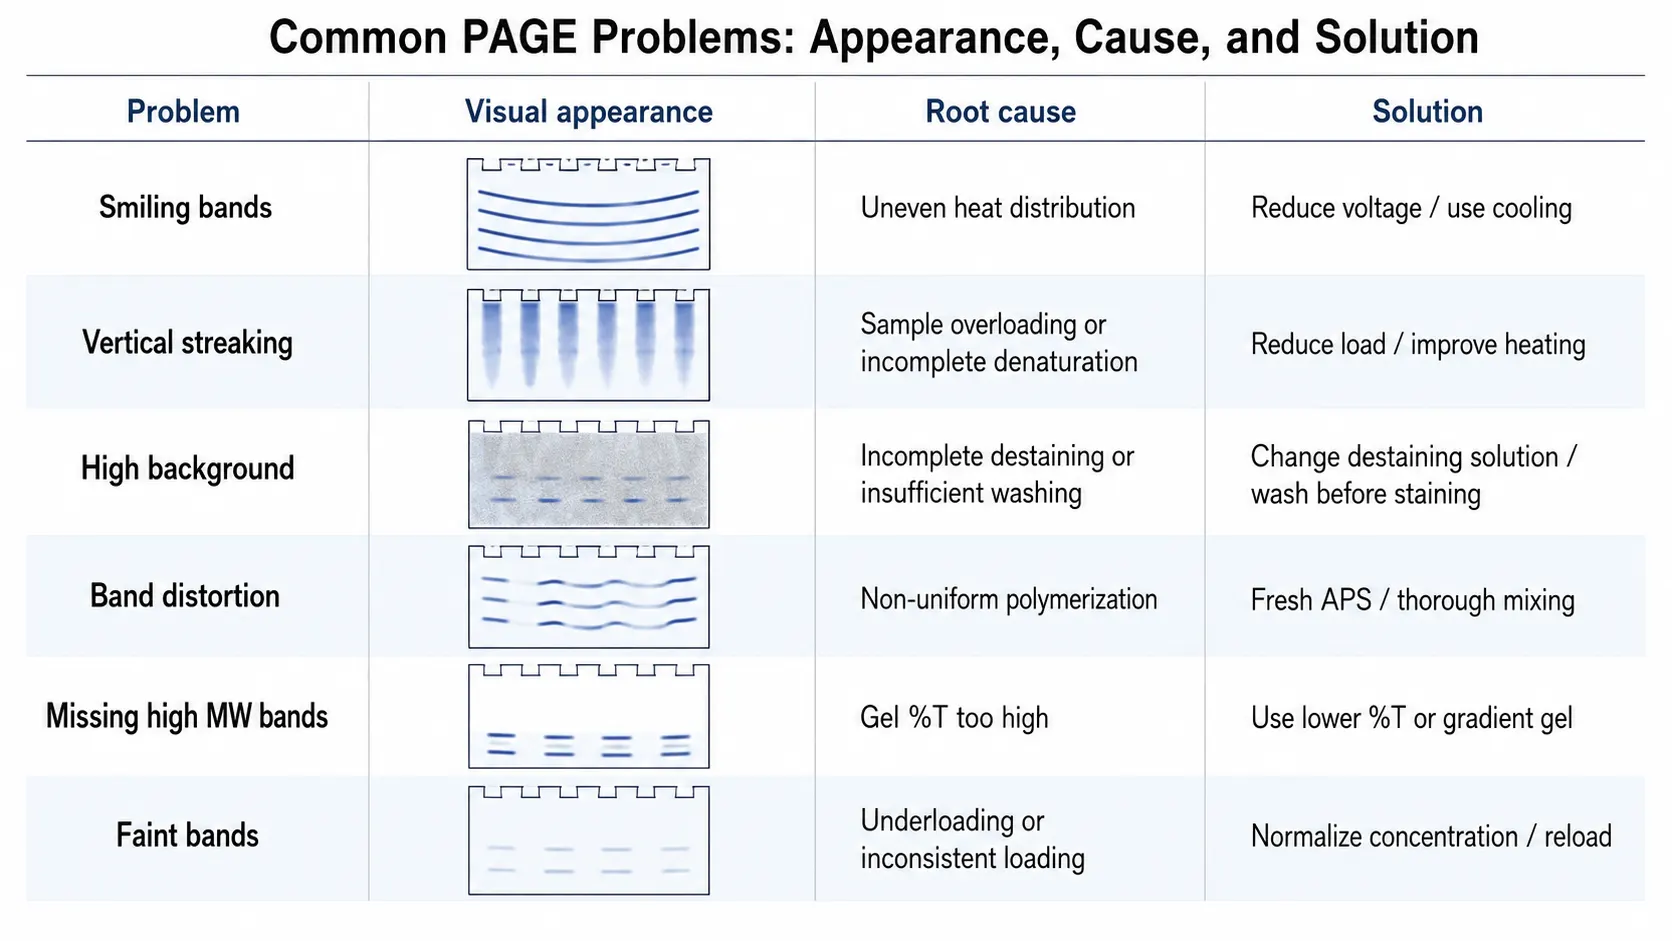
Smiling bands (curved upward at the edges): This is typically caused by uneven heat distribution during electrophoresis. The center of the gel runs hotter than the edges because heat dissipation is less efficient, causing proteins in the center to migrate faster. Running at lower voltage (100-120 V instead of 150-200 V), using a cooling system or running at 4°C, and ensuring the gel is fully submerged in running buffer helps eliminate this artifact. For critical separations, using a gradient gel can also reduce smiling effects because the increasing polymer concentration at the bottom slows migration and reduces heat generation.
Vertical streaking or tailing of bands: This usually indicates incomplete sample denaturation, protein aggregation, or overloading. Ensure the sample is heated to 95-100°C for the full 5-10 minutes with adequate SDS (at least 1% final concentration) and reducing agent. If the sample contains membrane proteins or other aggregation-prone species, increase the SDS concentration to 2% and consider adding 4-6 M urea to the loading buffer. Reduce the protein load by 50% and verify that the sample is centrifuged at 12,000 g for 10 minutes after heating to pellet insoluble material.
High background after staining: Incomplete destaining is the most common cause. Replace the destaining solution with fresh solution and continue agitating. If background persists, the gel may have been insufficiently washed before staining, or the staining time may have been excessive. For Coomassie staining, ensure the gel is washed in distilled water for 5-10 minutes before staining to remove running buffer components. Adding activated charcoal to the destaining solution can accelerate background removal.
Band distortion or wavy bands: Non-uniform polymerization is the most frequent cause. Ensure the APS solution is freshly prepared (APS degrades within 1-2 weeks at 4°C and should be discarded if polymerization takes longer than 40 minutes). Mix TEMED and APS thoroughly immediately after addition, and pour the gel without introducing air bubbles. Uneven well loading or buffer leakage between wells also causes band distortion — use gel loading tips and avoid overfilling the wells.
Missing high-molecular-weight bands: Large proteins often fail to enter the resolving gel if the %T is too high. For proteins above 150 kDa, use a 6-8%T gel rather than the standard 12%T. For very large complexes above 500 kDa, use gradient gels (4-12% or 4-16%T) or switch to BN-PAGE. Incomplete denaturation or protein aggregation can also prevent high-MW proteins from entering the gel — verify that the sample buffer contains adequate SDS and that the heating step is sufficient.
Faint or inconsistent staining between lanes: Uneven sample loading is the most common cause. Quantify protein concentration using a BCA or Bradford assay and normalize all samples to the same concentration before loading. Verify that the pipette is calibrated and that gel loading tips are properly seated in the wells. If the problem affects specific lanes consistently, check for residual acrylamide debris or incompletely polymerized gel material in the wells.
Figure 7: Common PAGE Problem Diagnosis and Solutions Table
Applications of PAGE in Protein Analysis
The applications of PAGE are diverse and include protein purification and characterization, identification of protein isoforms and variants, analysis of protein-protein interactions, determination of protein molecular weight, and detection and quantification of protein contaminants in food and pharmaceuticals.
Protein purification and characterization: PAGE is used throughout protein purification workflows to assess the progress of enrichment, confirm the presence of the target protein, and evaluate purity at each step. After chromatography, resin binding, and elution, a single PAGE lane can reveal whether the target protein is enriched, whether contaminants remain, and whether degradation or aggregation has occurred. The technique is also essential for characterizing recombinant proteins, confirming their molecular weight, and detecting truncation products or post-translational modifications that affect mobility.
Identification of protein isoforms and variants: Proteins that differ by a single amino acid substitution, alternative splicing, or post-translational modification often migrate differently on PAGE gels due to changes in charge, size, or both. SDS-PAGE can resolve isoforms differing by as little as 2% in molecular weight, while native PAGE and 2D-PAGE can resolve charge variants that would be indistinguishable by SDS-PAGE alone. This capability is critical for studying disease-associated protein variants, characterizing enzyme isoforms with different catalytic properties, and detecting modification-specific proteoforms.
Analysis of protein-protein interactions: Native PAGE and BN-PAGE are used to detect and characterize protein complexes. When two proteins interact, the complex migrates as a single band at a different position than either individual protein, providing direct evidence of complex formation. The stoichiometry of the complex can be estimated from the migration position, and band shifts induced by cross-linking or antibody binding provide additional interaction evidence. These approaches are particularly valuable for studying transient complexes and membrane protein assemblies.
Determination of protein molecular weight: SDS-PAGE remains one of the most practical methods for estimating protein molecular weight. By running a set of protein standards of known mass alongside the sample and plotting log(MW) against migration distance (Rf), the molecular weight of an unknown protein can be determined with an accuracy of approximately 5-10%. This is sufficient for most routine applications including recombinant protein confirmation and degradation product analysis. For higher accuracy, mass spectrometry-based molecular mass determination is recommended — Protein Identification Services provide both gel-based and MS-based MW analysis for confident characterization.
Detection and quantification of protein contaminants: PAGE is widely used in quality control applications to detect and quantify protein contaminants in purified products. In the biopharmaceutical industry, SDS-PAGE analysis of drug substance is a standard release test for detecting process-related impurities, host cell proteins, and degradation products. In food analysis, PAGE is used to detect adulteration, verify ingredient composition, and quantify allergenic proteins. The combination of gel imaging with densitometric analysis provides semi-quantitative information that is sufficient for many quality control applications.
PAGE in the Proteomics Workflow
PAGE serves as the starting point for gel-based proteomics, one of the most established approaches for protein identification and characterization. After PAGE separation, individual bands or spots of interest are excised from the gel, destained, and subjected to in-gel digestion with trypsin or another protease. The resulting peptides are extracted from the gel piece and analyzed by liquid chromatography-tandem mass spectrometry (LC-MS/MS) for protein identification.
The gel-based approach offers several advantages over gel-free proteomics. The visual readout of the gel provides immediate information about protein abundance, molecular weight, and heterogeneity before mass spectrometry analysis. Band excision allows selective analysis of specific proteins of interest, reducing the complexity of the peptide mixture entering the mass spectrometer and improving the depth of analysis for medium- and low-abundance proteins. The physical fractionation provided by gel separation also improves the dynamic range of detection, making it easier to identify low-abundance proteins in the presence of highly abundant species.
For researchers who prefer to outsource the post-PAGE analysis, Digestion (in-gel or in-solution) services provide professional in-gel digestion, peptide extraction, and LC-MS/MS analysis starting from excised gel bands or protein solutions. The integrated workflow from PAGE through mass spectrometry to bioinformatic data analysis is available through Creative Proteomics' comprehensive proteomics service portfolio.
Comparison of gel-based vs. gel-free proteomics:
- Gel-based (PAGE + LC-MS/MS): Provides visual quality control, enables selective targeting of specific bands, offers better dynamic range for low-abundance proteins in complex mixtures. Best suited for targeted protein identification, isoform analysis, and protein interaction studies.
- Gel-free (shotgun proteomics): Higher throughput with automated sample processing, better suited for global proteome profiling and quantitative comparisons, eliminates the gel-related biases (protein solubility, MW range limitations). Best suited for large-scale discovery proteomics and biomarker screening.
The two approaches are complementary — many proteomics projects begin with a gel-based pilot study to evaluate sample quality and identify key proteins of interest, followed by targeted gel-free analysis for in-depth characterization.
Emerging Developments in Gel Electrophoresis
While PAGE is a mature technology, several recent developments are extending its capabilities and addressing its traditional limitations.
AI-based gel band analysis is transforming the way gel images are interpreted. In 2025, GelGenie was published in Nature Communications as an AI-powered framework that can automatically identify gel bands in seconds across a wide range of experimental conditions. The system uses a deep neural network trained on thousands of gel images to detect bands, estimate molecular weights, and quantify band intensities with accuracy comparable to expert human analysts. This technology promises to standardize gel data analysis, reduce manual interpretation time, and improve the reproducibility of gel-based quantification across laboratories.
Automated and high-throughput PAGE systems now incorporate robotic loading arms, automated gel staining and destaining, and integrated imaging systems that can process hundreds of gels per day. These systems are increasingly adopted in contract research organizations and biopharmaceutical quality control laboratories where standardized, high-throughput protein analysis is required.
Capillary gel electrophoresis (CGE) is emerging as a complementary technology that offers the same size-based separation principle as slab-gel PAGE but in a microfluidic format with automated injection, real-time detection, and digital data output. CGE provides higher resolution and reproducibility than traditional PAGE for certain applications, particularly protein sizing and purity analysis. For researchers requiring high-throughput protein sizing without band excision, CGE platforms such as the LabChip GXII provide automated analysis of up to 96 samples per run with digital molecular weight assignment. However, CGE lacks the preparative capability of slab-gel PAGE — once separated, the proteins cannot be excised for downstream analysis, which limits its use in proteomics workflows that require band excision and mass spectrometry.
Microfluidic PAGE integration represents another frontier. Microfluidic chips that combine gel casting, sample loading, separation, staining, and detection in a single disposable device are in active development, with early commercial prototypes demonstrating reproducible protein separation from nanoliter-scale sample volumes. These systems promise to reduce hands-on time, improve inter-run reproducibility, and enable protein analysis in settings where traditional slab-gel infrastructure is unavailable.
Frequently Asked Questions
What is the difference between PAGE and agarose gel electrophoresis?
PAGE uses a polyacrylamide matrix with precisely controllable pore sizes suitable for protein separation (5-250 kDa range), while agarose gels have larger pores suited for DNA and RNA separation (100 bp to >10 kb range).
How do I choose the right acrylamide percentage for my protein?
For target proteins in the 10-50 kDa range, use 15%T; for 14-70 kDa, 12%T; for 20-100 kDa, 10%T; for 60-200 kDa, 6-8%T. Gradient gels (4-20%T) cover the broadest range in a single run.
What is the difference between SDS-PAGE and native PAGE?
SDS-PAGE denatures proteins and separates by molecular weight alone; native PAGE preserves native structure and separates by charge-to-size ratio, maintaining enzymatic activity and protein interactions.
How much protein should I load per lane?
For Coomassie staining, 5-20 micrograms per lane; for silver staining, 0.5-2 micrograms; for fluorescent staining, 1-5 micrograms. Load 50% less for a 0.75 mm gel and 50% more for a 1.5 mm gel.
Why are my protein bands smearing?
Common causes include sample overloading, incomplete denaturation, protein aggregation, or degraded samples. Reduce the load by half, verify heating at 95-100°C for 5-10 minutes, and centrifuge the sample before loading.
Can I use PAGE for membrane protein analysis?
Yes, using BN-PAGE which preserves membrane protein complexes in their native state. Standard SDS-PAGE can also be used but requires adequate detergent (2% SDS) and may not fully solubilize all membrane proteins.
How do Coomassie and silver staining compare in sensitivity?
Coomassie detects ~100 ng per band, while silver detects ~1-2 ng per band. However, silver staining is incompatible with mass spectrometry, whereas Coomassie is MS-compatible.
What is the role of TEMED and APS in gel polymerization?
APS generates free radicals to initiate polymerization, and TEMED catalyzes radical formation. Both must be added last to the gel solution, as polymerization begins immediately after their addition.
Can PAGE gels be stored before use?
Precast gels can be stored at 4°C in a sealed bag with running buffer for 1-4 weeks. Hand-cast gels should be used within 24-48 hours for optimal resolution, as desiccation and APS decomposition gradually affect pore structure.
How does gradient PAGE differ from uniform percentage PAGE?
Gradient gels provide a continuous range of pore sizes, allowing simultaneous separation of both high- and low-molecular-weight proteins in a single lane. They also produce sharper bands due to the focusing effect as proteins encounter decreasing pore sizes during migration.
References
- O'Farrell, P. H. (1975). High resolution two-dimensional electrophoresis of proteins. Journal of Biological Chemistry, 250(10), 4007-4021. doi:10.1016/S0021-9258(19)41496-8
- Aref, J., et al. (2025). Validation of blue- and clear-native polyacrylamide gel electrophoresis protocols to characterize mitochondrial oxidative phosphorylation complexes. PLOS ONE, 20(9), e0332065. doi:10.1371/journal.pone.0332065


