

Plant hormones — also termed phytohormones — are small signaling molecules that coordinate growth, development, and stress responses across tissues and organs at nanomolar to micromolar concentrations. The eight major classes (auxins, cytokinins, gibberellins, abscisic acid, ethylene, brassinosteroids, jasmonates, and salicylic acid) operate not in isolation but through extensively interconnected signaling networks where crosstalk between pathways determines the phenotypic outcome. The existing resource on this topic provides a foundational overview of hormone classification, function, and basic mechanism. This guide extends that foundation into analytical practice: how to quantify multiple plant hormones simultaneously by LC-MS/MS, how to interpret hormone profiles in the context of signaling crosstalk, and how to design experiments that capture the dynamic changes in hormone levels during development and stress responses. All methods and analyses described are for research use only.
Plant hormone analysis services provide validated LC-MS/MS methods for simultaneous quantification of major hormone classes in a single analytical run.
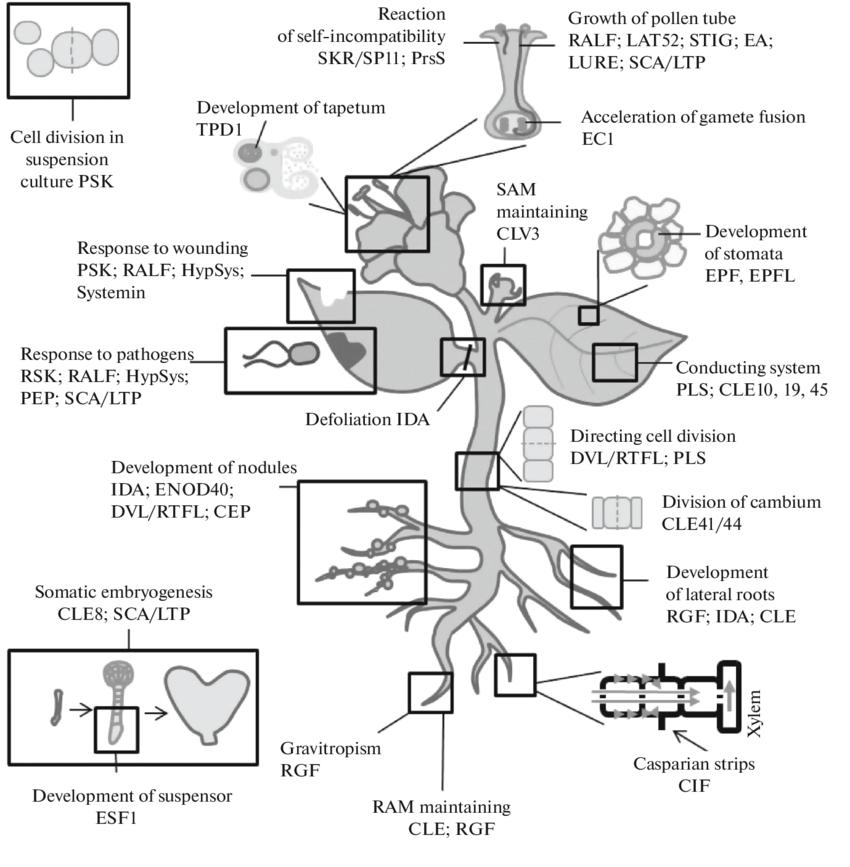 Figure 1. The plant hormone landscape — eight hormone classes with biosynthetic origin and key signaling components
The Eight Classes of Plant Hormones — A Concise Reference
The existing resource already provides detailed Function/Examples/Mechanism breakdowns for each hormone. This section provides a condensed reference framework for the analytical discussion that follows.
Auxins (indole-3-acetic acid, IAA as the principal form) regulate cell elongation, apical dominance, and root initiation through the TIR1/AFB receptor—Aux/IAA repressor—ARF transcription factor module. Auxin concentration at tissues is established through a combination of local biosynthesis (via the TAA1/YUCCA pathway from tryptophan), polar transport via PIN and AUX1 carriers, and conjugation/degradation (IAA-amino acid conjugates and oxidation by DAO enzymes). The analytical challenge for auxin quantification is its low endogenous concentration (0.1-10 ng/g fresh weight in vegetative tissues) and its rapid in vivo turnover — auxin biosynthesis responds to light and gravity within minutes. IAA is detected in negative ion mode at m/z 174→130 with a limit of quantification of approximately 0.05 ng/g in leaf tissue. The IAA precursor indole-3-butyric acid (IBA) and the storage form IAA-aspartate can be measured in the same run with MRM transitions at m/z 202→158 and m/z 289→130 respectively.
Cytokinins (zeatin, isopentenyladenine, and their riboside and nucleotide forms) promote cell division, delay senescence, and regulate shoot/root balance. Signaling occurs through a histidine kinase receptor—phosphorelay—type-B response regulator pathway. Cytokinins exist as multiple interconverting forms (free base, riboside, ribotide, glucoside) that differ in biological activity, making it essential that the quantification method distinguishes these forms rather than measuring total cytokinins as a single pool. The free bases (trans-zeatin and isopentenyladenine) are the most biologically active, while the ribosides and ribotides are transport and storage forms that require enzymatic conversion (by LOG family phosphoribohydrolases) to release the active base. Quantifying the ratio of active base to total cytokinin (base + riboside + ribotide) indicates whether the tissue is in a state of active cytokinin signaling (high base fraction) or cytokinin storage/transport (low base fraction). Cytokinins are detected in positive ion mode because the adenine moiety protonates efficiently, with trans-zeatin at m/z 220→136 and isopentenyladenine at m/z 204→136. The O-glucoside and N-glucoside conjugates are irreversibly inactivated forms that should also be monitored — if these increase after treatment, the treatment is inducing cytokinin inactivation rather than enhancing cytokinin signaling.
Gibberellins (over 130 known, with GA₁, GA₃, GA₄, and GA₇ as the major bioactive forms) stimulate stem elongation, seed germination, and flowering. The GA-GID1-DELLA signaling module functions through DELLA protein degradation. Because most gibberellins are present at sub-nanogram per gram concentrations, they are the most analytically challenging hormone class. Sample preparation requires large amounts of starting material (500 mg-1 g fresh weight), multi-step SPE purification, and derivatization for some forms. Negative ion mode MRM: GA₃ at m/z 345→221 (CE 20 eV), GA₄ at m/z 331→213 (CE 18 eV), GA₇ at m/z 329→285 (CE 16 eV). A 2025 study in Frontiers in Plant Science demonstrated that simultaneous GA₁/GA₃/GA₄/GA₇ profiling in a single run using a UHPLC-QTOF method with post-acquisition MRM extraction provided sensitivity comparable to dedicated triple-quadrupole methods while adding the ability to detect unknown GA metabolites in the same run.
Abscisic acid (ABA) is the primary drought and stress hormone, triggering stomatal closure, dormancy, and adaptive responses through the PYR/PYL receptor—PP2C phosphatase—SnRK2 kinase module. ABA is the most straightforward plant hormone to quantify by LC-MS/MS because of its relatively high concentration (10-500 ng/g in stressed tissues), single predominant form, and clean ionization in negative mode at m/z 263→153 (CE 12 eV) with ²H₆-ABA as the internal standard. The ABA catecholate and phaseic acid metabolites (oxidative catabolism products) are also measurable in the same run and provide information on the rate of ABA turnover — increasing phaseic acid indicates active ABA catabolism, which is relevant for distinguishing new ABA synthesis from release of stored conjugates during stress onset.
Ethylene is the only gaseous plant hormone and cannot be quantified by LC-MS/MS. It is measured as the gaseous effluent from enclosed plant tissue or as its precursor 1-aminocyclopropane-1-carboxylic acid (ACC) by LC-MS/MS in plant extracts (ACC at m/z 102→56 in positive mode). The ACC concentration in tissue is a reliable proxy for ethylene biosynthetic capacity and is frequently used in plant hormone profiling studies as the "ethylene" data point when direct gas measurement is impractical.
Brassinosteroids (brassinolide, castasterone, and their biosynthetic precursors) regulate cell elongation, vascular differentiation, and stress tolerance through the BRI1-BAK1 receptor kinase complex. Brassinosteroids are present at extremely low concentrations (0.01-1 ng/g) and require specific derivatization (boronate ester formation) before LC-MS/MS analysis. The derivatized brassinolide is detected in positive ion mode at m/z 627→609. The low endogenous concentration and complex sample preparation limit brassinosteroid quantification to specialized studies with large sample amounts.
Jasmonates (jasmonic acid JA, its active form JA-isoleucine JA-Ile, and the precursor OPDA) coordinate wound responses, herbivory defense, and male fertility through the COI1-JAZ repressor—MYC2 transcription factor module. JA and JA-Ile are quantified in negative ion mode: JA at m/z 209→59 (CE 14 eV), JA-Ile at m/z 322→130 (CE 16 eV). OPDA (the chloroplast-synthesized precursor with independent signaling activity) at m/z 291→165 is included in multi-hormone panels. A 2025 study in Plants demonstrated that the JA/JA-Ile ratio provides information on JAZ repressor occupancy — high JA-Ile relative to JA indicates active jasmonate signaling with high COI1-JAZ complex formation, while high JA with low JA-Ile indicates the biosynthetic pathway is active but the final conjugation step (catalyzed by JAR1) is limiting.
Salicylic acid (SA) mediates systemic acquired resistance (SAR) and defense against biotrophic pathogens through the NPR1 receptor—TGA transcription factor pathway. SA is one of the highest-concentration plant hormones in challenged tissues (100-5000 ng/g), making it the easiest hormone to quantify reliably. Negative ion mode at m/z 137→93 (CE 18 eV) with ²H₄-SA as internal standard. SA glucoside (SAG) and SA glucose ester (SGE) are inactive storage forms that accumulate during SAR and are quantified in the same run to provide a complete picture of SA metabolism.
Metabolomics services support simultaneous profiling of all quantifiable plant hormone classes in a single sample preparation workflow.
Sample Preparation for Plant Hormone Analysis
Sample preparation is the most critical determinant of data quality in plant hormone analysis. Hormone concentrations change within seconds to minutes after tissue disturbance — wounding triggers jasmonate biosynthesis, while ABA levels respond to changes in turgor pressure. The entire workflow from tissue collection to frozen extract must be completed within 5 minutes at 0-4°C.
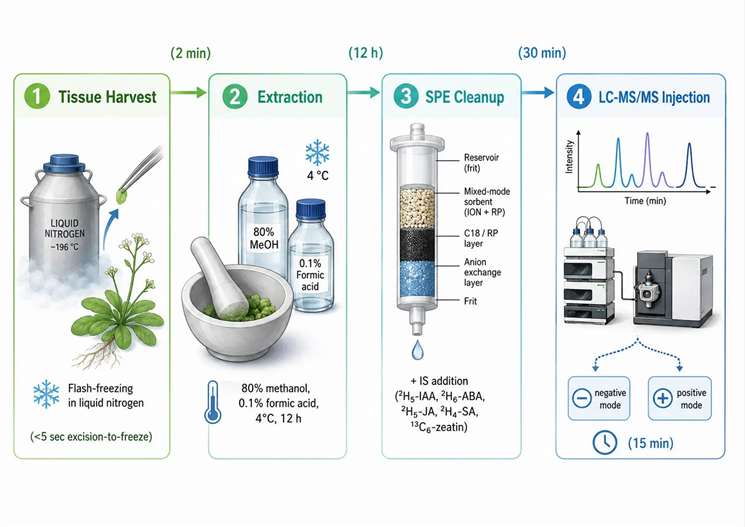 Figure 2. Sample preparation workflow for plant hormone analysis — from tissue harvest to LC-MS/MS injection
Tissue collection: Flash-freeze in liquid nitrogen within 5 seconds of excision. For excised leaves, submerge directly in liquid nitrogen without prior wounding. For roots, remove from growth medium and freeze immediately without washing — washing in water activates stress responses within 30 seconds. For seeds and fruits, freeze the intact organ and dissect frozen.
Extraction solvent: 80% methanol in water containing 1% acetic acid (v/v) is the universal extraction solvent for most plant hormones, providing adequate recovery for IAA, ABA, JA, JA-Ile, SA, and gibberellins in a single extraction. Cytokinins require a separate extraction with 80% methanol without acid, as acidic conditions promote cytokinin ribotide hydrolysis. Brassinosteroids require a separate aqueous extraction followed by liquid-liquid partitioning into ethyl acetate. The choice of solvent system determines which hormones can be quantified from a single extract versus which require separate workflows.
Tissue homogenization: Bead mill homogenization (30 Hz, 60 seconds) in pre-cooled stainless steel tubes maintained at -20°C during homogenization provides the most reproducible cell disruption with minimal heat generation. Mortar-and-pestle homogenization under liquid nitrogen is equally effective but introduces more variability in extraction efficiency. Sonication is not recommended for plant hormone extraction because the heat generated can degrade thermolabile hormones.
Purification and cleanup: After centrifugation at 16,000×g for 10 minutes at 4°C, the supernatant is typically purified by solid-phase extraction (SPE). For most hormone classes, a C18 SPE cartridge removes chlorophyll and lipid matrix components that cause ion suppression in the electrospray source. Polymeric SPE sorbents (Oasis HLB) provide broader recovery across the polarity range of plant hormones and are preferred when analyzing multiple hormone classes from a single extract. The elution solvent must be carefully chosen to elute all target hormones without co-eluting interfering matrix components — 60% methanol with 0.1% formic acid is the standard elution solvent for acidic hormones, while cytokinins require a higher methanol concentration (80%) for quantitative recovery.
Internal standards: Isotopically labeled internal standards must be added before homogenization, not before injection. Adding IS at the beginning of extraction allows the labeled compound to experience the same recovery losses as the endogenous analyte, correcting for both matrix-dependent recovery and ionization suppression. The standard set for comprehensive plant hormone profiling includes ²H₅-IAA, ²H₆-ABA, ²H₅-JA, ²H₄-SA, ¹³C₆-zeatin, and ²H₂-GA₄.
Plant hormone analysis services provide sample preparation protocols optimized for each plant matrix type and hormone class combination.
LC-MS/MS Methods for Plant Hormone Quantification
No single LC-MS/MS method covers all plant hormones simultaneously because the eight hormone classes span a wide range of chemical properties — from the highly polar cytokinins (log P -1 to +1) to the lipophilic brassinosteroids (log P 4-6) and the volatile ethylene precursor ACC. Practical multi-hormone panels combine two or three complementary chromatographic methods to cover the major classes in the same analysis session.
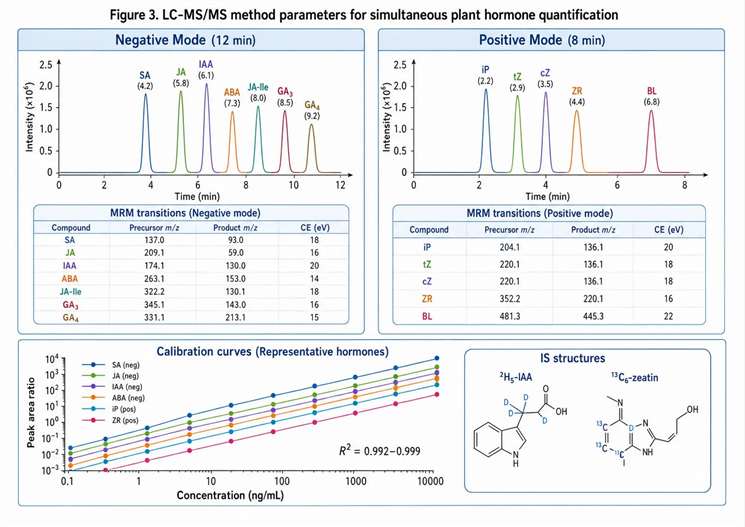 Figure 3. LC-MS/MS method parameters for simultaneous quantification of multiple plant hormone classes
Negative-mode RP-LC panel (most common): A C18 column (2.1×100 mm, 1.7 µm) with a water/acetonitrile gradient containing 0.1% formic acid separates IAA, ABA, JA, JA-Ile, OPDA, SA, and most gibberellins in a 12-15 minute run. This panel covers the acidic and weakly acidic hormones that ionize efficiently in negative ESI mode. Mobile phase pH of 2.5-3.0 (achieved with formic acid) provides the best peak shape for these compounds by suppressing ionization in the mobile phase and ensuring sharp chromatographic peaks. The gradient starts at 5% acetonitrile and increases to 80% over 10 minutes, with a 3-minute re-equilibration. Retention time stability is critical for this panel — IAA and IBA co-elute at acidic pH on most C18 phases and require either longer gradient time or a different column chemistry for separation.
Positive-mode RP-LC panel (cytokinins): Cytokinins are quantified in positive ion mode using the same C18 column with a water/methanol gradient containing 10 mM ammonium formate at pH 5.5. The ammonium formate buffer improves peak shape for adenine-containing cytokinins by preventing tailing caused by secondary interactions with the silica support. trans-Zeatin, isopentenyladenine, dihydrozeatin, and their riboside and glucoside forms are quantified in a single 18-minute run. The cytokinin panel can be run from the same extract as the negative-mode panel with a separate injection, or from a dedicated cytokinin-optimized extract.
HILIC method for ACC: 1-aminocyclopropane-1-carboxylic acid (ACC), the ethylene precursor, is quantified by HILIC with an amide-bonded stationary phase in positive ion mode at m/z 102→56. The highly polar, zwitterionic ACC is retained poorly on C18 under any conditions and requires HILIC for adequate chromatographic retention. The HILIC method also co-quantifies other polar metabolites such as proline, betaine, and polyamines that serve as osmotic stress indicators, providing complementary information to the hormone panel.
Sensitivity considerations: Plant hormones are present at femtomole quantities per gram of tissue. The LLOQ requirements for a typical plant hormone panel are: IAA 0.05 ng/g (0.3 fmol/mg), ABA 0.5 ng/g, JA 0.2 ng/g, SA 1 ng/g, cytokinins (free base forms) 0.01 ng/g. Achieving these LLOQs in a real plant extract requires optimized ion source parameters (spray voltage, source temperature, gas flows), adequate SPE cleanup, and a modern triple quadrupole with ion funnel or collision cell technology. Older instruments may require sample concentration or larger starting tissue amounts to meet these sensitivity requirements. Plant hormone analysis services use validated methods with documented LLOQs for each hormone class across different plant matrices.
Hormone Crosstalk — Why Single-Hormone Measurements Miss the Biological Picture
Plant hormones do not act independently. The phenotypic response of a plant to any stimulus is determined by the ratio and temporal sequence of multiple hormones, not by the absolute level of any single hormone. Single-hormone measurements provide an incomplete and potentially misleading picture of the plant's physiological state.
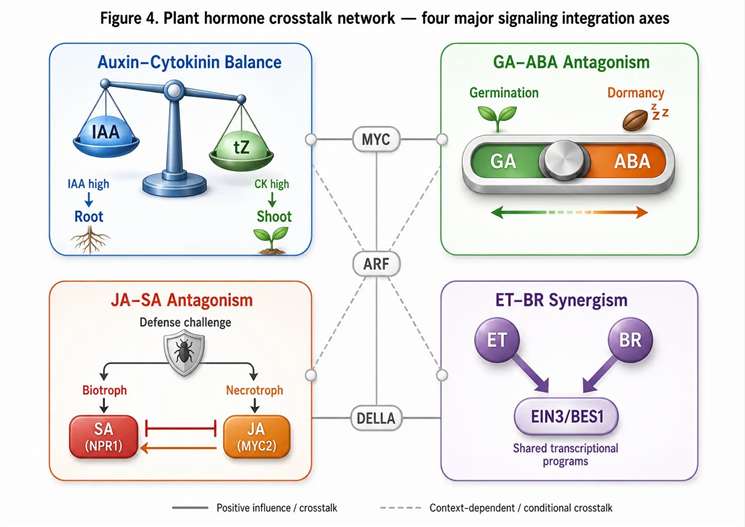 Figure 4. Plant hormone crosstalk network — four major signaling integration axes and their analytical readouts
JA-SA antagonism is the most extensively characterized crosstalk axis. JA promotes defense against necrotrophic pathogens and herbivores, while SA promotes defense against biotrophic pathogens. The two pathways antagonize each other through multiple mechanisms: SA inhibits JA biosynthesis by suppressing LOX2 expression, while JA promotes SA degradation through enhanced catabolism. The JA/SA ratio in challenged tissue predicts which defense program is activated — a high JA/SA ratio (>10) indicates necrotrophic defense mode, while a high SA/JA ratio (<0.1) indicates biotrophic defense mode. A 2025 study in Plants demonstrated that the JA-SA ratio in Arabidopsis leaves infected with different pathogen types shifted by two to three orders of magnitude within 4-8 hours, providing a rapid and robust molecular indicator of the active defense program that correlated with transcriptomic data from the same samples.
Auxin-cytokinin balance determines the shoot/root ratio and meristem identity. High auxin/cytokinin ratios promote root initiation and suppress shoot branching, while high cytokinin/auxin ratios promote shoot differentiation and inhibit root elongation. In tissue culture, the auxin/cytokinin ratio in the growth medium determines whether callus differentiates into shoots (low auxin/cytokinin) or roots (high auxin/cytokinin). In intact plants, the spatial gradient of the auxin/cytokinin ratio across the root-shoot axis is a key determinant of organ identity and patterning. Quantifying this ratio by LC-MS/MS at different positions along the root-shoot axis provides a molecular basis for understanding developmental patterning in mutant and transgenic lines.
GA-ABA antagonism controls seed dormancy and germination. High ABA/GA ratios maintain dormancy, while the shift to high GA/ABA ratios is required for germination. The GA/ABA ratio integrates environmental signals (light, temperature, water) into a molecular decision about germination timing. ABA promotes the synthesis of DELLA proteins, which inhibit GA signaling; GA promotes DELLA degradation through the GID1-SCF^SLY1 pathway. The ratio measured by LC-MS/MS in imbibing seeds at different time points after stratification provides a kinetic picture of dormancy release that cannot be obtained from single-time-point measurements.
JA-ethylene synergism in wound response. JA and ethylene act synergistically in activating wound-response genes. JA alone or ethylene alone produces a weaker wound response than the combination, and the JA+ethylene co-response activates a distinct set of defense genes not activated by either hormone alone. In practice, this means that measuring JA without ACC in a wound experiment gives an incomplete view of the defense response. Including ACC in the analytical panel — measured by HILIC-MS/MS from the same extract — provides the ethylene proxy needed to interpret the full wound response from a single sample set. Targeted metabolomics services support multi-hormone ratio analysis across developmental, stress, and treatment time courses.
Applications of Plant Hormone Profiling in Research
Plant hormone profiling by LC-MS/MS is applied across a wide range of research questions in plant biology, agricultural research, and natural product discovery.
Stress physiology: Drought, salinity, heat, and cold stress all produce characteristic hormone signatures that can be quantified by LC-MS/MS to determine the stress response state of a plant. ABA is the primary rapid-response signal for drought (within 5-30 minutes), while JA and SA are elevated during longer-duration stress adaptation. The combination of ABA, JA, SA, and ethylene (as ACC) in a single panel provides a comprehensive stress hormone signature that distinguishes acute from chronic stress and identifies the primary stress type. A 2025 study in Environmental and Experimental Botany demonstrated that the ABA/JA/SA tripartite ratio distinguished drought-stressed from salt-stressed from wound-stressed Arabidopsis plants with 94% accuracy, outperforming single-hormone measurements in stress type classification.
Crop improvement research: LC-MS/MS hormone profiling is used to characterize hormone-related phenotypes in mutant and transgenic lines, to screen natural germplasm for hormone production variants, and to monitor hormone levels during breeding selection. For gibberellin research, profiling the complete GA biosynthetic pathway (from ent-kaurene to bioactive GA₁ and GA₄) identifies which step is limiting in a dwarf mutant or a GA-overproducing line. For JA research in legumes, profiling the JA pathway intermediates (OPDA, JA, JA-Ile) simultaneously with the amino acid pool provides a complete picture of the JA biosynthesis and conjugation capacity of the tissue.
Biostimulant and agrochemical evaluation: Plant hormone analysis is used to evaluate the mechanism of action of biostimulants (seaweed extracts, microbial inoculants, humic acids) and plant growth regulators (synthetic auxins, cytokinin-releasing compounds, ethylene inhibitors). Biostimulants that promote root growth are expected to increase the auxin/cytokinin ratio in root tissue, while those that delay senescence should increase cytokinin levels in leaves. LC-MS/MS profiling before and after biostimulant application provides a mechanistic readout of the treatment effect at the hormone level that complements phenotypic measurements.
Secondary metabolite regulation: Plant hormones regulate the biosynthesis of secondary metabolites including alkaloids, terpenoids, phenylpropanoids, and glucosinolates. JA is the primary inducer of most defense secondary metabolites, while SA regulates salicylate-derived phenolics. Measuring hormone levels alongside secondary metabolite profiles provides the regulatory framework needed to understand why secondary metabolite levels change under different conditions. Plant hormone analysis services are designed to integrate with secondary metabolite profiling workflows for regulatory mechanism research. Plant metabolomics services provide broader metabolite coverage for studies requiring simultaneous hormone and secondary metabolite profiling.
Spatially Resolved and Tissue-Specific Hormone Analysis
Plant hormones function in a spatially organized context — the same hormone has different effects in different tissues, and the hormone gradient between tissues is itself an information-bearing signal. Standard bulk tissue extraction averages hormone concentrations across the entire organ, masking the spatial information that determines the biological outcome.
Laser-capture microdissection (LCM) combined with LC-MS/MS: LCM allows specific cell layers (epidermis, vascular bundles, mesophyll, guard cells) to be isolated from frozen sections and analyzed separately. Typical LCM yields are 1-5 mg dry weight per section, which is below the optimal input amount for full hormone profiling but sufficient for ABA, JA, SA, and the most abundant cytokinins. The main analytical challenge is the low sample amount, which requires minimal-volume extraction (20-50 µL) and direct injection into a nanoLC-MS/MS system. A 2025 study in the Journal of Cotton Research demonstrated that QuEChERS-HILIC-MS/MS from 50 mg cotton fiber samples provided simultaneous quantification of five hormones (IAA, ABA, GA₃, JA, SA) with LLOQs below 1 ng/g, enabling spatially resolved hormone analysis at the individual fiber cell level during fiber development stages.
In situ hormone imaging: Mass spectrometry imaging (MALDI-MSI or DESI-MSI) provides hormone distribution maps from intact plant tissue sections. Current resolution is 50-100 µm per pixel, which is sufficient to resolve hormone gradients across organ zones but not between individual cell types. IAA and ABA are the most successfully imaged hormones due to their relatively high concentrations and clean ionization. The quantitative accuracy of MS imaging is lower than LC-MS/MS (coefficient of variation typically 20-40% versus 5-15% for LC-MS/MS), but the spatial information it provides is not accessible by any other means.
Phloem and xylem sap analysis: Long-distance hormone signaling occurs partly through phloem and xylem transport. Xylem sap (collected by root pressure exudation or Scholander pressure bomb) contains cytokinins, ABA, and SA at ng/mL concentrations that reflect the root-to-shoot signaling load. Phloem sap (collected by EDTA exudation or aphid stylet sampling) contains JA, SA, and certain cytokinins transported from leaves to developing organs. Measuring hormone concentrations in these sap fractions separately from tissue extracts provides a picture of the systemic signaling component that bulk tissue analysis cannot capture. Metabolomics services support low-volume sap analysis with the sensitivity required for phloem and xylem hormone profiling.
Time-resolved hormone dynamics: Hormone responses to stimuli occur on timescales of minutes to hours. Capturing the dynamics requires serial sampling — typically 5, 15, 30, 60, 120, and 240 minutes after stimulus application — from multiple plant replicates at each time point. The JA response to wounding peaks at 30-60 minutes and declines by 4 hours; the ABA response to drought is detectable within 5 minutes and sustained for days. Designing time-course experiments with sufficient biological replication (minimum 3-4 biological replicates per time point) and consistent tissue sampling procedures is the primary challenge in plant hormone dynamics studies. Targeted metabolomics services support time-course hormone profiling with validated methods that maintain inter-batch consistency across multi-day sample sets.
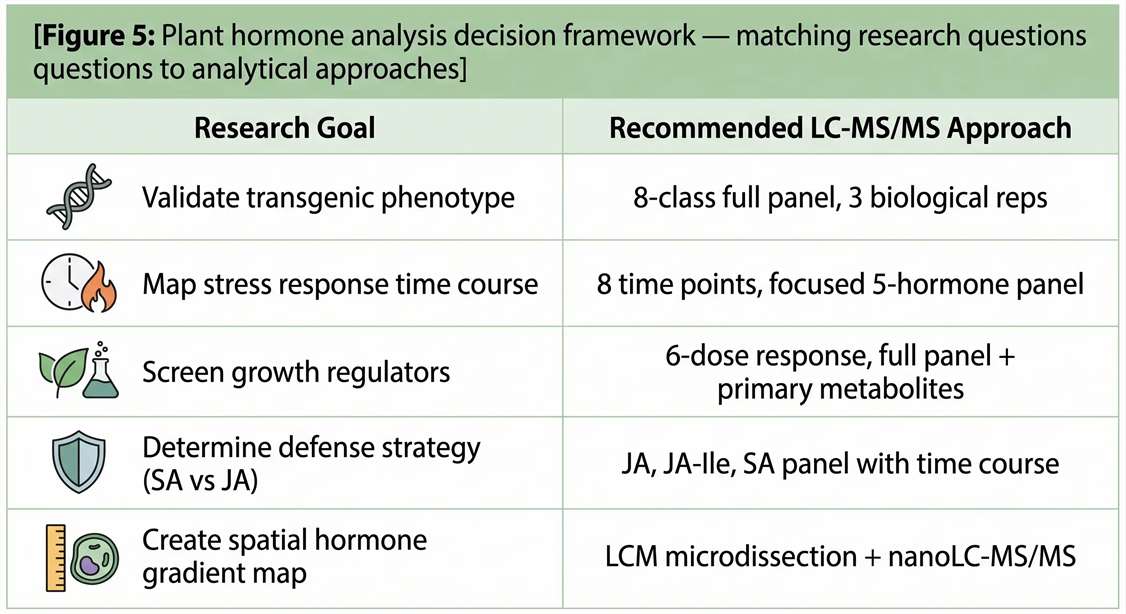 Figure 5. Plant hormone analysis decision framework — matching research questions to analytical methods
Plant hormone analysis services provide end-to-end support for spatially resolved hormone studies, including LCM-compatible extraction protocols and nanoLC-MS/MS methods for low-volume samples. LC-MS/MS untargeted metabolomics services complement targeted hormone panels by providing broader metabolite context in the same analytical session. Customized experiments are available for hormone profiling study designs that fall outside the scope of standard validated panels.
FAQ
How many plant hormones can be quantified in a single LC-MS/MS run?
In negative ion mode, 8-12 hormones (IAA, ABA, JA, JA-Ile, SA, GA₃, GA₄, GA₇, and their labeled internal standards) are quantified in a 12-15 minute run. Cytokinins and brassinosteroids require a separate positive-mode run with a different mobile phase.
What is the minimum tissue amount required for plant hormone analysis?
50-200 mg fresh weight is sufficient for full hormone profiling when using LC-MS/MS with isotopically labeled internal standards. For microdissected samples of 1-5 mg, a subset of the most abundant hormones (ABA, JA, SA) can be measured with reduced precision.
Why measure multiple hormones instead of just one?
Hormone ratios (auxin/cytokinin, GA/ABA, JA/SA) provide more information than individual hormone concentrations. Plant responses are determined by the balance between antagonistic hormone pairs rather than by any single hormone level.
How should plant tissue be collected for hormone analysis?
Flash-freeze in liquid nitrogen within 5 seconds of excision. For whole-plant analysis, freeze the intact plant first, then dissect under liquid nitrogen. Never collect tissue at room temperature for hormone profiling.
What internal standards are used for plant hormone quantification?
²H₅-IAA, ²H₆-ABA, ²H₅-JA, ²H₄-SA, ¹³C₆-zeatin, and ²H₂-GA₄ are commercially available and added at the beginning of extraction. Matrix-matched calibration curves are essential for accurate quantification across different plant matrices.
Can plant hormones be measured in xylem or phloem sap?
Yes. Xylem sap collected by root pressure exudation or Scholander pressure chamber contains cytokinins and ABA at ng/mL concentrations. The sample volume is usually 50-500 µL and requires direct injection after filtration or SPE concentration. Phloem sap collection by EDTA-facilitated exudation or aphid stylet technique yields smaller volumes and requires nanoLC-MS/MS for analysis.
References
- Comparative LC-MS/MS-based profiling of plant hormones across developmental stages. Frontiers in Plant Science. 2025;16:1670979.
- Decoding phytohormone signaling in plant stress physiology. Environmental and Experimental Botany. 2025;229:105564.
- Molecular decoding of phytohormone crosstalk: JA-mediated crosstalk networks. Plants. 2025;14:2647.
- Simultaneous determination of five plant hormones by QuEChERS-HPLC-MS/MS. Journal of Cotton Research. 2024;7:179.
- A tailored high-efficiency sample pretreatment method for plant hormone profiling. Plant Communications. 2020;1:100047.
- Insights into plant hormone signaling networks for environmental adaptation. Springer. 2025;Chapter 26.












