Choosing between BioID and TurboID for a proximity labeling experiment is not a matter of "one is better"—it is a matter of which enzyme's biochemical properties match the specific requirements of your research question. Both enzymes are promiscuous biotin ligases that biotinylate proteins within a defined spatial radius of a bait protein in living cells, but their catalytic rates differ by approximately 100-fold, their optimal substrate concentrations differ by 10-fold, and their labeling time windows differ by 24-fold. These parameter differences translate into practical decisions: which enzyme will capture the interactions you care about, which one will produce data you can interpret, and which one will work in your biological system. This guide provides a quantitative framework for making those decisions, organized around the experimental constraints that determine proximity labeling success. The framework covers five decision dimensions: expression level and labeling kinetics, labeling radius and specificity trade-offs, protocol complexity and workflow duration, data analysis and background control strategies, and cross-species compatibility. Each dimension is supported by quantitative data from the 2020-2026 literature rather than qualitative generalizations.
What the Kinetic Parameters Mean for Your Experiment
The most frequently cited difference between BioID and TurboID is labeling speed, but understanding why TurboID is faster and what that speed costs is essential for experimental design.
Catalytic Efficiency and Its Practical Consequences
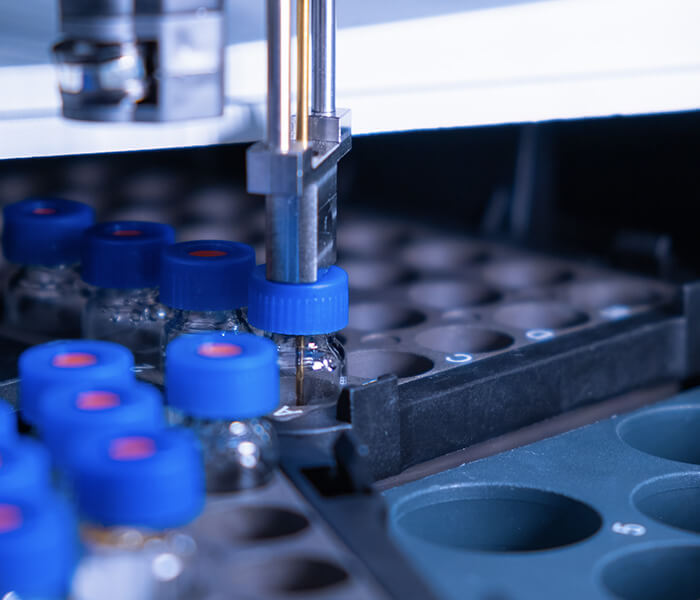
BioID uses a mutant BirA* enzyme (R118G) with a catalytic rate constant (kcat) of approximately 0.003 s−1. At this rate, generating enough biotinylated proteins for reliable MS detection requires 12–24 hours of labeling in culture. TurboID incorporates 15 point mutations that increase kcat to approximately 0.3 s−1, reducing the required labeling time to 10–60 minutes. This 100-fold difference in catalytic efficiency is the single most important parameter for experimental design. For a bait protein expressed at 10,000 copies per cell, BioID will produce detectable biotinylation within 4–6 hours; TurboID achieves equivalent signal in 5–10 minutes. For bait proteins expressed below 1,000 copies per cell, BioID requires the full 24-hour labeling period, while TurboID can produce usable signal within 30–60 minutes. The practical implication is that BioID is more suitable for high-abundance bait proteins where extended labeling does not compromise cell health, while TurboID is preferred for low-abundance baits, toxic proteins, or dynamic events where the labeling window must be minimized.
The biotin concentration requirement is a second critical difference. BioID operates at 50 μM exogenous biotin, which is close to the physiological biotin concentration in standard culture media. TurboID requires 500 μM biotin, a 10-fold higher concentration that can affect cellular metabolism through competition with endogenous biotin-dependent carboxylases. A 2025 study optimizing TurboID in endothelial cells found that 500 μM biotin for 60 minutes caused measurable changes in the expression of biotin-responsive genes (ACACA, PC, MCCC1), while 50 μM biotin for 24 hours (BioID conditions) did not. If your experimental system is sensitive to metabolic perturbations, this trade-off must be factored into the enzyme choice.
A concrete example illustrates these trade-offs. Consider a researcher studying a transcription factor that shuttles between the nucleus and cytoplasm with a half-life of 30 minutes. Using BioID with a 24-hour labeling period, the resulting dataset will contain proteins from both nuclear and cytoplasmic compartments, making it impossible to determine which interactions occur where. Using TurboID with a 30-minute labeling window that matches the shuttling half-life, the researcher can perform separate labeling experiments before and after a stimulus that traps the protein in one compartment. The same logic applies to any protein whose localization or interaction state changes on a timescale shorter than 24 hours.
Another practical scenario is the study of toxic or aggregation-prone proteins. For a bait protein that induces cellular stress or toxicity when overexpressed, the 24-hour BioID labeling period may be incompatible with maintaining cell health. TurboIDs 10-60 minute labeling window allows the bait to be expressed and labeled before toxicity develops, capturing the interaction neighborhood of the protein in its pre-toxic state. This consideration applies to many neurodegeneration-related proteins, including tau, alpha-synuclein, and huntingtin, whose aggregation kinetics are time-dependent.
Figure 1: BioID vs TurboID Labeling Time versus Signal Intensity Curves
 Quantitative comparison of biotinylation signal accumulation over time for both enzymes at low and high bait expression levels, showing the time window required to reach MS-detectable thresholds.
Labeling Radius, Specificity, and the Background Problem
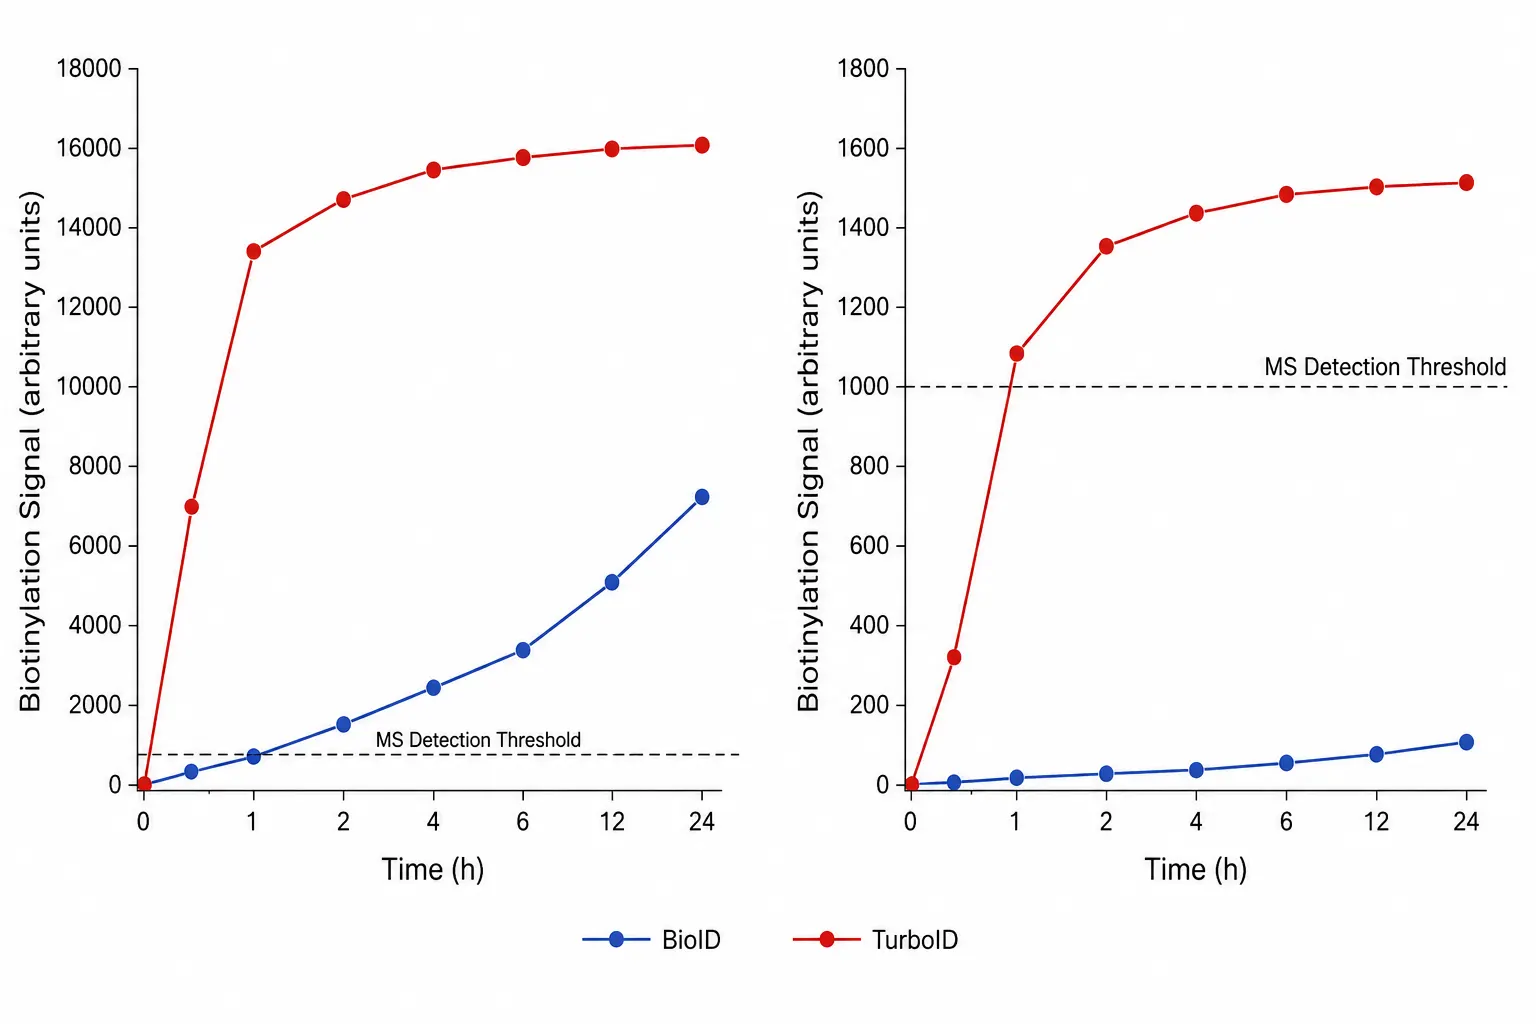
Both BioID and TurboID have an effective labeling radius of approximately 10 nm, measured by DNA nanostructure-based spatial barcoding published in Nature Chemical Biology in 2025. Since both enzymes share the same radius, specificity differences arise not from the enzyme itself but from the labeling duration.
Why Labeling Time Determines Specificity More Than Enzyme Structure
With a 24-hour labeling window, BioID captures proteins that enter the 10 nm proximity zone at any point during the labeling period. This means the resulting dataset represents a time-averaged neighborhood rather than a snapshot of the interactome at a specific moment. If your bait protein shuttles between the nucleus and cytoplasm during the labeling period (as many transcription factors do), BioID will identify both nuclear and cytoplasmic neighbors, producing a dataset that looks like the bait is in both compartments simultaneously. TurboIDs shorter labeling window (10–60 min) reduces this temporal averaging artifact, capturing a more temporally resolved proximity map. The trade-off is that TurboIDs higher biotin concentration increases the background from endogenous biotinylated proteins. The three major endogenous biotinylated proteins in mammalian cells—pyruvate carboxylase (PCC, 130 kDa), methylcrotonoyl-CoA carboxylase (MCC, 80 kDa), and acetyl-CoA carboxylase (ACACA, 265 kDa)—are biotinylated by endogenous holocarboxylase synthetase, not by the experimental BirA* enzyme. They appear at high abundance in both BioID and TurboID datasets regardless of the bait protein. A 2026 STAR Protocols study demonstrated three complementary strategies for managing this background: (1) pre-clearing the lysate with streptavidin agarose beads before the affinity pull-down; (2) including a free BirA* (no bait fusion) control to establish the baseline biotinylation pattern; and (3) culturing cells in biotin-free media for 24 hours before labeling to deplete the endogenous biotin pool. Of these, the free enzyme control is the most informative for downstream data filtering, because it establishes which proteins are biotinylated simply because they are abundant in the proximity of any BirA* enzyme, independent of the bait protein. BioID-MS services and TurboID proximity labeling services routinely incorporate these control strategies as standard components of the experimental design.
Figure 2: Labeling Radius and Temporal Resolution Comparison
 Schematic showing the 10 nm labeling radius for both enzymes, with the 24-hour BioID window capturing time-averaged proximity versus the 10-minute TurboID window capturing real-time neighborhood.
Experimental Protocol Comparison: Where the Details Matter
Beyond enzyme kinetics and specificity, the practical differences in experimental protocols determine which approach integrates more smoothly into existing laboratory workflows.
Critical Protocol Parameters Side by Side
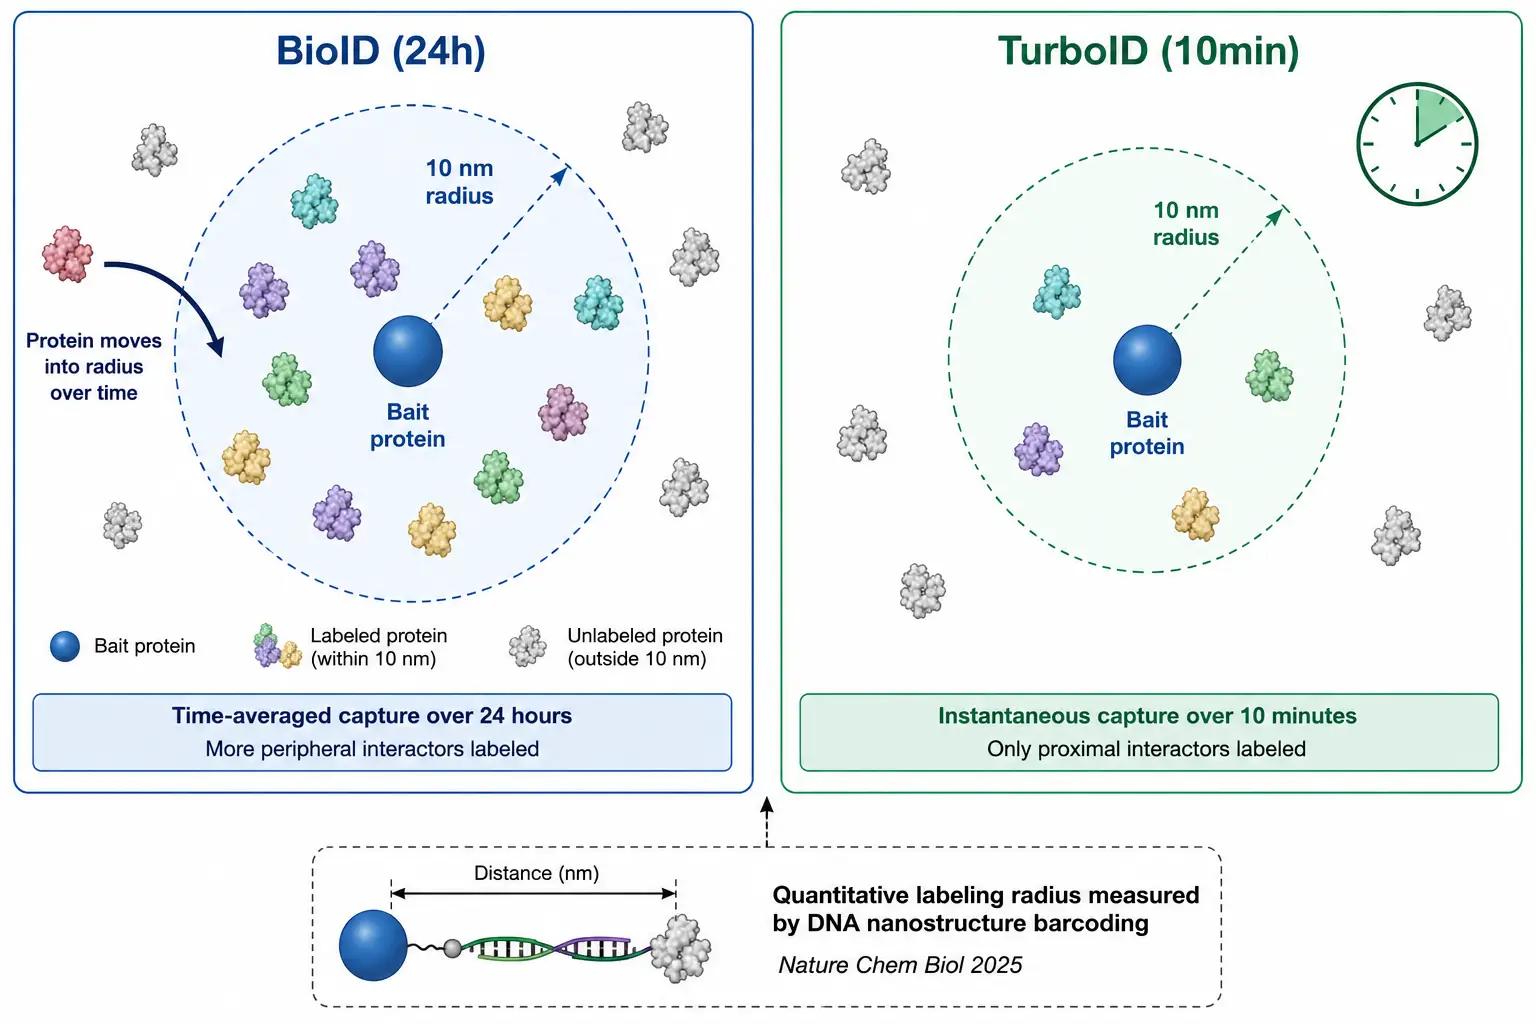
Bait expression strategy differs between the two enzymes. BioID requires stable cell lines or inducible expression systems for most applications because the 24-hour labeling window is incompatible with transient transfection, which typically peaks at 24–48 hours and declines rapidly. TurboIDs shorter labeling window makes transient transfection feasible, dramatically reducing the time required to generate a new bait construct. For a laboratory screening multiple bait proteins, TurboID enables a pipeline that delivers results in 3–5 days from transfection to MS sample, compared to 2–3 weeks for BioID (requiring stable line generation and selection). Streptavidin bead selection is a second parameter that significantly affects data quality. Magnetic streptavidin beads consistently recover 2-fold more biotinylated proteins than agarose streptavidin beads in TurboID experiments, as shown by a 2026 optimization study in brain microvascular endothelial cells. The advantage is attributed to the higher surface-area-to-volume ratio of magnetic beads and the reduced mechanical shearing during washing. For BioID, where total biotinylated protein mass is lower, bead type makes less difference, and agarose beads are cost-effective. Lysis and wash conditions differ in stringency. BioID samples tolerate moderate washing (RIPA buffer with 0.1% SDS), while TurboID samples require more stringent conditions (RIPA with 2% SDS or RIPA with 6 M urea) to reduce the higher nonspecific background resulting from the elevated biotin concentration. The post-lysis heating step (95°C for 10 minutes in SDS loading buffer) is necessary for both enzymes to fully release biotinylated proteins from streptavidin beads, but it is especially critical for TurboID samples where the biotin-streptavidin interaction is more saturated.
Workflow timeline comparison: BioID from transfection to MS data takes approximately 3 weeks (stable line generation, 24h labeling, 1 day enrichment). TurboID from transfection to MS data takes approximately 4–5 days (transient transfection, 1h labeling, 1 day enrichment).
Figure 3: BioID vs TurboID Experimental Protocol Parameter Comparison
 Horizontal parameter layout comparing bait expression, biotin concentration, labeling time, bead type, wash stringency, and total workflow duration for both methods.
Split-TurboID: When and Why to Graduate from Full-Length Enzymes
Full-length BioID and TurboID label all proteins within the 10 nm radius of the bait, regardless of whether they directly interact with the bait or are merely present in the same subcellular neighborhood. Split-TurboID solves this specificity problem by dividing the TurboID enzyme into two inactive fragments at a structurally permissive split site (between the N-terminal and C-terminal domains of BirA), each fused to a different protein. Enzyme activity is reconstituted only when the two fusion proteins are brought into proximity, regardless of whether they directly interact with the bait or are merely present in the same subcellular neighborhood. Split-TurboID solves this specificity problem by dividing the TurboID enzyme into two inactive fragments at a structurally permissive split site (between the N-terminal and C-terminal domains of BirA), each fused to a different protein. Enzyme activity is reconstituted only when the two fusion proteins are brought into proximity—either by direct binding or by stable co-complex association. The split-site selection is critical: the original split-TurboID design uses a split between residues 256 and 257 of the BirA sequence, which places the catalytic lysine (K183) on the N-terminal fragment and the ATP-binding motif on the C-terminal fragment, ensuring that neither fragment alone has residual catalytic activity., regardless of whether they directly interact with the bait or are merely present in the same subcellular neighborhood. Split-TurboID solves this specificity problem by dividing the TurboID enzyme into two inactive fragments, each fused to a different protein. Enzyme activity is reconstituted only when the two fusion proteins are brought into proximity—either by direct binding or by stable co-complex association.
The key experimental scenario that demands split-TurboID is when you need to determine whether two proteins are directly interacting versus co-existing in the same macromolecular complex without contacting each other. Full-length TurboID will biotinylate both scenarios equally; split-TurboID will only biotinylate when the two split fragments complement. A 2025 study mapping the nuclear pore complex used split-TurboID to identify which nucleoporin pairs are within complementation distance and which are not, generating interaction interface data that correlated closely with cryo-EM structures. A 2026 application extended split-TurboID to GPCR-β-arrestin interaction mapping, demonstrating that the split enzyme approach distinguishes β-arrestin isoforms that bind directly to the receptor from those that are recruited to the same membrane microdomain without direct receptor contact. The experimental cost of split-TurboID is the requirement for dual construct transfection and the need to verify that each split fragment is expressed at comparable levels and folds correctly. In practice, split-TurboID is recommended as a validation tool after initial candidate identification by full-length TurboID, rather than as a primary screening method. The split-TurboID approach is particularly valuable for validation of hits from high-throughput full-length PL screens, where the false-positive rate from proximity-based bystander labeling can exceed 50 percent for highly abundant background proteins in the same cellular compartment. By applying split-TurboID to the top 10-20 candidates from a full-length TurboID screen, researchers can rapidly triage which candidates are within complementation distance of the bait and which are likely bystanders.
Figure 4: Full-Length TurboID versus Split-TurboID Working Mechanism
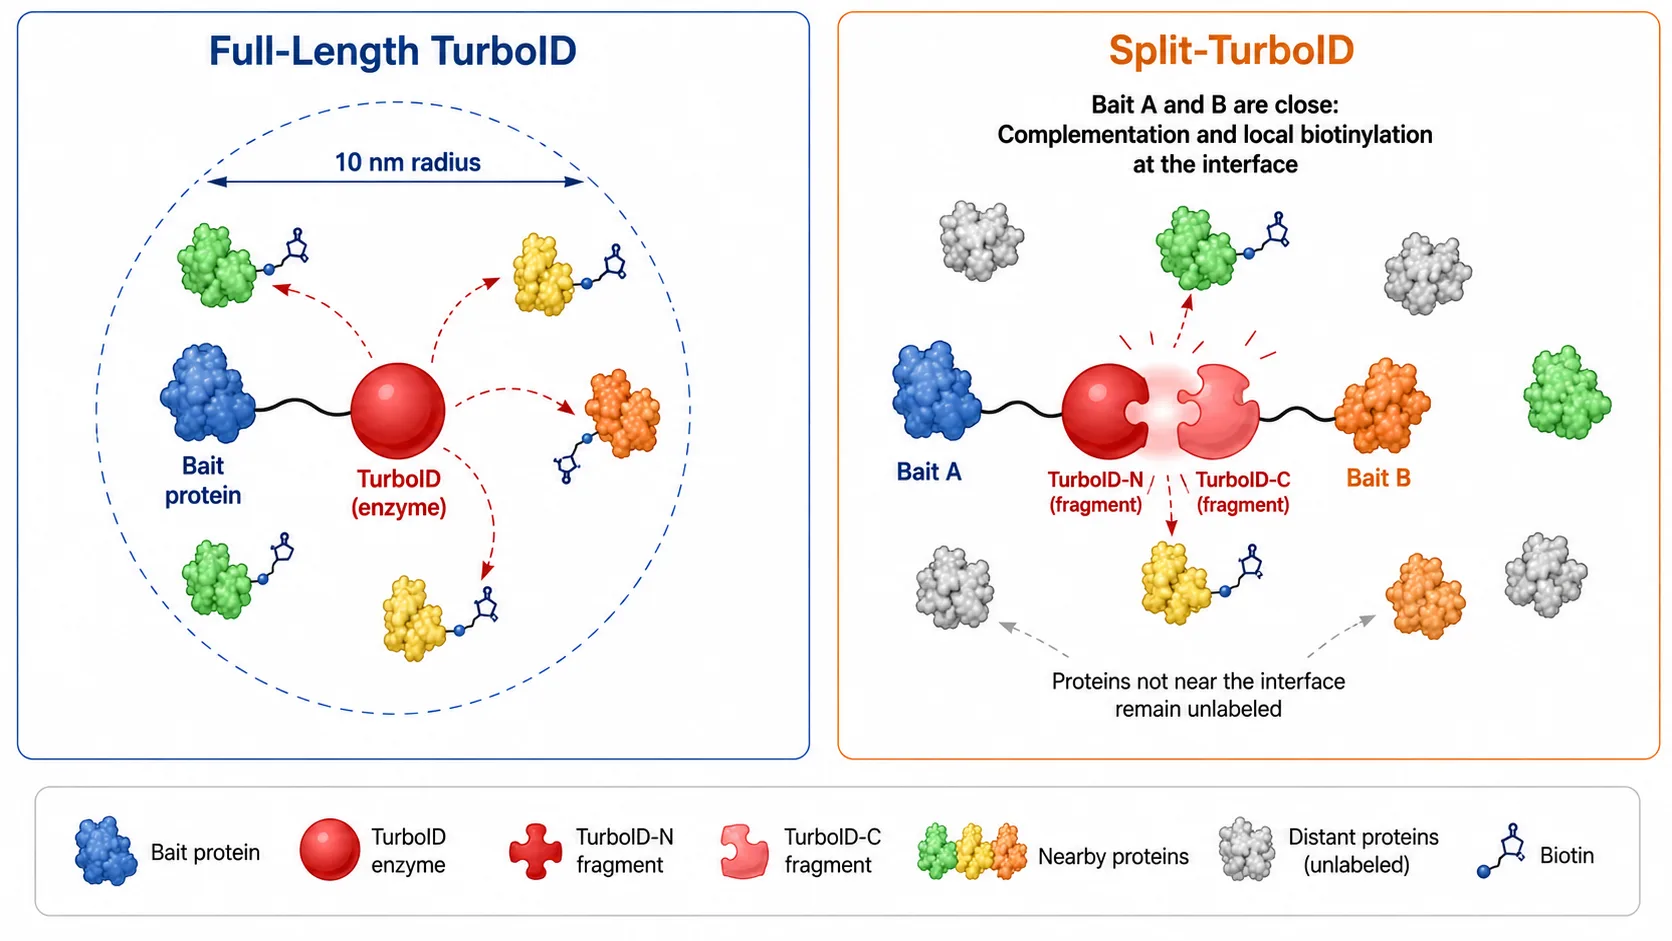 Side-by-side schematic showing full-length enzyme labeling all proteins within 10 nm versus split-enzyme labeling only upon fragment complementation.
Data Analysis: Separating Signal from Noise in Proximity Labeling Datasets
Proximity labeling data differs fundamentally from conventional IP-MS data, and applying IP-MS analysis workflows to PL datasets produces unreliable results.
Background Composition and CRAPome Limitations
The most important distinction is that PL background is dominated by endogenously biotinylated proteins and by proteins that are highly abundant in the same cellular compartment as the bait, rather than by proteins that nonspecifically bind to the antibody or beads. The CRAPome database, which is the standard reference for IP-MS contaminant filtering, has limited utility for PL data because it primarily aggregates control IP-MS experiments rather than PL controls. A dedicated PL background database has been proposed but does not yet exist as a community resource. Until such a resource becomes available, each laboratory should build its own background library by pooling control PL experiments (free BirA* and untagged bait controls) across multiple projects. This in-house background library, even with as few as 10 control experiments, significantly improves the specificity of candidate filtering compared to using a single control run, because it captures the batch-to-batch variability in endogenous biotinylation levels that single controls miss. but does not yet exist as a community resource. The recommended quantitative strategy for PL data is SILAC-based quantification, where bait-expressing cells are labeled with heavy isotope amino acids and control cells (free BirA* or untransfected) are labeled with light isotopes, or vice versa. The SILAC ratio (heavy/light) for each identified protein provides a quantitative enrichment score that distinguishes genuine proximity candidates from background. Label-free quantification is feasible for PL data when biological triplicates are included, but the lower quantitative precision (CV 20–30% vs SILAC CV<10%) reduces the confidence of enrichment calls, particularly for low-abundance proximity candidates. A 2025 EMBO Journal study introduced an endogenous TurboID workflow combined with data-independent acquisition (DIA) mass spectrometry, demonstrating that DIAs deeper coverage offsets the background problem by capturing enough peptides from each protein to enable robust statistical filtering. For cross-validation of proximity labeling candidates, orthogonal methods such as co-immunoprecipitation (co-IP/MS) provide complementary interaction evidence. For researchers designing PL quantification experiments, SILAC-based proteomics services provide the required isotopic labeling and MS acquisition infrastructure. A second consideration is that PL data analysis benefits from dedicated normalization strategies that are less commonly applied in IP-MS. Since total biotinylation signal varies substantially between experiments due to differences in bait expression level, labeling efficiency, and biotin uptake, normalization to the total biotin signal intensity (total MS1 intensity of biotinylated peptide features) is recommended before comparing candidate enrichment across samples. This normalization corrects for the inter-experiment variability that otherwise dominates the quantitative comparison. For researchers needing guidance on PL-specific data analysis workflows, specialized bioinformatics support is available for designing the appropriate control and normalization strategy.
Organism Compatibility: Beyond Mammalian Cells
TurboID in Non-Mammalian Systems
BioIDs activity has been validated primarily in mammalian cell lines (HEK293, HeLa, U2OS) and, to a lesser extent, in Drosophila and yeast. Its requirement for 24-hour labeling at 37°C limits its applicability in non-mammalian systems that grow at lower temperatures or have different metabolic requirements. TurboID has demonstrated broader compatibility across diverse organisms. In plants, TurboID has been validated in Arabidopsis thaliana seedlings and tomato hairy roots (Solanum lycopersicum), with labeling performed at 22°C for 1–3 hours producing sufficient biotinylation for MS detection. In filamentous fungi (Sordaria macrospora), TurboID labeling for 2 hours at 27°C identified 147 high-confidence proximity partners for the SCI1 protein, many of which were validated by independent co-IP. In Saccharomyces cerevisiae, TurboID shows reduced activity at 30°C compared to 37°C, but extending the labeling period to 2–3 hours compensates for the lower catalytic rate. For virus-host interaction studies, TurboID was applied to identify the SARS-CoV-2 entry co-receptor in ACE2-expressing cells, capturing 47 previously unreported host proteins within 30 minutes of viral spike protein exposure. TurboID proximity labeling services have been tailored to accommodate these diverse experimental systems, with optimized protocols for each organism type. A practical consideration for non-mammalian TurboID experiments is that the optimal biotin concentration often needs re-titration: for plant cell cultures, 250 microM biotin for 2 hours at 22 deg C produces optimal signal-to-background ratios, while for fungal systems, 500 microM for 1 hour at 27 deg C is the recommended starting point. These optimizations are best determined empirically using a pilot Western blot of the biotinylated lysate before committing to full-scale MS analysis. A practical consideration for non-mammalian TurboID experiments is that the optimal biotin concentration often needs re-titration: for plant cell cultures, 250 microM biotin for 2 hours at 22 deg C produces optimal signal-to-background ratios, while for fungal systems, 500 microM for 1 hour at 27 deg C is the recommended starting point. These optimizations are best determined empirically using a pilot Western blot of the biotinylated lysate before committing to full-scale MS analysis.
Step-by-Step Decision Flow: Which One Should You Start With?
The following three-step decision logic guides enzyme selection based on experimental constraints rather than personal preference.
- Step 1: Assess bait protein expression level. Estimate expression level by Western blot. If the bait requires transient expression or expresses at low levels, TurboID is preferred for its faster kinetics.
- Step 2: Define the required temporal resolution. If the research question involves dynamic interactions (signaling, cell cycle), TurboIDs 10–60 minute window is necessary.
- Step 3: Estimate the number of baits to be screened. If searching more than 5 baits, the workflow speed of TurboID (4-5 days vs 2-3 weeks) is decisive.
- Step 4: Determine whether interface information is needed. If the study aims to distinguish direct binding from co-complex association, plan split-TurboID as a validation step.
Figure 5: Proximity Labeling Enzyme Selection Decision Tree
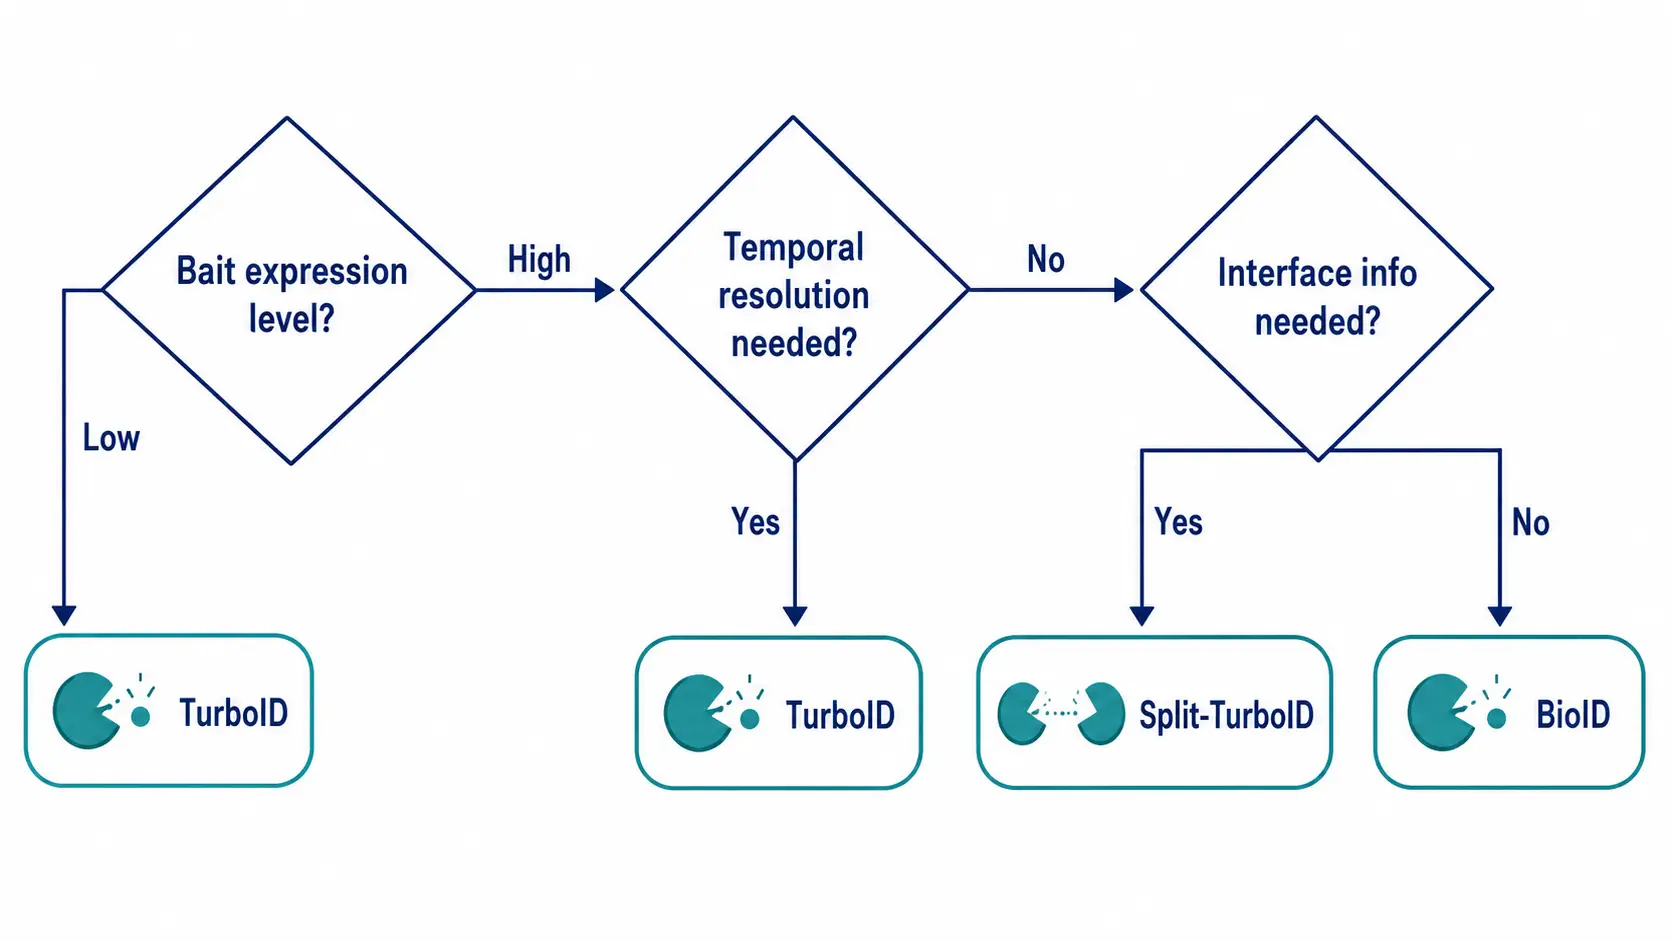 Three-step decision flow from bait expression level through temporal resolution requirement to interface information need, directing users to BioID, TurboID, or split-TurboID.
FAQ
My target protein expresses at very low levels. Can TurboID still work?
Yes. TurboID achieves detectable biotinylation within 30–60 minutes even at expression levels below 1,000 copies per cell. For extremely low-abundance baits, extending the labeling period to 2–3 hours improves signal without significantly increasing background.
How do I distinguish genuine proximity labeling from endogenous biotin background?
Include a free BirA* (no bait fusion) control in every experiment. Proteins identified in the free BirA* control represent endogenous biotinylation or nonspecific labeling and should be subtracted from the bait-specific dataset. Pre-clearing with streptavidin agarose can reduce the most abundant background species.
Can I use BioID data to compare with TurboID data from the same target?
With caution. BioID and TurboID datasets from the same bait typically overlap by 50–70%. Proteins detected by both methods are high-confidence interactors. Proteins detected only by BioID tend to be lower-abundance or more transient; proteins detected only by TurboID tend to be those with faster interaction kinetics.
What is the minimum biotin incubation time for TurboID in non-mammalian systems?
In plants and fungi at 22–27°C, 1–3 hours is recommended. In yeast at 30°C, 2–3 hours is needed to compensate for reduced enzyme activity at lower temperatures. Shorter incubation times can be tested but may produce insufficient biotinylation for MS detection.
Does split-TurboID really report direct binding or just co-complex association?
Split-TurboID reports proximity sufficient for enzyme complementation, which requires the two split fragments to be within approximately 3–5 nm of each other. This distance is shorter than the full-length enzyme labeling radius (~10 nm), making split-TurboID more specific for direct interactions.
What mass spectrometry quantification method is best for proximity labeling data?
SILAC-based quantification is recommended as the first choice for PL data because it provides the precision needed to distinguish true labeling from background. Label-free quantification with triplicate measurements is a viable alternative when SILAC labeling is not feasible. DIA-based quantification is an emerging option that offers deep coverage and good quantitative precision.
References
- May DG, Scott KL, Campos AR, Roux KJ. Comparative Application of BioID and TurboID for Protein-Proximity Biotinylation. Cells. 2020;9(5):1070. doi:10.3390/cells9051070
- Shin S, Lee SY, Kang MG, et al. Super-resolution proximity labeling with enhanced direct identification of biotinylation sites. Commun Biol. 2024;7:554. doi:10.1038/s42003-024-06112-w
- Liu F, Wu Z, Lv Z, et al. Cell fixation improves performance of in situ crosslinking mass spectrometry. Nat Commun. 2024;15:8595. doi:10.1038/s41467-024-52844-y
- Sarnowski C, Soderblom E, Madden D, et al. TurboID-mediated proximity labeling for virus-host interaction identification. Front Cell Infect Microbiol. 2024;14:1371837. doi:10.3389/fcimb.2024.1371837
- Khaligh SS, Khalid-Salako F, Kurt H, Yuce M. Exploring the Interaction of Biotinylated FcGamma RI and IgG1 Monoclonal Antibodies on Streptavidin-Coated Plasmonic Sensor Chips. Biosensors. 2024;14(12):634. doi:10.3390/bios14120634