Plant Widely-Targeted Metabolomics Service
Plant metabolism is extraordinarily complex—spanning primary pathways and diverse specialized compounds. At Creative Proteomics, our Plant Widely-Targeted Metabolomics Service delivers high-throughput, high-specificity profiling of 1000+ plant metabolites across 17+ compound classes. Whether you're exploring plant defense, metabolic engineering, or stress adaptation, we provide the resolution, depth, and biological context your research demands.
Why Choose Us
- Quantify 1000+ metabolites across 17+ chemical categories
- Ultra-sensitive detection with UPLC-ESI-QTRAP 6500+ platform
- 10,000+ validated MRM transitions for confident identification
- Supports cross-species plant studies: crops, herbs, and wild species
- Seamless integration with KEGG, PlantCyc, and transcriptomics data
Submit Your Request Now
×
- What We Provide
- Advantages
- Technology Platform
- Sample Requirement
- Demo
- Case
- FAQs
What Is Widely Targeted Metabolomics
Plant metabolomics is pivotal for understanding the biochemical complexity underlying plant development, environmental response, and metabolic engineering. Among existing strategies, widely-targeted metabolomics stands out by uniting the expansive coverage of untargeted methods with the quantitative rigor of targeted approaches. This hybrid technology enables researchers to profile hundreds to thousands of metabolites—spanning both primary and secondary pathways—with high specificity, reproducibility, and throughput.
Unlike traditional metabolomics, which may sacrifice quantification for coverage or vice versa, widely-targeted workflows balance both demands. This makes it especially valuable in plant science, where intricate networks of phytohormones, flavonoids, alkaloids, terpenoids, and stress-related metabolites require broad-spectrum yet precise analysis. Creative Proteomics' platform empowers clients to extract actionable insights from complex plant systems across genotypes, phenotypes, and environmental conditions.
What Research Challenges Does This Service Solve?
- Comparative Metabolic Profiling: Resolve metabolomic differences across cultivars, mutants, or treatments to discover metabolic markers or validate breeding strategies.
- Environmental Stress Response: Characterize metabolic adaptations under abiotic or biotic stress, including drought, salinity, pathogen attack, or nutrient limitation.
- Pathway Reconstruction: Map the dynamics of primary and specialized metabolic pathways to support functional genomics, gene editing, or transgenic studies.
- Biomarker Identification: Detect metabolic fingerprints associated with phenotypic traits, yield, or bioactive compound production.
- Systems Biology Integration: Align metabolomic data with transcriptomics, proteomics, or phenomics for comprehensive, multi-dimensional insights.
Whether the goal is to engineer stress-resilient crops or trace the biosynthesis of high-value plant metabolites, this service offers an advanced analytical backbone tailored to your research questions.
Metabolite Coverage Across Plant Primary and Specialized Pathways
Creative Proteomics has built an industry-leading plant metabolite database, enabling ultra-broad detection across both conserved core pathways and species-specific secondary metabolism. Our widely-targeted approach allows simultaneous profiling of 17+ compound classes and 10,000+ validated MRM transitions, supporting dynamic, comparative, and pathway-resolved plant metabolomics.
Compound Classes and Representative Metabolites
| Category | Number of Metabolites | Representative Compounds |
|---|---|---|
| Amino Acids & Derivatives | 300+ | L-Arginine, L-Valine, L-Glutamine, L-Threonine, D-Glutamic acid, L-Alanine |
| Phenols | 120+ | Methyl caffeate, Eugenol, Lactucin, Geraniol, Lithospermic acid |
| Phenolic Acids | 1200+ | Ferulic acid, Danshensu, Gingerol, Arbutin, Chlorogenic acid, Glycyrrhetinic acid |
| Nucleotides | 200+ | Adenosine, Cytidine, 5'-Triphosphate cytidine, 2-Thiocytidine, cAMP |
| Flavonoids | 2000+ | Quercetin, Kaempferol, Luteolin, Astragaloside IV, Cyanidin-3-O-glucoside, Silybin |
| Quinones | 170+ | Aloe-emodin, Emodin, Juglone, Anthraquinone, Danthron, Mitoxantrone |
| Terpenes | 270+ | Phyllanthin, Camphor, Schisandrin E, Magnolol, Honokiol, Gypenoside |
| Alkaloids | 1300+ | Taxane, Corydaline, Dendrobine, Theobromine, Matrine, Berbamine |
| Sugars & Polyols | 120+ | L-Arabinose, Trehalose, β-Cyclodextrin, Sorbitol, Sucrose |
| Terpenoids | 1200+ | Ginsenoside Rh2, Forsythiaside IIA, Huperzine A, Dihydroartemisinin |
| Ketones, Aldehydes, Acids | 330+ | Vanillin, Succinic acid, Triptolide, Pyridoxal, Matricin |
| Vitamins | 10+ | Vitamin E, Vitamin B12, Vitamin K4, Pyridoxol, Retinal |
| Coumarins | 270+ | Piperine, Fraxetin, Ligustilide, 5,7-Dihydroxy-4-methylcoumarin |
| Oxygenated Anthraquinones | 20+ | Diosgenin, Morin, Iridin, Isohemsleyanin, Quercetin-3-glucoside |
| Organic Acids | 370+ | Aconitic acid, Veratric acid, Ginkgolic acid, Lacquer tree acid |
| Steroids | 200+ | Glycyrrhizin, Paeoniflorin, Cortisone, Suillin, Abietic acid |
| Lipids | 450+ | Oleic acid, Ricinoleic acid, Capric acid, Lauric acid, 10-Undecenoic acid |
| Others | 1300+ | Jasmine ketone, Rubidium G, Isoborneol, Lucidin, Methyl vanillate, Xanthocurcumine |
Custom compound groups or rare compound enrichment panels (e.g., lignans, benzylisoquinoline alkaloids, strigolactones) are available upon request.
How This Benefits Your Research
- Deep metabolome coverage: Supports studies on plant growth, defense, signaling, adaptation, and metabolic engineering.
- Species versatility: Optimized for diverse crops, herbs, model species, and non-model wild plants.
- High confidence identification: Leveraging tandem MS spectra, retention index libraries, and proprietary annotation algorithms.
- Ready for downstream use: All detected compounds are cross-referenced with KEGG, PlantCyc, and HMDB for seamless bioinformatics integration.
Why Choose Creative Proteomics for Plant Widely-Targeted Metabolomics Analysis?
- Comprehensive substance identification: High throughput, simultaneous qualitative and quantitative detection of 1000+ metabolites.
- Comprehensive annotation information: Over 90% KEGG coverage, over 90% coverage of primary and secondary metabolite classification, over 90% annotation of compound names. Accurate and reliable pathway analysis and functional analysis. Reliable correlation analysis through multi-omics integration.
- Wide coverage of substance categories: Construction of libraries through repeated testing using multiple species and sample types. Multiple preprocessing methods employed for different compound characteristics. High coverage of plant metabolites.
- Large number of measured metabolites in projects: For example, a project measured over 700-1300 plant metabolites, with 870+ substances detected (including 250+ flavonoids, 120+ alkaloids, 90+ polyphenols, 110+ terpenes, 300+ coumarins and other categories, 50+ miscellaneous).
- High sensitivity: AB Q Trap 6500+ MRM enables detection of low-abundance secondary metabolites that cannot be detected by un-targeted techniques using data scanning modes.
- Accurate qualitative analysis: Compared to un-targeted techniques, comprehensive targeted metabolomics utilizes Q1, Q3, CE, and DP for qualitative analysis.
- Comprehensive database: Establishment of a plant-specific self-built database with over 10,000 substances, covering primary and secondary metabolites.
- Good reproducibility: Generally, 3 biological replicates are sufficient, whereas un-targeted approaches require 6-30 biological replicates.
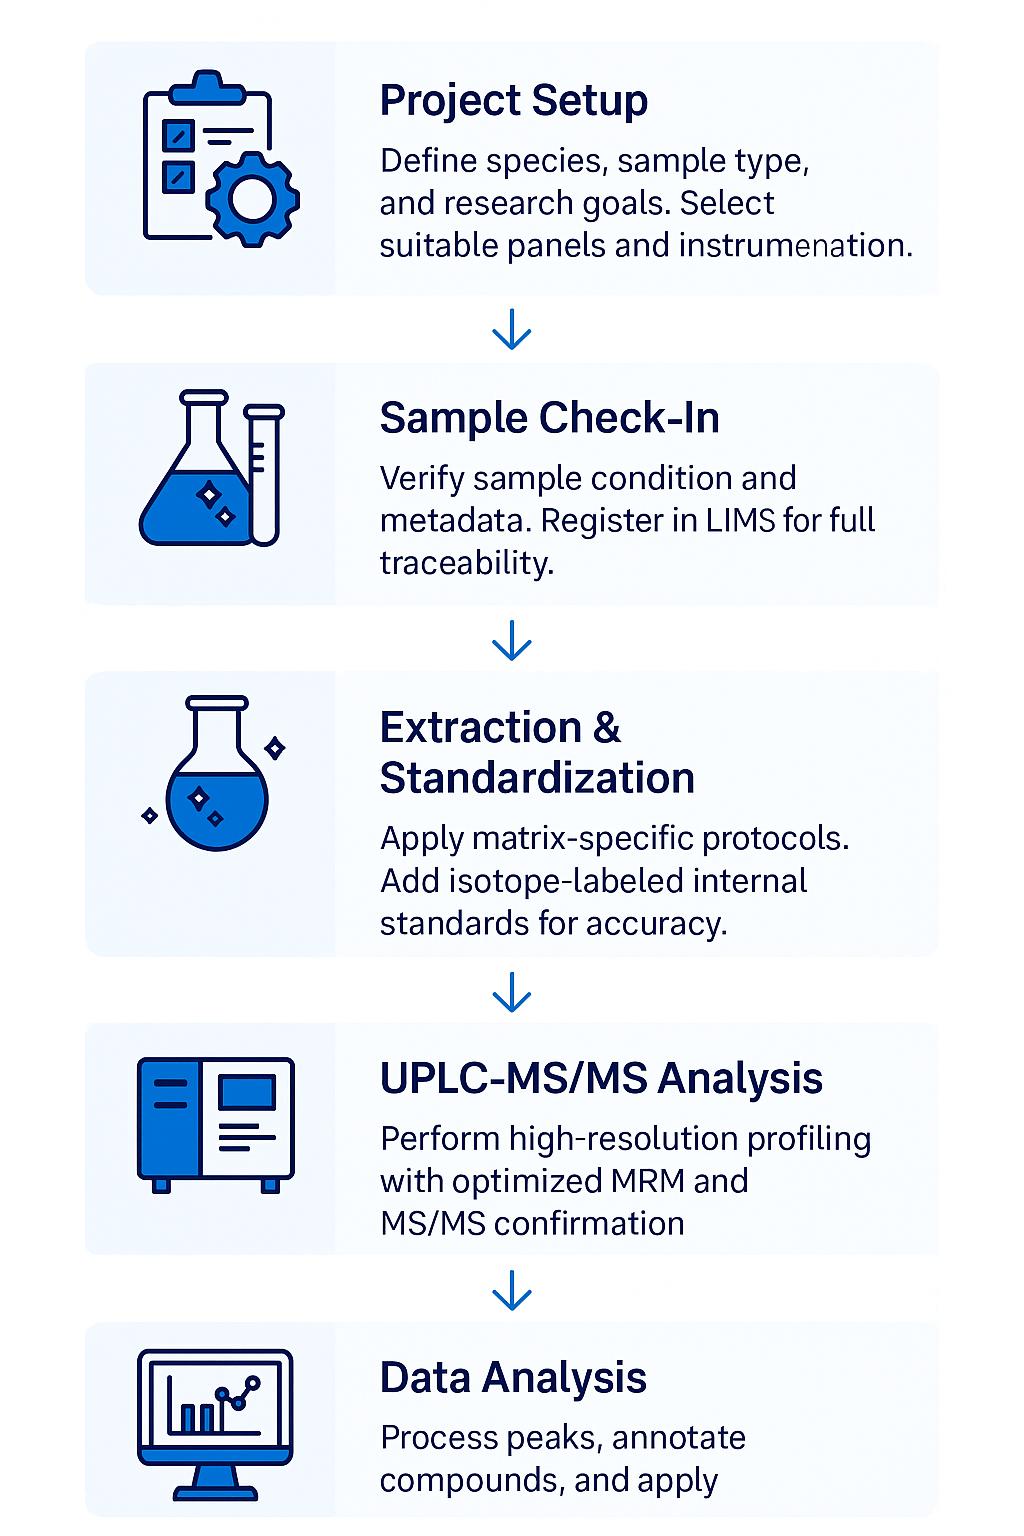
Plant Widely-Targeted Metabolomics Workflow: Step-by-Step Process
1. Project Consultation & Design
We begin by understanding your research objectives, plant species, sample types, and target metabolite classes. Based on this, we recommend appropriate detection panels, instrumentation, and analytical parameters.
2. Sample Receipt & Quality Check
Upon arrival, all samples undergo rigorous verification, including matrix classification, volume/mass assessment, and integrity inspection. Each sample is logged into our LIMS system for full traceability.
3. Metabolite Extraction & Internal Standardization
Customized extraction protocols are applied depending on the plant matrix (e.g., leaves, roots, seeds). Stable isotope-labeled internal standards are added to ensure quantification accuracy and batch comparability.
4. UPLC-MS/MS Analysis
Samples are analyzed using our high-resolution UPLC-QTRAP or Orbitrap platforms. Multiple Reaction Monitoring (MRM) is used for targeted quantification, while MS/MS fragmentation confirms metabolite identity.
5. Data Processing & Statistical Analysis
Raw data are processed through our validated pipeline, including peak alignment, compound annotation, and quantification. We apply multivariate statistics (PCA, PLS-DA), differential metabolite screening, and pathway enrichment analysis.
What Methods Are Used for Plant Widely-Targeted Metabolomics Analysis
UPLC-ESI-QTRAP 6500+ (Sciex)
- Chromatography: Waters ACQUITY UPLC System
- Ion Source: Electrospray Ionization (ESI), positive and negative switching
- Detection Mode: MRM / sMRM, fast polarity switching
- Dynamic Range: ≥10⁴
- Sensitivity: LOD ≤ 1 ng/mL for key metabolites
- Sample Throughput: ~200 compounds per run in both ion modes
- Temperature Control: Column oven at 40 °C; autosampler at 4 °C
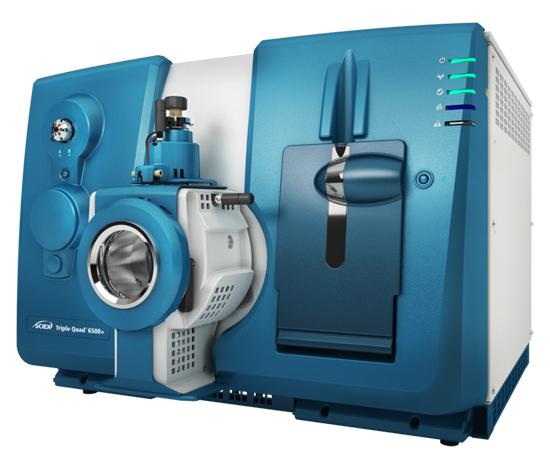 SCIEX Triple Quad™ 6500+ (Figure from Sciex)
UHPLC-Q Exactive Orbitrap (Thermo Scientific) (for extended ID confirmation)
- Resolving Power: ≥70,000 FWHM at m/z 200
- Mass Accuracy:<5 ppm
- Scan Types: Full MS + dd-MS²
- Application: Structural confirmation, isomer resolution, metabolite ID extension
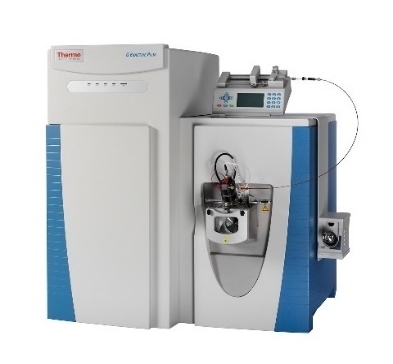 Thermo Fisher Q Exactive (Figure from Thermo Fisher)
Data Acquisition Parameters
| Parameter | Specification |
|---|---|
| MS Scan Mode | MRM (QTRAP) / Full MS + ddMS² (Orbitrap) |
| Ionization Mode | ESI+, ESI− (polarity switching in single run) |
| Injection Volume | 2–5 µL (depending on matrix and metabolite class) |
| Runtime per Sample | ~12–18 minutes |
| Analyte Coverage | ≥1000 plant metabolites (targeted + confirmed ID) |
| Retention Time Window | ±0.2 min (scheduled MRM) |
All raw data and acquisition parameters are available upon request for transparency, reproducibility, and method transferability.
Sample Requirements for Plant Widely-Targeted Metabolomics Service
| Sample Type | Amount | Sample Preparation | Storage Conditions | Notes |
|---|---|---|---|---|
| Leaves | 50-100 mg | Freeze-dried or fresh | -80°C (long-term) | Collect young, healthy leaves from multiple plants for representative analysis. |
| Roots | 100-200 mg | Freeze-dried or fresh | -80°C (long-term) | Ensure roots are free from soil contamination. |
| Seeds | 50-100 mg | Freeze-dried or fresh | -80°C (long-term) | Avoid exposure to light to prevent degradation of sensitive compounds. |
| Fruits | 100-200 mg | Fresh or freeze-dried | -80°C (long-term) | Use fully mature fruits for consistent results. |
| Flowers | 50-100 mg | Freeze-dried or fresh | -80°C (long-term) | Collect flowers before full blooming for stable metabolite profiles. |
Demo Results
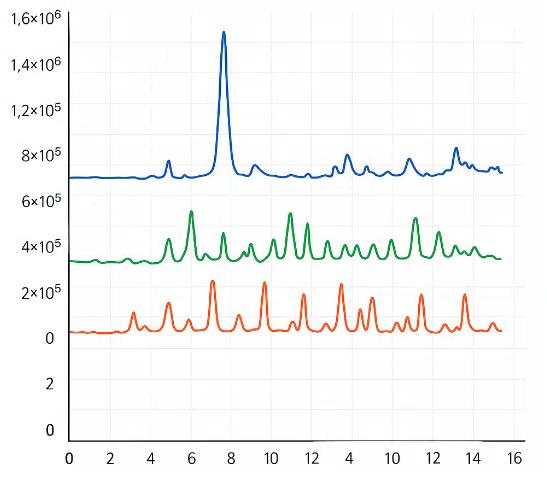
Representative LC-MS chromatograms showing sharp and well-resolved metabolite peaks.
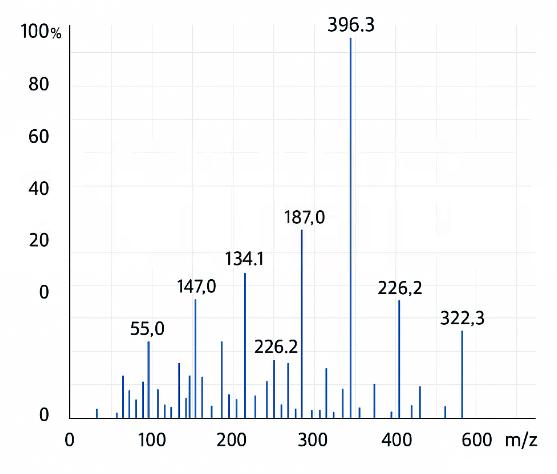
Full-scan mass spectrum of a plant metabolite with annotated fragment ions for structural confirmation.
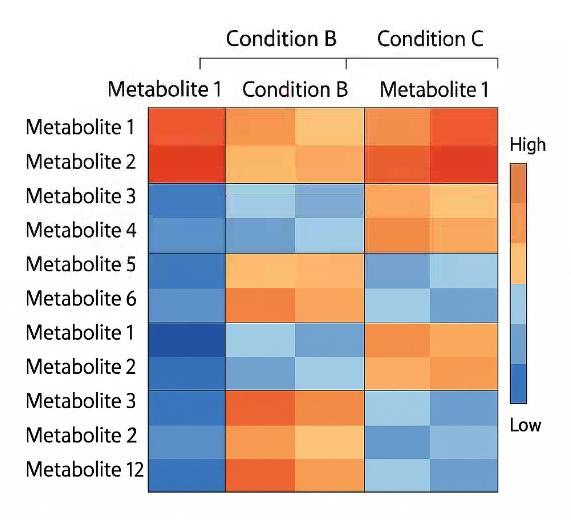
Heatmap of relative metabolite abundance across different conditions, highlighting metabolic variation.
Case Study
Integrated Metabolomics and Transcriptomics Analyses Revealthe Metabolic Differences and Molecular Basis of NutritionalQuality in Landraces and Cultivated Rice
Journal: Metabolites
Published: 2022
Technical platforms: widely targeted metabolomics, transcriptomics, recombinant protein expression, and in vitro enzyme activity analysis.
- Study Overview
- Technical Highlights
- Key Findings
- Reference
In a comprehensive study published in Metabolites (2022), Zhang et al. investigated the metabolic and molecular basis of nutritional quality differences between landrace and cultivated rice (Oryza sativa L.). Using a widely-targeted metabolomics strategy, the researchers profiled 985 nutritional metabolites across 114 rice varieties, including 35 landraces and 79 modern cultivars. The metabolite classes included amino acids, flavonoids, anthocyanins, lipids, and vitamins.
- Broad-targeted LC-MS/MS was used to establish a rice seed metabolome database covering over 900 compounds.
- Principal Component Analysis (PCA) and metabolome-based clustering revealed clear differentiation between landraces and cultivars.
- A total of 358 differentially accumulated metabolites (DAMs) were identified during seed germination, with significant differences in anthocyanins, flavonoids, and amino acids.
- Integration with transcriptomics led to the identification of 1982 differentially expressed genes (DEGs), many of which were associated with phenylpropanoid and amino acid metabolism.
- Landrace rice showed higher levels of key nutritional metabolites such as peonidin 3,5-O-diglucoside, naringenin 7-O-glucoside, and cyanidin derivatives, correlating with red or black seed coloration.
- A metabolite–gene correlation network identified 20 candidate glycosyltransferase genes, five of which were experimentally validated to catalyze anthocyanin glycosylation.
- Multistage germination analysis revealed dynamic regulation of metabolite accumulation patterns and structural gene expression, supporting the genetic basis for metabolic diversity in landraces.
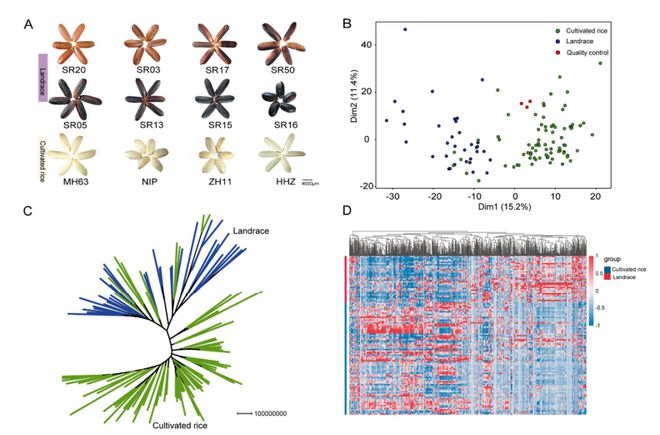 Comparative metabolic differences in cultivar rice and landrace seeds.
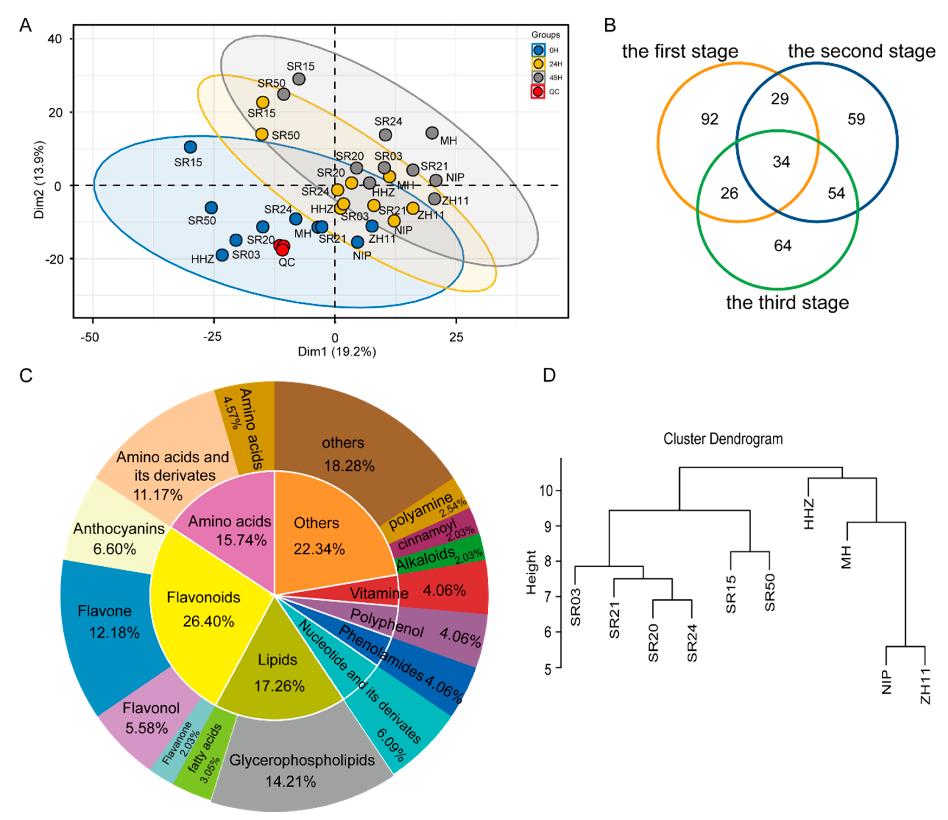 Comparative metabolic analysis in cultivar rice and landrace seeds during germination.
Reference
- Zhang, Zhonghui, et al. "Integrated metabolomics and transcriptomics analyses reveal the metabolic differences and molecular basis of nutritional quality in landraces and cultivated rice." Metabolites 12.5 (2022): 384.
FAQ of Plant Widely-Targeted Metabolomics Analysis Service
How do you control for batch effects across large studies?
We design randomized run orders, inject pooled QC samples at fixed intervals, and apply drift correction using QC-anchored normalization (e.g., LOESS/RLSC). Where appropriate, empirical Bayes adjustments (such as ComBat) are used to further minimize batch-related variance.
What normalization strategies are used before statistical testing?
We combine internal-standard scaling, drift correction, and sample-wise normalization (e.g., total useful signal or probabilistic quotient). Log or variance-stabilizing transformations are applied only after missing-value handling, with all parameters documented.
How are missing values handled?
We classify missingness (true biological zero vs. censored low-abundance vs. technical dropout) using QC and dilution trends. Imputation is tailored—left-censored methods for near-LOD features, and covariance-based approaches for correlated metabolites.
How do you verify metabolite identity when isomers co-elute or share fragments?
We use scheduled transitions, ion-ratio checks, retention-time matching to authenticated standards, and MS/MS pattern comparison. For difficult isomers, orthogonal separation or high-resolution MS confirmation is applied.
Do you support absolute quantification?
Yes. Upon request, we create calibration curves with authentic standards and suitable internal standards, reporting concentrations with curve diagnostics and QC recoveries. Other panel compounds are reported semi-quantitatively.
How are limits of detection and quantification established?
LOD/LOQ are determined from low-level spikes, blank variability, or calibration residuals, then confirmed with independent QC materials. Each result is flagged according to whether it is above LOQ, between LOD–LOQ, or below LOD.
What quality metrics are included in reports?
We provide per-feature and per-sample %CV in pooled QCs, signal-to-noise ratios, ion-ratio match scores, retention-time stability, carryover checks, and missingness rates. Study-level QC plots are also included.
How do you assess and mitigate matrix effects?
We evaluate post-extraction spikes and dilution-linearity for each metabolite class. When ion suppression or enhancement is detected, extraction protocols, ionization settings, or chromatographic conditions are adjusted.
Can you accommodate time-course or dose-response studies?
Yes. We support dynamic experimental designs and provide trajectory analysis, clustering, and pathway-level dynamics to identify early vs. late metabolic responses.
How do you control false discoveries in large panels?
Multiple-testing correction (FDR) is applied according to the statistical framework—feature-wise comparisons, pathway-level enrichment, or supervised models—ensuring robust interpretation.
Which pathway and network analyses are supported?
We offer KEGG/PlantCyc/HMDB mapping, topology-aware pathway analysis, correlation networks, and module detection to identify co-regulated metabolite groups. Cross-omics integration is available.
How are custom or rare metabolite classes added?
We perform reference standard selection, transition scouting, retention-time locking, and spike-recovery validation in your matrix. Each addition is documented for reproducibility.
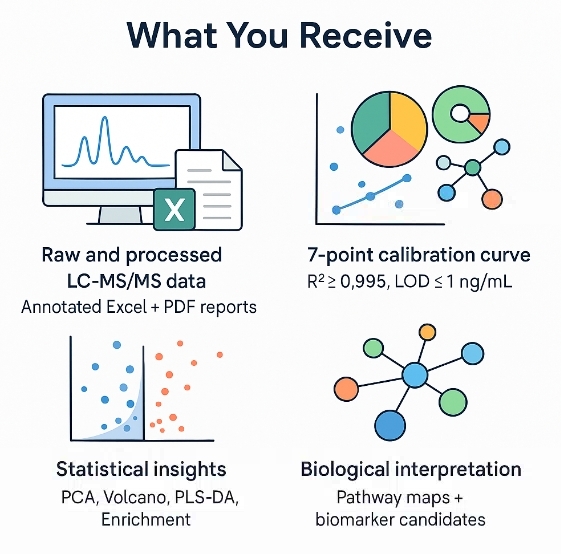
What does a typical deliverable set include?
- Raw and processed data (peak areas, normalized intensities, concentrations)
- Annotation tables with evidence levels and database links
- QC summary reports and diagnostic plots
- Method and parameter manifest for reproducibility
- Figures (PCA/PLS-DA, heatmaps, pathway diagrams)
How do you ensure reproducibility for follow-up studies?
Acquisition methods, transition lists, and reference retention-time anchors are archived. Bridging QC samples are used in new runs to maintain comparability.
Can results inform breeding or metabolic engineering decisions?
Yes. We identify trait-linked metabolites, quantify their stability across environments, and map them to relevant biosynthetic pathways to guide breeding or pathway engineering.
Learn about other Q&A about proteomics technology.
Publications
Here are some of the metabolomics-related papers published by our clients:

- Methyl donor supplementation reduces phospho‐Tau, Fyn and demethylated protein phosphatase 2A levels and mitigates learning and motor deficits in a mouse model of tauopathy. 2023.
- A human iPSC-derived hepatocyte screen identifies compounds that inhibit production of Apolipoprotein B. 2023.
- The activity of the aryl hydrocarbon receptor in T cells tunes the gut microenvironment to sustain autoimmunity and neuroinflammation. 2023.
- Lipid droplet-associated lncRNA LIPTER preserves cardiac lipid metabolism. 2023.
- Inflammation primes the kidney for recovery by activating AZIN1 A-to-I editing. 2023.
- Anti-inflammatory activity of black soldier fly oil associated with modulation of TLR signaling: A metabolomic approach. 2023.
- Plant Growth Promotion, Phytohormone Production and Genomics of the Rhizosphere-Associated Microalga, Micractinium rhizosphaerae sp. 2023.