Fructose Analysis Service
Creative Proteomics provides specialized fructose analysis services using advanced LC-MS/MS, GC-MS, and Orbitrap platforms to accurately quantify fructose and its metabolites in clinical, nutritional, food, and agricultural samples. Our service supports metabolic research, product development, and quality control by delivering fast, high-sensitivity results across multiple sample types.
Submit Your Request Now
×
- What We Provide
- Advantage
- Workflow
- Technology Platform
- Sample Requirements
- FAQ
- Case
- Publications
Overview of Fructose
Fructose is a naturally occurring monosaccharide with significant roles in human physiology, plant metabolism, and food science. Found in fruits, honey, and high-fructose corn syrup (HFCS), this hexose sugar contributes not only to energy metabolism but also to the pathophysiology of numerous metabolic disorders. Fructose enters glycolysis independently of insulin regulation, distinguishing its biological handling from that of glucose. Due to its unique metabolic routes via fructokinase and aldolase B in the liver, elevated fructose intake has been linked to conditions such as non-alcoholic fatty liver disease (NAFLD), insulin resistance, and hyperuricemia.
Understanding the dynamics of fructose and its associated metabolites is crucial in research spanning nutrition, metabolic disease, food formulation, and biotechnology. At Creative Proteomics, we provide high-precision fructose analysis using gold-standard instrumentation and scientifically validated protocols.
Why Analyze Fructose?
Fructose quantification is critical across various industries and research contexts, including:
- Clinical and Biomedical Research: Elucidating the metabolic impact of fructose on hepatic lipid metabolism, insulin signaling, and uric acid biosynthesis.
- Nutritional Science: Profiling fructose in dietary interventions and functional food development.
- Food & Beverage Industry: Monitoring fructose concentration in syrups, beverages, and natural products for labeling, regulatory compliance, and quality control.
- Agricultural and Botanical Studies: Investigating sugar partitioning in crops and fruits under various environmental conditions.
- Biotechnology: Engineering microbial strains for fructose-based fermentation and bio-conversion processes.
Fructose Analysis Service Offered by Creative Proteomics
- Free Fructose Quantification: Precise measurement of free fructose in blood, tissues, food, and plant samples.
- Fructose-1-Phosphate & Fructose-6-Phosphate Analysis: Targeted profiling of key fructose intermediates involved in glycolysis and hepatic metabolism.
- Fructose/Glucose Ratio Testing: Simultaneous quantification of fructose and glucose for dietary or product composition studies.
- Fructose-Related Metabolite Profiling: Detection of downstream products such as glyceraldehyde, DHAP, uric acid, and sorbitol.
- Fructose Metabolic Pathway Analysis: Focused analysis of fructose's role in glycolysis, fructolysis, the polyol pathway, and purine metabolism.
- Stable Isotope Tracing (13C/14C Fructose): Track labeled fructose through metabolic networks for dynamic flux analysis.
- Customized Analytical Solutions: Tailor-made services for specific matrices, regulatory standards, or unique research objectives.
List of Detectable Fructose-Related Metabolites
| Analyte | Associated Pathway(s) | Application/Significance |
|---|---|---|
| Fructose | Fructose metabolism, Glycolysis | Core monosaccharide in metabolic and nutritional studies |
| Fructose-1-phosphate | Hepatic fructose catabolism | Key intermediate in liver-specific fructolysis |
| Fructose-6-phosphate | Glycolysis, Gluconeogenesis | Entry point into glycolytic/gluconeogenic cycles |
| Glucose | Carbohydrate metabolism | Used for ratio comparisons and sugar profiling |
| Sorbitol | Polyol pathway | Indicates glucose-to-fructose conversion activity |
| Glyceraldehyde | Fructose breakdown | Intermediate linked to lipid synthesis and oxidative stress |
| Dihydroxyacetone phosphate (DHAP) | Glycolysis, Triglyceride synthesis | Downstream of fructose, precursor to glycerol backbone |
| Lactate | Anaerobic glycolysis | Indicator of metabolic shift under high fructose load |
| Uric Acid | Purine degradation | Elevated in fructose-induced hyperuricemia |
| Pyruvate | Central energy metabolism | Measures metabolic flow from fructose toward TCA cycle |
| Acetyl-CoA | Lipogenesis, TCA Cycle | Links fructose metabolism to fatty acid synthesis |
| Xylulose-5-phosphate | Pentose phosphate pathway | Reflects redox and nucleotide synthesis modulation |
| NAD+/NADH | Redox balance | Altered in fructose-induced oxidative stress |
| AMP/ATP | Energy metabolism | Tracks energy imbalance due to rapid fructose phosphorylation |
Advantages of Fructose Assay
- High Sensitivity: Detection limits as low as 5 ng/mL for fructose in plasma and tissue samples.
- Excellent Precision: Coefficient of variation (CV) < 8% across biological replicates ensures data reliability.
- Wide Dynamic Range: Linear quantification range from 5 ng/mL to 10,000 ng/mL, covering physiological and pathological levels.
- Comprehensive Metabolite Coverage: Detection of 30+ fructose-related metabolites, including phosphorylated intermediates and downstream products.
- High Throughput Capability: Analysis capacity of 500+ samples per week, ideal for cohort or time-course studies.
- Multi-Matrix Compatibility: Validated for 15+ biological and food matrices, including serum, urine, plant extracts, fermentation broths, and food products.
Workflow for Fructose Analysis Service
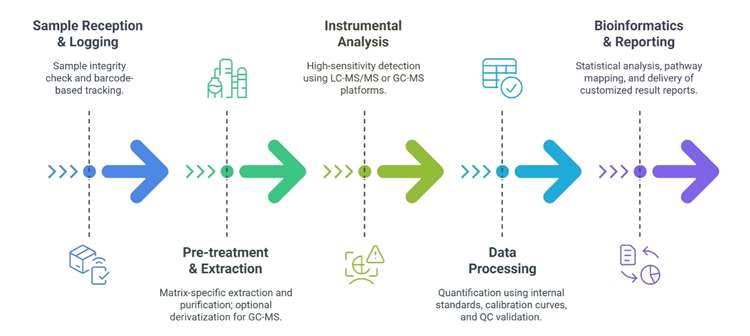
Technology Platforms for Fructose Analysis Service
UPLC–MS/MS: Agilent 1290 Infinity II + Agilent 6470 Triple Quadrupole
– For targeted quantification of fructose and related metabolites with low detection limits.
GC–MS: Agilent 7890B GC + 5977B Mass Selective Detector
– Suitable for volatile sugar derivatives after chemical derivatization.
Orbitrap HRMS: Thermo Q Exactive Plus
– High-resolution profiling for untargeted or confirmatory analysis.
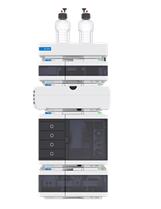
Agilent 1260 Infinity II HPLC (Fig from Agilent)
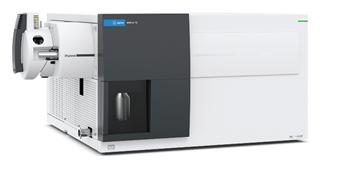
Agilent 6495C Triple Quadrupole (Figure from Agilent)
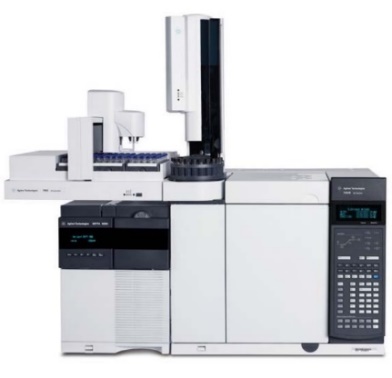
Agilent 7890B-5977B (Figure from Agilent)
Thermo Fisher Q Exactive (Figure from Thermo Fisher)
Sample Requirements for Fructose Analysis Service
| Sample Type | Minimum Amount Required | Recommended Storage | Notes |
|---|---|---|---|
| Plasma/Serum | ≥ 100 µL | -80°C | Use EDTA or heparin anticoagulants |
| Urine | ≥ 500 µL | -20°C | First morning urine preferred |
| Tissue (animal/plant) | ≥ 50 mg | -80°C | Snap freeze immediately after collection |
| Cell Pellet | ≥ 1 × 10⁶ cells | -80°C | Wash with PBS before freezing |
| Plant Extract | ≥ 50 mg (dry weight) | -80°C | Freeze-dry if long-term storage needed |
| Food Sample | ≥ 1 g | -20°C | Homogenize for consistency |
| Culture Supernatant/Medium | ≥ 1 mL | -20°C | Filter to remove particulates |
FAQ of Fructose Analysis Service
Can fructose analysis distinguish between natural and added fructose in food samples?
Yes, our methods (e.g., UPLC-MS/MS and GC-MS) can differentiate fructose sources by analyzing isotopic signatures or contextualizing results with dietary profiles. For example, natural fructose in fruits often coexists with fiber and antioxidants, while added fructose (e.g., in HFCS) may correlate with specific metabolic markers like uric acid.
How should I prepare liquid samples (e.g., beverages) to avoid interference during analysis?
Liquid samples should be centrifuged to remove particulates and filtered (0.22 µm membrane) before analysis. For syrups or viscous samples, dilution with ultrapure water is recommended to ensure accurate quantification.
What is the minimum detectable fructose concentration in complex matrices like plant extracts?
Our detection limit is as low as 5 ng/mL for plasma and tissue, but plant extracts may require additional purification due to interfering compounds (e.g., polyphenols). Typical quantification thresholds for plant samples start at 0.1 µg/g dry weight.
Can the analysis detect fructose in fermented products (e.g., kombucha or beer)?
Yes, but fermentation byproducts (e.g., ethanol or organic acids) may require derivatization steps for GC-MS analysis. We recommend specifying fermentation conditions to optimize sample preparation.
How do you handle samples with fructose concentrations exceeding the linear range?
Samples are diluted systematically and reanalyzed to ensure results fall within the validated range (5 ng/mL–10,000 ng/mL). For extreme cases (e.g., honey), we use gravimetric dilution protocols.
Is fructose-1-phosphate analysis applicable to clinical liver disease studies?
Absolutely. Fructose-1-phosphate is a key marker in hepatic fructolysis and NAFLD research. Our targeted assays quantify this metabolite with >95% precision, even in low-abundance liver biopsy samples.
Can I request simultaneous analysis of fructose and other sugars (e.g., glucose, sucrose)?
Yes, our platforms support multiplexed sugar profiling. For example, GC-MS can separate and quantify fructose, glucose, and sucrose in a single run, as demonstrated in date juice analysis.
What quality control measures ensure reproducibility across batches?
We use internal standards (e.g., ¹³C-labeled fructose) and inter-batch calibration curves. Each report includes QC metrics like CV% (<8%) and recovery rates (85–115%) .
Are results compatible with regulatory standards (e.g., FDA, EFSA)?
Our protocols align with ISO 17025 and FDA guidelines for sugar quantification. Customized reports can include compliance checks for labeling or health claims.
How long does sample storage affect fructose stability?
Freezing at -80°C preserves fructose integrity for up to 6 months. Avoid repeated freeze-thaw cycles, as they may degrade phosphorylated intermediates like fructose-6-phosphate.
Learn about other Q&A.
Fructose Analysis Service Case Study
Title: Liquid Chromatography Tandem Mass Spectrometry Quantification of 13C-Labeling in Sugars
Journal: Metabolites
Published: 2020
- Background
- Methods
- Results
- Conclusion
Understanding subcellular metabolic flux in plants is challenging due to their compartmentalized structure, with key metabolites like glucose 6-phosphate (G6P) and fructose 6-phosphate (F6P) existing in both cytosol and plastids. Traditional 13C-metabolic flux analysis (MFA) has relied heavily on nuclear magnetic resonance (NMR) to determine labeling in sugars such as sucrose, which is synthesized specifically in the cytosol and can reveal compartment-specific fluxes. However, NMR's limited sensitivity necessitates large sample quantities.
This study introduces a more sensitive and scalable method using liquid chromatography tandem mass spectrometry (LC-MS/MS) to quantify 13C-labeling in free sugars and sucrose moieties. By applying this method to maize embryos pulsed with [U-13C]-fructose, the researchers demonstrate accurate and time-resolved tracking of carbon flow in cytosolic sugar metabolism. The study marks a significant advance in plant metabolic flux analysis, offering higher sensitivity, better resolution of subcellular sugar labeling, and reduced sample requirements compared to NMR-based techniques.
Chemicals
Standard and isotopically labeled sugars, enzymes (hexokinase, invertase), and solvents (LC-MS grade acetonitrile, methanol) were sourced from Sigma, Isotec, and Fisher Scientific.
Plant Materials and Culture Conditions
Maize (Zea mays L., ALEXHO S K SYNTHETIC C20) was grown in a greenhouse. Embryos at 18 DAP were aseptically dissected and incubated on defined medium containing glucose, fructose, glutamine, PEG, MS salts, vitamins, and MES buffer (pH 5.8). For pulse-labeling, unlabeled fructose was replaced with [U-13C] fructose. Embryos were sampled over a time course ranging from 0 to 5600 minutes and lyophilized for downstream analysis.
Soluble Sugar Extraction
Freeze-dried embryos were ground and subjected to boiling water extraction. Extracts were lyophilized and stored at −20 °C until LC-MS/MS analysis. No internal standards were added.
13C Labeling and Enzymatic Treatment
Free sugars were reconstituted and split for three treatments:
1. Control – directly diluted and analyzed.
2. Hexokinase treatment – to phosphorylate free glucose and fructose.
3. Invertase treatment – to hydrolyze sucrose into fructosyl and glucosyl subunits.
Each sample was filtered (3 kDa) and mixed with acetonitrile prior to LC-MS/MS analysis.
LC-MS/MS Analysis
13C-label incorporation into glucose, fructose, and sucrose subunits was quantified using multiple reaction monitoring (MRM) as previously described.
Service Note – Creative Proteomics
Creative Proteomics offers comprehensive stable isotope tracing, plant metabolomics, and targeted sugar profiling services. Based on this case, they can support:
- Custom 13C tracer experiments in plant tissues
- Quantification and isotopomer analysis of sugars via LC-MS/MS
- Enzyme-based sugar fractionation workflows
- Data interpretation for metabolic flux analysis
Our service includes sample preparation, labeling setup, LC-MS/MS quantification, and advanced data analysis tailored to plant metabolic research.
Sugar Identification and Analysis: LC-MS/MS successfully identified and quantified three major free sugars in maize embryos—fructose, glucose, and sucrose.
Enzymatic Validation: Hexokinase treatment eliminated glucose and fructose signals, confirming their complete phosphorylation. Invertase treatment fully hydrolyzed sucrose into glucose and fructose.
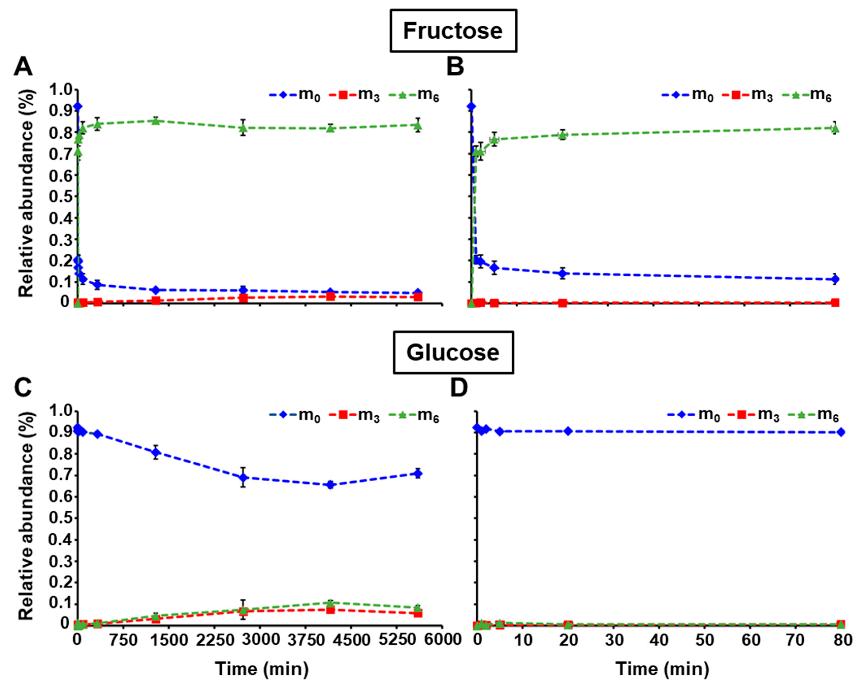
13C Labeling Dynamics: Pulse labeling with [U-13C] fructose revealed rapid incorporation into intracellular fructose (m6 reached 83.4%), while glucose labeling was delayed due to uptake of unlabeled glucose (m6 reached only 8.5%).
Sucrose Subunit Labeling: Distinct 13C-labeling patterns in the fructosyl and glucosyl moieties of sucrose reflect different labeling dynamics of cytosolic F6P and G6P.
Evidence of Substrate Cycles: The presence of m3 isotopomers in fructose and sucrose confirms the operation of the sucrose synthesis/degradation cycle. The faster appearance of glucose m3 relative to fructose m3 indicates the coexistence of the sucrose cycle and glucose-6-phosphatase activity.
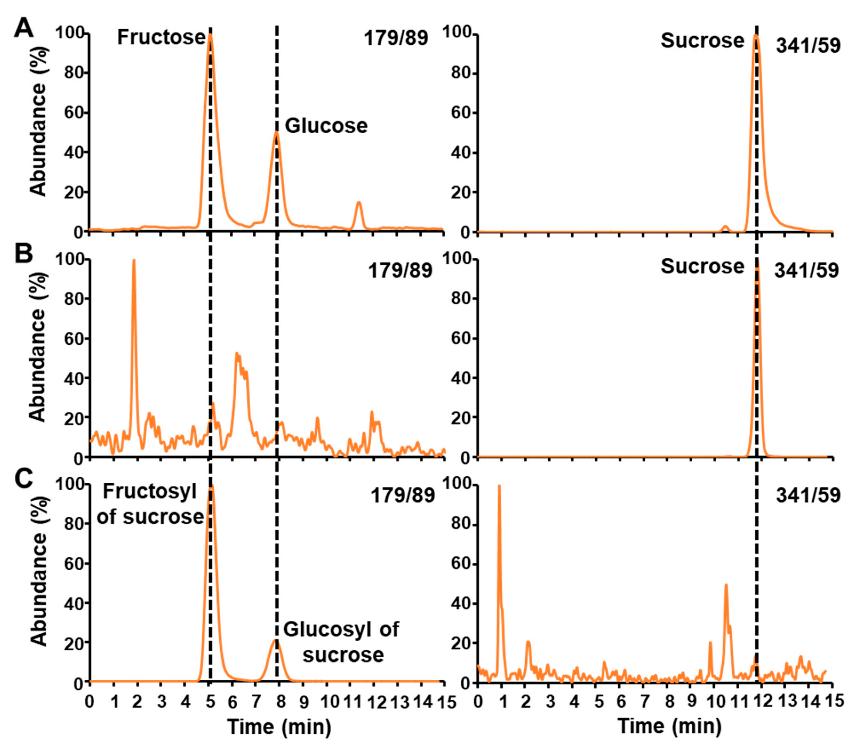 LC-MS/MS chromatograms of free sugars before and after enzymatic treatments.
 LC-MS/MS chromatograms of free sugars before and after enzymatic treatments.
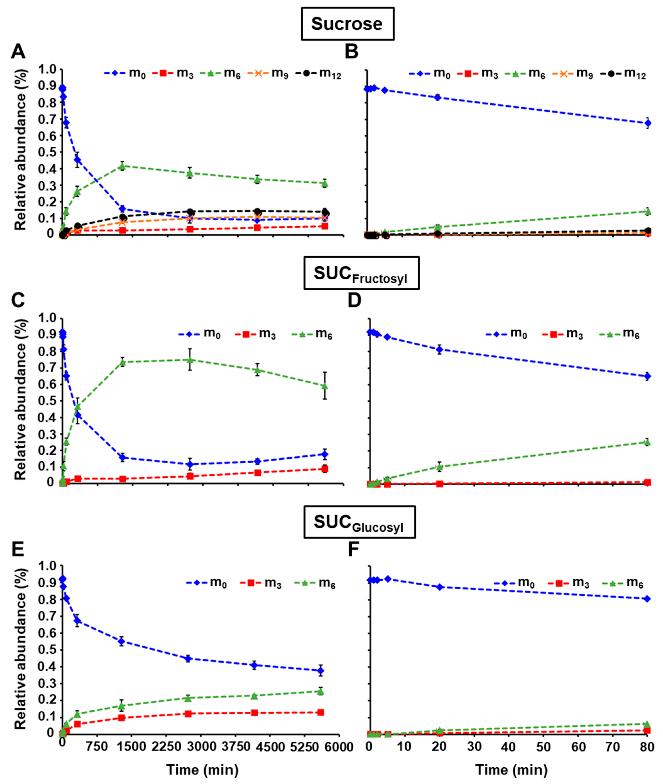 Relative abundance of isotopomers for 13C-fructosyl and 13C-glucosyl units from sucrose during the pulse labeling experiment.
This study demonstrates a robust approach combining LC-MS/MS, enzymatic treatments, and 13C pulse labeling to track carbon fluxes in maize embryos. It provides direct evidence for active sucrose substrate cycling and glucose-6-phosphatase activity during embryo development. The ability to distinguish 13C-labeling in the individual moieties of sucrose offers new insights into the dynamics of cytosolic hexose phosphates and reveals the flexibility of carbon metabolism in developing plant tissues.
Reference
- Cocuron, Jean-Christophe, Zacchary Ross, and Ana P. Alonso. "Liquid chromatography tandem mass spectrometry quantification of 13C-labeling in sugars." Metabolites 10.1 (2020): 30. https://doi.org/10.3390/metabo10010030.
Publications
Here are some publications in Metabolomics research from our clients:

- Conformational differences between functional human immunodeficiency virus envelope glycoprotein trimers and stabilized soluble trimers. 2019. https://doi.org/10.1128/jvi.01709-18
- Identification of the O-Glycan Epitope Targeted by the Anti-Human Carcinoma Monoclonal Antibody (mAb) NEO-201. 2022. https://doi.org/10.3390/cancers14204999
- Alternative glycosylation controls endoplasmic reticulum dynamics and tubular extension in mammalian cells. 2021. https://doi.org/10.1126/sciadv.abe8349
- Modulation of the Endomembrane System by the Anticancer Natural Product Superstolide/ZJ-101. 2023. https://doi.org/10.3390/ijms24119575