Lipidomics Pathway Analysis Service Unlocks Mechanistic and Biomarker Insights
From lipid data to biological insight
We convert raw lipidomic measurements into mechanistic narratives. Our lipidomics pathway analysis bridges the gap between lipid lists and functional understanding—delivering pathway enrichment, network maps, and hypothesis generation.
Core advantages:
- Comprehensive lipid pathway enrichment and mapping
- Contextual lipid metabolism analysis across classes
- Lipid network analysis to reveal regulation
- Custom models tuned for research, CRO, and pharma scale
Submit Your Request Now
×
- Lipid pathway enrichment analysis you can trust
- Lipid metabolism analysis with pathway context
- Lipidomics pathway enrichment for biomarker discovery
- Lipid network analysis to reveal mechanism
- Why It Matters
- Applications
- Workflow
- Multi-Omics & Project Models
- Advantage
- Samples
- Case Study
- FAQ
- Demo
Why Lipidomics Pathway Analysis Matters
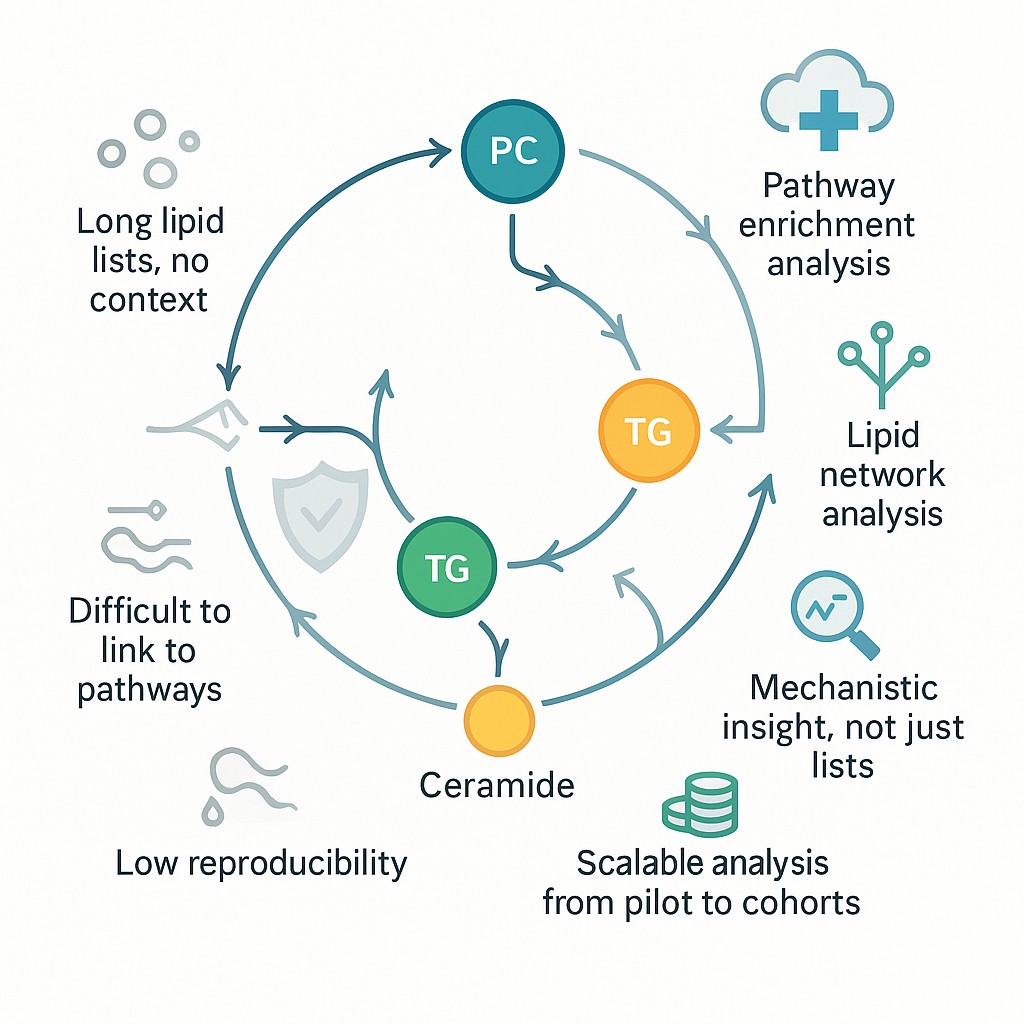
Lipidomics experiments often yield dozens or hundreds of lipid species that differ between conditions—but those lists tell you what has changed, not why. Lipidomics pathway analysis bridges that gap by translating differential lipids into mechanistic insight about metabolic rewiring, regulatory control, and enzyme activity.
The limitation of differential lipid lists
- A mere list of up/down lipids lacks biological context.
- Researchers may struggle to prioritize which lipids are most relevant.
- Without pathway mapping, it's hard to infer upstream regulators or cascade effects.
Pathway & network context reveals mechanisms
- Lipid pathway enrichment analysis highlights metabolic routes disproportionately altered.
- Lipid network analysis maps correlations and interactions among lipid species.
- Together, they allow hypothesis generation: e.g., which enzymes may drive shifts, or which subnetworks matter in a disease or perturbation.
Field trends & existing tools
- High-coverage lipidomics accelerates the need to interpret beyond lists. (Zhao et al., "High-coverage lipidomics for functional lipid and pathway analyses")
- BioPAN is a leading platform: it compares experimental conditions to flag active or suppressed lipid pathways and predict enzymatic regulation.
- Tools like LipidSig help integrate network, differential, and correlation analyses.
By combining differential lipid identification with pathway and network mapping, your data becomes a biological narrative—not just numbers. That's the core value of our Lipidomics Pathway Analysis Service.
Applications
Lipidomics pathway analysis adds value across many research domains. Below are the core use cases where this service drives biological insight and impact.
Biomarker Discovery & Validation
- Researchers often identify candidate lipids linked to a phenotype. Pathway analysis helps prioritize which pathways those lipids implicate, improving biomarker specificity.
- In drug studies, enriched lipid pathways can guide downstream validation efforts or panel selection.
- For example, in drug development, targeted and untargeted lipidomics use pathway analysis to define pharmacodynamic (PD) markers of treatment response (Li et al., "Lipidomics in drug discovery and development")
Mechanistic / Mode-of-Action Studies
- When a perturbation (drug, genetic knockout, diet) changes lipid profiles, pathway analysis reveals which metabolic routes are affected.
- Lipid network analysis uncovers upstream enzymes or metabolic bottlenecks.
- This level of insight is critical for hypothesis refining, lead optimization, or side-effect profiling.
Disease & Biological Model Research
- In models of metabolic disease, neurodegeneration, or inflammation, lipid pathway shifts often reflect disease progression.
- Mapping dysregulated lipid metabolism can point to mechanistic nodes or therapeutic intervention points.
- Studies often combine lipidomics with transcriptomics or proteomics to verify pathway-level coherence.
Nutritional, Environmental & Stress Perturbation Studies
- Lipid metabolism is highly sensitive to diet, toxins, or stress. Pathway analysis can reveal how lipid networks adapt under external pressures (e.g., nutritional interventions).
- Agricultural and microbial systems also benefit: lipid pathway modeling in crops or microbes can inform breeding, yield, or metabolic engineering (per our own resource, "Comprehensive Lipidomics Pathway Analysis Applications")
Multi-Omics Integration & Network Modeling
- Combining lipidomics pathway results with proteomics, transcriptomics, or metabolomics provides system-level insight.
- Joint pathway enrichment, correlation networks, or causal modelling help trace upstream regulators or downstream effectors.
- This integrated view strengthens mechanistic claims and bolsters lead hypotheses.
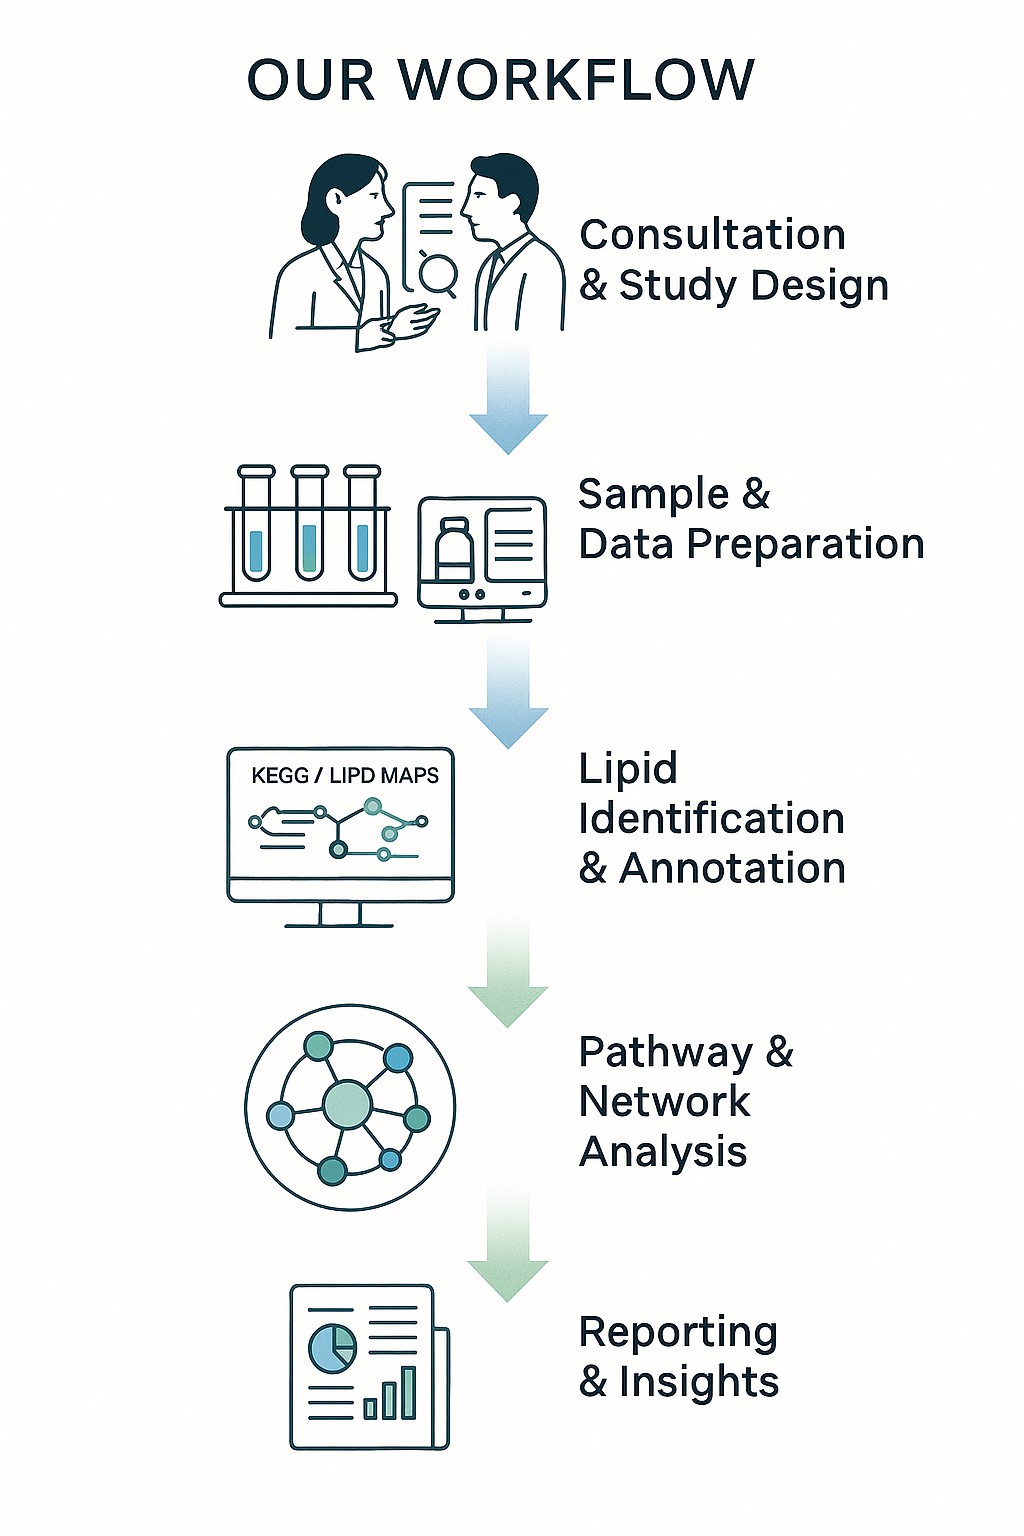
Our Workflow: End-to-End Pipeline
We operate a streamlined, modular pipeline to convert your lipidomics data into actionable pathway and network results. Each step is quality controlled and customizable.
1. Project Consultation & Study Design
Before analysis begins, we discuss your research goals, sample type, cohort setup, and hypotheses. We tailor the workflow to your study—whether exploratory or hypothesis-driven.
2. Data Input & Preprocessing
We accept both targeted lipidomics and untargeted lipidomics datasets.
- For untargeted workflows, we support LC-MS / SWATH or DDA approaches (e.g., MS-DIAL workflows)
- Raw data undergoes peak detection, alignment, deconvolution, and filtering.
- QC normalization and batch correction are applied to reduce technical bias.
3. Lipid Annotation & Database Matching
- We match features to known lipids via spectral libraries and in-silico databases (LMSD, LIPID MAPS)
- Ambiguous species are flagged; where needed, we retain sum composition-level annotation.
- We standardize nomenclature (e.g.,, lipid class, chain length, saturation) to ensure cross-sample comparability.
4. Differential Lipid Detection
- Statistical tests (e.g., t-test, ANOVA, linear models) identify significantly changed lipids.
- We adjust for multiple testing (e.g., FDR) and provide fold changes, p-values, effect sizes.
- Optionally, we stratify analysis by subgroup, time point, or covariates.
5. Pathway Mapping & Enrichment
- Differential lipids are mapped to metabolic pathways (e.g., glycerophospholipid metabolism, sphingolipid pathways) using curated models.
- We perform lipid pathway enrichment analysis (e.g., Over Representation Analysis, GSEA-like approaches) to identify pathways disproportionately altered.
- Enriched pathways are ranked and visualized with significance metrics.
6. Network / Topology Analysis
- We build lipid correlation networks to reveal co-regulated lipid clusters.
- Reaction network models connect lipids via enzyme-catalyzed reactions (e.g., from precursors to products).
- Topological metrics (connectivity, hub lipids) help pinpoint central nodes in lipid regulation.
7. Biological Interpretation & Hypothesis Generation
- Enriched pathways and network hubs are interpreted in the context of your biological model (e.g., disease, perturbation, drug).
- We generate hypotheses about enzyme regulation, upstream signaling, and lipidome reprogramming.
- Optionally, we cross-reference with external omics (metabolome, proteome) or literature.
8. Deliverables & Reporting
- Final report includes QC metrics, differential lipid tables, enrichment results, network visualizations, and biological interpretation.
- We supply raw and intermediate files (annotated lipid matrices, mapping tables, scripts).
- We offer optional interactive dashboards or consultation for follow-up work.
Multi-Omics Integration & Expanded Insights
Lipidomics is powerful on its own, but its full potential emerges when integrated with other molecular layers (proteomics, transcriptomics, metabolomics). Through multi-omics integration, you can trace upstream regulation, downstream effects, and cross-layer crosstalk—turning lipid pathway signals into system-level understanding.
Why integrate lipidomics with other omics?
- Proteins regulate enzymes that drive lipid metabolism; integrating proteomics helps link observed lipid changes to enzyme abundance or activity.
- Transcriptomics reveals gene expression regulation upstream of lipid metabolic enzymes.
- Metabolomics captures small molecules (substrates, cofactors) that directly feed into lipid pathways.
- By combining these layers, you can resolve causality (e.g., gene → protein → lipid), validate hypotheses, and reduce false positives.
Integration strategies we use
| Strategy | Description | How Creative Proteomics Supports It |
|---|---|---|
| Correlation-based integration | Compute pairwise correlations between lipid levels and proteomics / transcriptomics features | We align sample sets, normalize across omics, and compute inter-omic correlation networks |
| Pathway-based joint enrichment | Perform enrichment analysis on each omics type, then combine shared pathways | We map common pathways (e.g., "glycerophospholipid metabolism") across datasets to highlight consistent signatures |
| Network integration / graph fusion | Construct a multi-layer network linking lipids, metabolites, and proteins | We embed lipid-protein networks (e.g., as in "lipid–metabolite–protein mapping") |
| Machine learning / multivariate models | Use integrative features (lipid + protein + gene) for classification, clustering or prediction | We support multivariate modeling (e.g., PLS, random forest) across omics layers |
Project Models
| Model Type | Ideal For | What You Get | Flexibility / Add-Ons |
|---|---|---|---|
| Pilot / Proof-of-Concept | Small cohorts, exploratory studies | Full pathway and network analysis on limited sample sets | Option to expand to full cohort analysis |
| Standard Project (Cohort Study) | Moderate sample sizes (e.g., 20–100 samples) | Complete differential, enrichment, network, interpretive deliverables | Add modules (e.g., enzyme prediction, dashboard, multi-omics) |
| Large / High-Throughput Study | Large cohorts or multi-arm trials | Scalable pipeline, automated QC, batch handling, cross-cohort comparisons | Tiered sub-analysis, subgroup splits, scaled reporting |
| Custom / Collaborative Research | Hybrid goals, novel biology, method development | Co-designed workflows, shared algorithm design, manuscript co-development | Additional support for data integration, software tools, training |
Technical Differentiators & Strengths
| Feature / Capability | What It Means for You | Advantage |
|---|---|---|
| High lipid species coverage & class breadth | Able to annotate hundreds to thousands of lipid species across major classes | Broader coverage gives more pathways to analyze and more insight into metabolic rewiring |
| Curated pathway & reaction models | Use of ontology and reaction networks from LIPID MAPS, KEGG, Reactome | Ensures pathway assignments are biologically grounded and less noise |
| Advanced enrichment & network algorithms | ORA, GSEA-style, reaction enrichment, network topology metrics | More robust identification of significant pathways and regulatory hubs |
| Customizable lipid network modeling | Build correlation / reaction networks tailored to your system | Helps you focus on context-relevant subnetworks (not generic maps) |
| Rigorous QC, normalization & batch correction | Internal controls, normalization strategies, outlier detection | Reduces false positives and improves reproducibility across batches |
| Scalability & project flexibility | From small pilot to large cohorts, and modular add-on options | You can start small and expand without switching providers |
| Integration support for multi-omics | Interfaces with proteomics, transcriptomics, metabolomics | Enables system-level insight and easier hypothesis linking |
| Transparent deliverables & reproducibility | Delivery of raw, intermediate, annotated data and scripts | Facilitates auditability, method tracking, and further custom analysis |
Sample Types & Compatibility
| Sample Type | Recommended Amount | Notes & Considerations |
|---|---|---|
| Animal Tissue | 100–200 mg | Rinse with pre-chilled water to remove blood; freeze in liquid nitrogen and store at −80 °C. |
| Plant Tissue | 100–200 mg | Collect at consistent time/conditions; wrap in foil or tube; freeze in liquid nitrogen. |
| Plasma / Serum | >100 µL | Collect with appropriate anticoagulant; avoid hemolysis; store at −80 °C. |
| Urine | 200–500 µL | Centrifuge to remove debris; freeze immediately; aliquot to avoid thaw cycles. |
| Saliva / Amniotic Fluid / Bile / Tears | >200 µL | Collect under sterile conditions; rapid freezing required to prevent degradation. |
| Cells (Suspension / Adherent) | >1×10⁷ cells | Wash with PBS; pellet ~50 µL; quick-freeze in liquid nitrogen; ship on dry ice. |
| Culture Supernatant | >2 mL | Collect serum-free medium for extracellular metabolites; centrifuge to remove cells. |
| Wastewater / Microbial Culture | >2 mL | Rapid freezing required; microbial metabolism is fast—process immediately. |
| Feces / Intestinal Contents | 100–200 mg | Aliquot fresh sample into tubes; freeze promptly; avoid repeated thawing. |
| Soil Samples | >1 g | Freeze-dry, sieve (2 mm), and freeze at −80 °C; ship with ample dry ice. |
| Swab Samples | 2 swabs | For throat/nasal/dental plaque; avoid contamination; freeze swab heads at −80 °C. |
Practical Notes for Lipidomics Pathway Analysis
- Consistency: Collect replicates under uniform conditions (time, location, diet, etc.) to improve reproducibility.
- Low-temperature handling: All samples should be flash-frozen in liquid nitrogen and stored at −80 °C until shipment.
- Replicates: Recommended numbers—≥6–8 for microorganisms/plants, ≥8–10 for model organisms, ≥30 for clinical samples.
- Matrix effects: Lipid yield differs by sample type (e.g.,, plasma vs. urine). Our team provides extraction methods tailored to each matrix.
By aligning with these guidelines, you ensure that your lipidomics pathway analysis project starts with samples that are intact, representative, and ready for robust downstream interpretation.
Deliverables & Output
Our lipidomics pathway analysis service provides more than raw data. Each project includes structured outputs designed to support publication, regulatory submission, and downstream hypothesis testing.
What You Receive
Quality Control Report
- Instrument performance metrics, blank runs, internal standards
- Normalization methods and batch effect assessments
Differential Lipid Tables
- Fold changes, p-values, adjusted FDR, effect sizes
- Lipid class, chain length, saturation, and annotation confidence levels
Pathway Enrichment Results
- Lists of enriched lipid pathways with significance scores
- Pathway diagrams with highlighted altered nodes
- Enzyme-level predictions where available
Network Visualizations
- Correlation networks showing lipid co-regulation
- Reaction networks linking precursors, products, and enzymes
- Topology analysis: hub lipids, bottlenecks, subnetworks
Interpretation Summary
- Biological context of pathway changes
- Hypothesis suggestions for enzymes, signaling nodes, or regulatory axes
- Integration with transcriptomics or proteomics findings (if available)
Raw and Intermediate Data Files
- Processed data matrices (normalized intensity or absolute concentrations)
- Mapping tables linking lipids to identifiers (KEGG, LIPID MAPS, HMDB)
- Option to include raw vendor MS files for transparency
Publication-Ready Figures
- Heatmaps, volcano plots, PCA score plots
- Pathway diagrams formatted for journal submission
- Editable high-resolution images and statistical tables
Client Case Study: Lipidomics in Chronic Myeloid Leukaemia (CML) Resistance
Gonzalez, M. A., Olivas, I. M., Bencomo‐Alvarez, A. E., Rubio, A. J., Barreto‐Vargas, C., Lopez, J. L., ... & Eiring, A. M. Loss of G0/G1 switch gene 2 (G0S2) promotes disease progression and drug resistance in chronic myeloid leukaemia (CML) by disrupting glycerophospholipid metabolism. Clinical and Translational Medicine
https://onlinelibrary.wiley.com/doi/epdf/10.1002/ctm2.1146
- Background
- Methods
- Results
- Conclusions
Chronic myeloid leukaemia (CML) has become a manageable condition with tyrosine kinase inhibitors (TKIs), yet drug resistance and relapse remain a clinical challenge. Researchers sought to understand whether lipid metabolism contributes to therapy resistance, focusing on the G0/G1 switch gene 2 (G0S2), a regulator of lipid homeostasis.
To investigate the role of G0S2 in CML progression, the research team performed:
- RNA sequencing and gene expression profiling of patient CD34+ cells.
- In vitro functional assays on CML cell lines and patient samples.
- LC/MS-based untargeted lipidomics analysis provided by Creative Proteomics, including lipid extraction, UPLC separation, and high-resolution MS acquisition.
- Pathway enrichment analysis of dysregulated lipid species to identify affected pathways.
Creative Proteomics' lipidomics workflow revealed that loss of G0S2 expression disrupted glycerophospholipid metabolism in CML cells. Specifically:
- Knockdown of G0S2 reduced long-chain phosphatidylcholines and phosphatidylethanolamines, while ectopic expression restored them.
- Altered glycerophospholipids were strongly linked to impaired differentiation and therapy resistance.
- Integration with RNA-seq showed that lipid pathway dysregulation correlated with poor survival in CML patients.
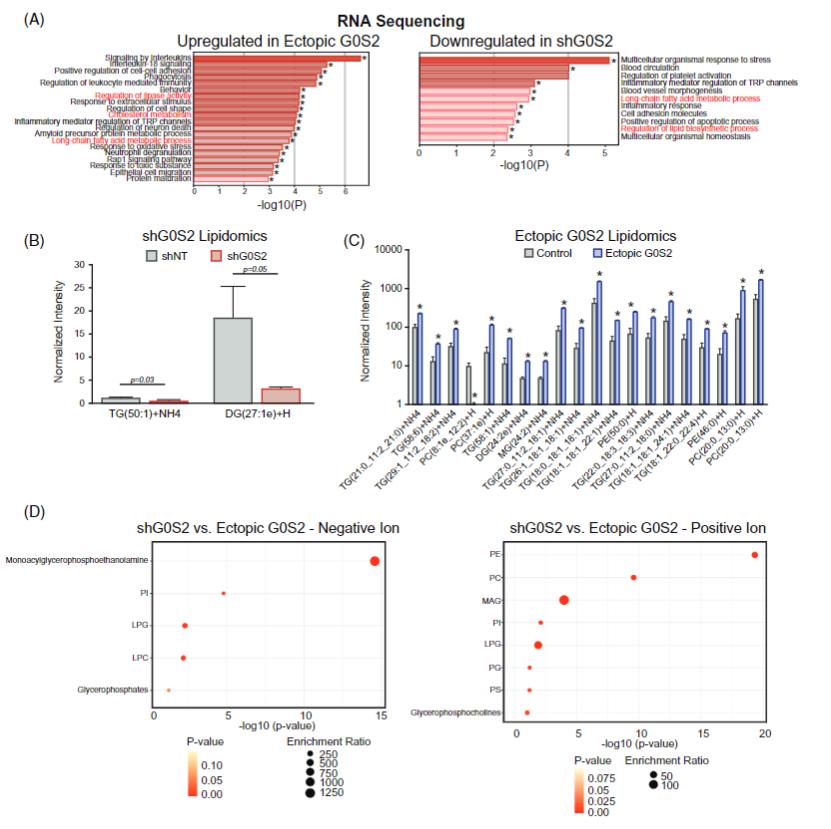 Figure. LC/MS-based lipidomics reveals that loss of G0S2 alters glycerophospholipid metabolism in CML, reducing long-chain PC and PE species while ectopic G0S2 restores lipid balance.
This study demonstrated that G0S2 functions as a tumour suppressor by maintaining glycerophospholipid balance in CML. Loss of G0S2 promoted TKI resistance, highlighting lipid metabolism as a potential therapeutic target.
By delivering high-resolution lipidomics data, Creative Proteomics enabled the client to connect metabolic rewiring with clinical drug resistance, providing novel insights into differentiation blockade in CML.
Publications
Here are some publications in lipidomics research from our clients:

- The olfactory receptor Olfr78 promotes differentiation of enterochromaffin cells in the mouse colon. 2024. https://doi.org/10.1038/s44319-023-00013-5
- Prospective randomized, double-blind, placebo-controlled study of a standardized oral pomegranate extract on the gut microbiome and short-chain fatty acids. 2023. https://doi.org/10.3390/foods13010015
- Annexin A2 modulates phospholipid membrane composition upstream of Arp2 to control angiogenic sprout initiation. 2023. https://doi.org/10.1096/fj.202201088R
- Loss of G0/G1 switch gene 2 (G0S2) promotes disease progression and drug resistance in chronic myeloid leukaemia (CML) by disrupting glycerophospholipid metabolism. 2022. https://doi.org/10.1002/ctm2.1146
- Evidence for phosphate-dependent control of symbiont cell division in the model anemone Exaiptasia diaphana. 2024. https://doi.org/10.1128/mbio.01059-24
FAQs
Do you require raw mass spec files, or can I send processed lipid tables?
You can send either. For highest fidelity, we prefer raw LC-MS data (e.g., vendor format) so we can reprocess, QC, and normalize using our pipeline. But if you only have a processed lipid abundance table with annotation, we can accept that—with caveats about annotation confidence and missing metadata.
Which pathway databases and models do you support?
We use curated lipid pathway resources such as LIPID MAPS, KEGG, Reactome, and reaction databases (e.g., Rhea). We also integrate tools like BioPAN to infer enzyme activity from lipid subclass changes.
If your system (e.g., non-mammalian organism) is outside standard models, we can custom-adapt pathway maps or build new ones.
What happens if many lipids remain unannotated or unmatched to pathways?
This is common in cutting-edge lipidomics.
- We flag unmatched lipids and retain them at the class or sum composition level.
- We provide sensitivity analyses that examine whether conclusions shift when including or excluding ambiguous lipids.
- In many cases, pathway or network signals still emerge from the annotated subset.
How do you handle technical bias, batch effects, or low signal lipids?
- We include internal standards, QC samples, blank runs, and replicate injections to assess instrument variability.
- We apply normalization, batch correction (e.g., using ComBat or similar methods), and outlier filtering.
- We prune low-signal lipids (below detection threshold) to reduce noise, but always retain transparency in how filtering is applied.
Can you handle different sample types, such as exosomes, tissues, cells, or biofluids?
Yes — we support plasma, serum, tissues, cells, exosomes/EVs, biofluids, plant/microbial matrices, and more (see Section 5).
We tailor extraction, cleanup, and QC strategies per matrix to optimize lipid recovery and reduce interference.
Can you combine lipidomics pathway results with proteomics, transcriptomics, or metabolomics data?
Yes — our multi-omics integration module links lipid changes with enzyme expression, gene regulation, and metabolite context (Section 8).
This integration helps prioritize hypotheses and validate pathway consistency across molecular layers.
What is the minimum sample size or number of replicates required?
While there's no fixed limit, we typically recommend ≥ 6–8 biological replicates per group for pilot studies, and ≥ 20–30 replicates for cohort studies to ensure statistical power.
If your sample set is smaller, we can still run analysis but interpret results more cautiously.
How do you ensure interpretability and reproducibility of results?
- We provide full deliverables: raw/intermediate files, mapping tables, scripts, QC logs, and interpretable figures.
- Our pipeline and methods are transparent and versioned.
- You retain access to all data, visuals, and tables for further custom work or audits.
Are your results suitable for publication and regulatory review?
Absolutely. Our deliverables include publication-ready figures, clear statistical reports, and workflows that adhere to standards for reproducibility.
Many clients use our outputs directly in manuscripts, posters, and internal documentation.
Learn about other Q&A.
Demo
Figures come from (Li, Y.et.al, Sci Rep,2023)

PCA chart
Quickly show the distribution of samples across principal components.

OPLC-DA point cloud diagram
Illustrate the separation of sample groups in a multidimensional space.

Plot of multiplicative change volcanoes
Volcano plot depicting multiplicative changes in metabolite levels.

Sample Hierarchical Clustering
Each column in the figure represents a sample
References
- Lin WJ, Shen PC, Liu HC, Cho YC, Hsu MK, Lin IC, Chen FH, Yang JC, Ma WL, Cheng WC. LipidSig: a web-based tool for lipidomic data analysis. Nucleic Acids Res. 2021 Jul 2;49(W1):W336-W345. doi: 10.1093/nar/gkab419. PMID: 34048582; PMCID: PMC8262718.
- Lam SM, Wang Z, Li B, Shui G. High-coverage lipidomics for functional lipid and pathway analyses. Anal Chim Acta. 2021 Feb 22;1147:199-210. doi: 10.1016/j.aca.2020.11.024. Epub 2020 Nov 25. PMID: 33485579.