Phosphoproteomics serves as a critical methodology for investigating and measuring cellular signal transduction and protein functional regulation. Nevertheless, the inherent dynamic characteristics and low stoichiometry of phosphorylation frequently introduce methodological pitfalls in such studies. This work aims to assist laboratory personnel and CRO collaborators in recognizing these prevalent issues while offering actionable strategies for circumventing them, thereby ensuring phosphoproteomic experiments achieve both success and high-quality outcomes.
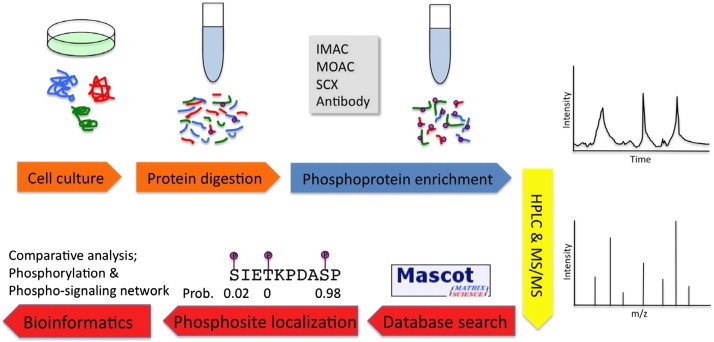 Summary of MS-based phosphoproteomics experiments (Liu Y et al., 2014)
Select Service
Learn more
Trap 1: Incomplete Phosphatase Inhibition During Cell Lysis
Manifestation
When phosphatases retain activity throughout cell lysis in phosphoproteomic studies, sustained dephosphorylation of modified proteins occurs, diminishing phosphorylation signals. Tyrosine phosphorylation is especially vulnerable, with >50% loss possible during sample processing. Such signal erosion becomes critically evident in subsequent Western blot analyses, where key phosphosite signals may vanish entirely.
Mitigation Strategy
To preserve phosphorylation integrity, implement comprehensive phosphatase inhibition using the following approaches:
Quenching Buffer Composition
- Utilize a buffer containing:
- Chaotropic agents: 8M urea + 2M thiourea to denature phosphatase structure
- Phosphatase inhibitors:
- 2× PhosSTOP (Roche)
- 1mM sodium orthovanadate
- 5mM sodium fluoride
- 10mM β-glycerophosphate (stabilizes modifications)
Critical Procedures
- Immediate cryopreservation: Flash-freeze harvested cells in liquid nitrogen followed by <-80°C storage to halt enzymatic activity.
- Thermal lysis: Directly add 90°C-preheated lysis buffer to instantaneously denature phosphatases during sample processing.
Trap 2: Selective Loss During Phosphopeptide Enrichment
Observed Challenges
- Phosphopeptide isolation frequently encounters three key issues:
- TiO₂ specificity limitations: >30% non-phosphopeptide retention, compromising detection accuracy
- IMAC inefficiency for polyphosphorylated species:<50% capture rates due to peptide structural heterogeneity
- Tyrosine-phosphorylation undersampling: Methodological sensitivity constraints causing detection failures
Optimization Approaches
- Mitigating nonspecific binding: Incorporate 2% DHB (2,5-dihydroxybenzoic acid) to competitively inhibit non-phosphopeptide adsorption
- Improving recovery rates: Implement StageTip fractionation with 100-300mM ammonium phosphate gradient elution
- Enhancing tyrosine-phosphorylation detection:
- Perform sequential IMAC → TiO₂ enrichment:
- IMAC broadly captures phosphopeptides
- Subsequent TiO₂ treatment increases tyrosine-phosphorylation specificity
- Retaining polyphosphorylated peptides: Augment eluents with 0.5% TFA + 40% acetonitrile to improve dissociation
- Perform sequential IMAC → TiO₂ enrichment:
Quality Control Metrics
- LC-MS/MS verification requiring:<5% non-phosphopeptide contamination post-enrichment
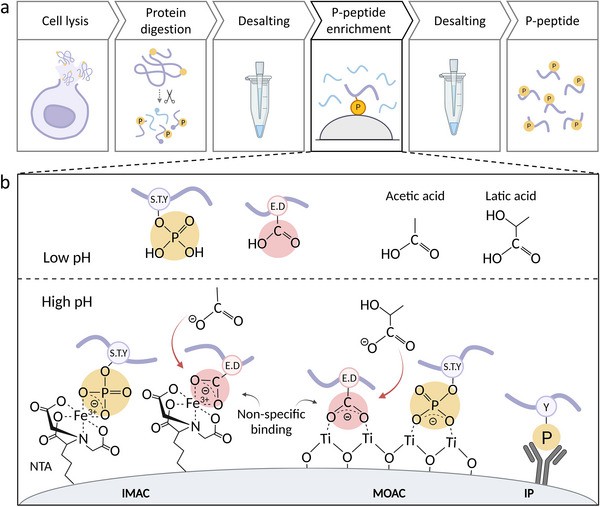 General phosphoproteomic sample preparation workflow and the principle of phosphopeptide enrichment (Muneer G et al., 2025)
Trap 3: Phosphopeptide Adsorption During Liquid Chromatography
Observed Issue
During LC separation, phosphopeptides exhibit severe peak broadening (>0.8 min peak width) on C18 columns, with >60% signal loss for low-abundance species.
Resolution Strategy
Optimize mobile phase composition and implement rigorous column maintenance to mitigate adsorption effects:
Mobile Phase Formulation
- Phase A: 0.1% formic acid + 0.5% acetic acid
→ Stabilizes peptide ionization and enhances resolution through pH modulation - Phase B: 0.1% formic acid + 0.5% acetic acid + 90% acetonitrile
→ Strengthens hydrophobic interactions to improve separation efficiency
Column Maintenance Protocol
- Post-injection treatment: Flush with 0.1% phosphoric acid for 10 min to eliminate residual contaminants
- Weekly regeneration: Wash with 0.1% phosphoric acid/50% isopropanol for 30 min to remove adsorbed phosphopeptides and extend column lifetime
Trap 4: Suboptimal MS Acquisition Parameters for Phosphoproteomics
Common Pitfalls
- DDA neutral loss oversight: Failure to trigger MS² fragmentation prevents detection of characteristic phosphopeptide losses (-98/-49/-32.7 Da)
- Fixed DIA isolation windows: Co-elution artifacts from insufficient separation compromise quantitative precision
- Excessive HCD energy: Collision energies >35% induce phosphate group cleavage, impairing site localization
Parameter Optimization
- DDA Configuration: Implement HCD-triggered MS³ scanning with neutral loss monitoring (-98, -49, -32.7 Da)
- DIA Window Design:
m/z Range Window Count Width Rationale 400-600 24 25 Da Minimizes co-elution interference 600-1000 32 15 Da Reduces high-mass ion overlap - HCD Energy Adjustment:
- Precursor m/z < 800: 28% energy (preserves labile modifications)
- Precursor m/z ≥ 800: 32% energy (ensures adequate fragmentation)
Trap 5: Low Confidence in Phosphosite Localization
Risk Assessment
Database-dependent phosphorylation site assignment exhibits >40% ambiguity in Ser/Thr-rich regions due to structural homology between these residues, compromising localization certainty.
Tiered Validation Framework
Implement sequential verification with defined thresholds to ensure phosphosite reliability:
- Level 1: Andromeda Localization Score
- Method: Site assignment via fragmentation pattern analysis
- Threshold: Score >0.75 (high-confidence localization)
- Level 2: PTM-RS Probability (DIA-NN)
- Method: Machine learning-assisted reliability evaluation
- Threshold: Probability >0.90
- Level 3: Diagnostic Neutral Loss
- Method: Verification of characteristic -98 Da fragmentation
- Threshold: ≥80% phosphopeptides must exhibit signature loss
- Level 4: Critical Target Verification
- Method: Manual spectral interpretation with orthogonal validation
- Threshold: 100% verification of key phosphosites
Trap 6: Batch Effects Compromise Quantitative Reproducibility
Characteristic Scenario
In clinical cohort analyses, inter-batch coefficient of variation (CV) exceeds 45% when processing samples sequentially. This significantly undermines result reliability and experimental reproducibility.
Batch Effect Mitigation Strategies
1. Universal Reference Standard
- Method: Generate pooled internal standards from equal aliquots of all samples
- Purpose: Enable cross-batch normalization through consistent reference signals
2. Bridging Sample Implementation
- Method: Include 10% carryover samples between batches (e.g., rerun batch 1 samples 1-5 in batch 2)
- Purpose: Establish inter-batch comparability via overlapping measurements
3. Algorithmic Normalization
- Method: Apply ComBat algorithm for empirical Bayes-based batch correction
- Requirements: ≥5 samples per group for statistical validity
- Purpose: Eliminate technical artifacts while preserving biological variance
4. Instrument Performance QC
- Method: Pre-run HeLa cell lysates; maintain quantitative CV<15%
- Protocol: Troubleshoot instrument stability when CV exceeds threshold
- Purpose: Ensure analytical consistency across acquisition sequences
Trap 7: Inadequate Starting Material Compromises Data Integrity
Critical Risk Threshold:
Protein inputs below 1 mg fail to detect >70% of phosphorylation sites.
Microsample Processing Framework
- Enrichment Protocol: Employ StageTip-based enrichment (integrating phosphorylation capture and desalting within a single tip to minimize transfer losses)
- Chromatographic Configuration: Utilize nanoLC systems with 75μm ID columns (reducing sample dilution)
- Flow Control: Maintain ≤300 nL/min flow rates (preventing microcolumn obstruction)
- Mass Spectrometry Acquisition: Exclusive TimsTOF parallel accumulation–serial fragmentation acquisition mode (5× sensitivity enhancement over conventional DDA/DIA)
Performance Validation Metrics
Benchmarks for system verification:
| Starting Material | Detection Standard | Quality Control |
|---|---|---|
| ≥100,000 HeLa cells | >12,000 phosphosites | Baseline |
| 10,000 cells | >8,000 phosphosites | CV<15% |
- Note: Experiments with<10,000 cells require pre-validation when incorporating single-cell methodologies.
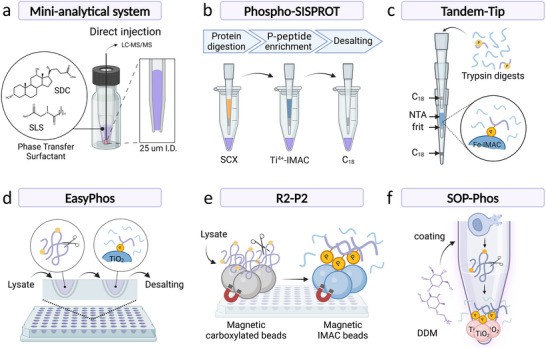 Miniaturized sample preparation workflows for microscale and nanoscale phosphoproteomics (Muneer G et al., 2025)
Trap 8: Overlooking Phosphoisomer Interference
Manifestation
Co-localized phosphorylation sites (e.g., EGFR Y1068/Y1069) exhibit spectral overlap causing:
- Quantitative distortion: Inability to resolve site-specific biological changes
- Localization failure: Erroneous mechanistic interpretation
Clinical implication: HER2+ breast cancer studies may reverse conclusions (Y1068 pro-survival vs. Y1069 pro-apoptosis)
Resolution Framework
1. Advanced Fragmentation
- Mode: ETD/EThcD (>99% phosphate retention)
- Precursor selection: z≥3 ions only
- Parameters:
- ETD duration: 2-5 ms (m/z-optimized)
- Supplemental HCD (25%) for z=2 ions
2. Algorithmic Deconvolution (IsoScale)
- Resolution: >60,000 (@200 m/z)
- Diagnostic ions: Phosphate-containing fragments exclusively
- Processing:
- Isotope cluster deconvolution
- Isomer intensity ratio modeling
- Threshold: ProbScore >0.9 for reporting
3. Synthetic Peptide Validation
Option A: Rapid Label-Free
- Synthesize Y1068-p/Y1069-p peptides (>95% purity)
- Conduct equimolar LC-MS/MS analysis
- Verify >0.3 min RT shift (0.1% TFA enhanced separation)
- Identify unique fragment ions (e.g., y₇⁺ for Y1068-p)
Option B: SILAC-Based Absolute Quantitation
| Isomer | Label Design | Quantitative Ion Criteria |
|---|---|---|
| Y1068-p | TRL[pY]ETD (light) |
|
| Y1069-p | TRLY[pT]D (¹³C/¹⁵N-Arg) |
|
|
Trap 9: Insufficient Biological Replication Leading to False Positives — A Framework for Statistical Power Assurance
Core Risk Quantification
Minimum biological replication requirements to control false positives at α=0.05 while maintaining 80% statistical power (1-β=0.8) for target effect sizes:
| Fold Change | Min. Biological Replicates (n) | Power (1-β) | α |
|---|---|---|---|
| ≥2.0 | 5 | 0.8 | 0.05 |
| 1.8 | 7 | 0.8 | 0.05 |
| 1.5 | 12 | 0.8 | 0.05 |
| 1.3 | 20 | 0.8 | 0.05 |
| Note: Increase tabulated replication by 30% when sample CV exceeds 25%. |
Four-Step Sample Size Determination Protocol
Pre-experimental CV Assessment:
- Perform phosphorylation proteomics on three technical replicate samples.
- Calculate median CV for phosphorylation sites across abundance tiers:
- High abundance (e.g., p-AKT S473)
- Medium abundance (e.g., p-ERK T202/Y204)
- Low abundance (e.g., p-STAT1 Y701)
Key Statistical Power Parameters:
- Effect Size (d): Convert fold change via d = (M₁-M₂)/SD (e.g., 1.5-fold ≈ *d*=0.5-0.7)
- Significance Threshold (α): Default = 0.05
- Statistical Power (1-β): Recommended ≥0.8
- Test Design: Two-sample t-test (two.sided)
Sample Size Interpretation:
- For *d*=0.6 (≈1.5-fold change): 12 replicates/group (calculated *n*=11.3 → rounded up)
- For *d*=0.8 (≈1.8-fold change): 7 replicates/group
Cost-Constrained Alternatives:
- Prioritize Top 50 most significantly altered sites (reducing multiple testing burden)
- Adopt paired-sample design (pre- vs. post-treatment, halving required *n*)
- Accept reduced power (e.g., 0.7) with explicit disclosure
Sensitivity Validation
- Verify calculations using the WebPower online tool: https://webpower.psychstat.org
- Method: Input actual sample size → Determine minimum detectable fold change → Confirm alignment with experimental objectives
Trap 10: Isotopic Labels Impair Tyrosine Phosphorylation Detection
Mechanistic Basis
TMT/iTRAQ reagents target peptide N-termini but react with phosphotyrosine (pY) groups. This causes:
- Steric hindrance → Reduced labeling efficiency
- Charge repulsion (alkaline reagent vs. phosphate) → 40% decreased labeling rate
Optimized Solutions
| Method | Protocol Details | Advantage |
|---|---|---|
| Dimethyl Labeling | Light: CH₂O+NaBH₃CN Heavy: CD₂O+NaBD₃CN | Minimal steric hindrance >95% pY recovery |
| Label-Free Quant | MaxLFQ algorithm + DIA acquisition | Eliminates labeling bias |
| Post-Label Dephosphorylation | TMT label → Alkaline phosphatase → TiO₂ enrichment | Restores labeling efficiency |
- Risk: Potential loss of phosphorylation dynamics
Validation Requirement
- Confirm quantitative correlation between labeled and LFQ groups for pY peptides:
- Mandatory threshold: Pearson's *r* > 0.85
Trap 11: Phosphorylation Impedes Protease Cleavage Sites
Mechanistic Evidence
- Phospho-serine/threonine residues occupying trypsin's P1 recognition site (e.g., -pS-F-K↓-):
- Cleavage efficiency reduction ≥70%
- Elevated semi-tryptic peptides (e.g., F-K↓R miscleavage)
- Phospho-tyrosine at P1 position:
- Cleavage efficiency drops to 30% of unmodified sites
- Verified through MS detection of missed pY-containing fragments
Optimized Digestion Protocol
- Denaturation & Alkylation
- 8M urea denaturation
- 5mM TCEP reduction (30 min, RT)
- 10mM iodoacetamide alkylation (30 min, dark)
- Lys-C Digestion
- 1:50 enzyme:substrate (w/w)
- 50mM TEAB (pH 8.5)
- 4 hr incubation at 37°C
- Trypsin Digestion
- 1:50 enzyme:substrate (w/w)
- 0.2% RapiGest surfactant
- 12 hr at 37°C
Digestion Efficiency Validation
| Group | Failure Criteria | Success Threshold |
|---|---|---|
| Benchmark | >20% missed cleavages | N/A |
| Control | N/A | <5% missed cleavages after 1hr phosphatase treatment (37°C) |
Contingency Measures
- Upon detecting missed cleavages:
- Supplemental trypsin digestion (50ng, 4hr)
- Glu-C assisted cleavage (pH 4.0 buffer, 6hr at 25°C)
To learn more about the workflow, please refer to "Phosphoproteomics Workflow Explained: From Sample to Data".
How to use R language and tools to analyze data, please refer to "How to Analyze Phosphoproteomics Data with R and Bioinformatics Tools".
People Also Ask
How to interpret phosphoproteomics?
Phosphoproteomics data analysis involves two major steps. The first step includes the identification, phosphosite localization, and quantification of phosphopeptides. The second step aims to translate phosphopeptide identification and quantification results into novel biological and clinical insights.
What is the difference between proteomics and phosphoproteomics?
Phosphoproteomics is a branch of proteomics that identifies, catalogs, and characterizes proteins containing a phosphate group as a posttranslational modification.
References
- Loroch S, Dickhut C, Zahedi RP, Sickmann A. "Phosphoproteomics--more than meets the eye." Electrophoresis. 2013 Jun;34(11):1483-92. doi: 10.1002/elps.201200710
- Refsgaard JC, Munk S, Jensen LJ. "Search Databases and Statistics: Pitfalls and Best Practices in Phosphoproteomics." Methods Mol Biol. 2016;1355:323-39. doi: 10.1007/978-1-4939-3049-4_22
- Kanshin E, Michnick S, Thibault P. "Sample preparation and analytical strategies for large-scale phosphoproteomics experiments." Semin Cell Dev Biol. 2012 Oct;23(8):843-53. doi: 10.1016/j.semcdb.2012.05.005
- Liu Y, Chance MR. "Integrating phosphoproteomics in systems biology." Comput Struct Biotechnol J. 2014 Aug 1;10(17):90-7. doi: 10.1016/j.csbj.2014.07.003
- Muneer G, Chen CS, Chen YJ. "Advancements in Global Phosphoproteomics Profiling: Overcoming Challenges in Sensitivity and Quantification." Proteomics. 2025 Jan;25(1-2):e202400087. doi: 10.1002/pmic.202400087


